Note
Access to this page requires authorization. You can try signing in or changing directories.
Access to this page requires authorization. You can try changing directories.
Applies to: ![]() Calculated column
Calculated column ![]() Calculated table
Calculated table ![]() Measure
Measure ![]() Visual calculation
Visual calculation
Returns a table with information about each table in the semantic model, such as table name, description, and storage mode. This information helps you understand the model and to self-document the model when used in calculated tables.
Syntax
INFO.VIEW.TABLES()
Return value
A table with the following columns:
| Column | Description |
|---|---|
| [ID] | The unique ID for each table in this semantic model as an integer. |
| [Name] | The name of each table in this semantic model as a string. |
| [Model] | The ID of the table's semantic model as a GUID. |
| [DataCategory] | The data category of each table in this semantic model as a string. |
| [Description] | The description of each table in this semantic model as a string. |
| [IsHidden] | The hidden state of each table in this semantic model as TRUE or FALSE. |
| [StorageMode] | The storage mode of each table in this semantic model as a string. |
| [TableStorage] | The name and unique ID of each table in this semantic model as a string. |
| [Expression] | The DAX formula of each table in this semantic model as a string. Only applies to calculated tables. |
| [ShowAsVariationOnly] | The show as variation only state of each table in this semantic model as TRUE or FALSE. |
| [IsPrivate] | The private state of each table in this semantic model as TRUE or FALSE. |
| [CalculationGroupPrecedence] | The calculation group precedence of each table in this semantic model as an integer. Only applies to calculation groups. |
| [LineageTag] | The lineage tag of each table in this semantic model as a string. |
Remarks
Can only be ran by users with write permission on the semantic model and not when live connected to the semantic model in Power BI Desktop. This function can be used in calculated tables, columns, and measures of a semantic model and will update when the model is refreshed.
Example 1 - DAX query
The following DAX query can be run in DAX query view:
EVALUATE
	INFO.VIEW.TABLES()
This DAX query returns a table with all of the columns of this DAX function.
Example 2 - DAX query with SELECTCOLUMNS and ADDCOLUMNS
The following DAX query can be run in DAX query view:
EVALUATE
	ADDCOLUMNS(
		SELECTCOLUMNS(
			INFO.VIEW.TABLES(),
			"Table", [Name],
			[Description],
			"Storage mode", [StorageMode],
			"Calc table DAX formula", [Expression],
			"Calc group precedence", [CalculationGroupPrecedence],
			[DataCategory]
		),
		"Table type", SWITCH(
			TRUE(),
			NOT (ISBLANK([Calc group precedence])), "Calculation group",
			NOT (ISBLANK([Calc table DAX formula])), "Calculated (DAX) table",
			[DataCategory] = "Time", "Date table",
			[DataCategory]
		)
	)
This DAX query returns a table with only the specified columns and a new column to categorize the tables with a DAX formula.
Example 3 - calculated table with SELECTCOLUMNS and ADDCOLUMNS
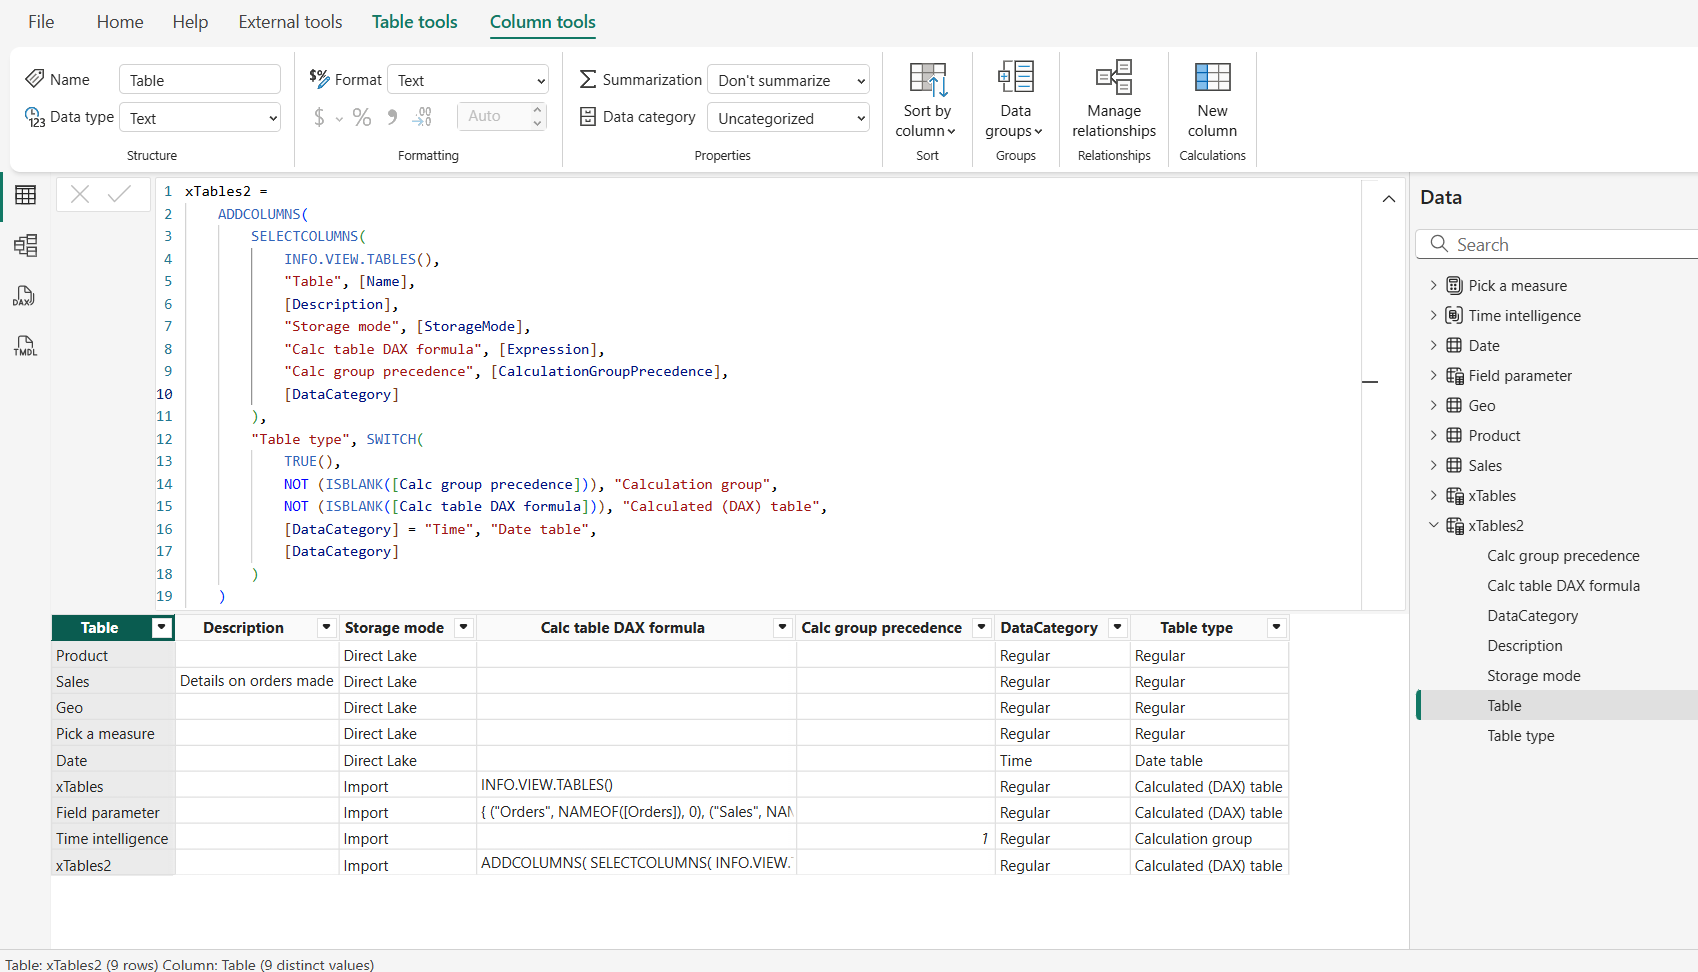
Either of the above examples work in a calculated table when the EVALUATE keyword is removed and a table name added. Here is example 2 in a calculated table:
xTables2 =
	ADDCOLUMNS(
		SELECTCOLUMNS(
			INFO.VIEW.TABLES(),
			"Table", [Name],
			[Description],
			"Storage mode", [StorageMode],
			"Calc table DAX formula", [Expression],
			"Calc group precedence", [CalculationGroupPrecedence],
			[DataCategory]
		),
		"Table type", SWITCH(
			TRUE(),
			NOT (ISBLANK([Calc group precedence])), "Calculation group",
			NOT (ISBLANK([Calc table DAX formula])), "Calculated (DAX) table",
			[DataCategory] = "Time", "Date table",
			[DataCategory]
		)
	)
This calculated table shows the same information as the DAX query in example 2 in a table in the model itself.
Example 4 - measure
The following measure can be added to count the number of calculated columns in a semantic model:
Number of calculated tables =
COUNTROWS(
    FILTER(
		INFO.VIEW.TABLES(),
    		NOT ( ISBLANK( [Expression] ) )
	)
)
This will show a scalar value with the number of calculated tables in my model.
This can be shown in a visual:
Or a DAX query in DAX query view:
DEFINE
    MEASURE 'xTables'[Number of calculated tables] =
		COUNTROWS(
			FILTER(
				INFO.VIEW.TABLES(),
					NOT ( ISBLANK( [Expression] ) )
			)
		)

EVALUATE
    SUMMARIZECOLUMNS(
        "Number of calculated tables", [Number of calculated tables]
    )


