Note
Access to this page requires authorization. You can try signing in or changing directories.
Access to this page requires authorization. You can try changing directories.
Tip
Did you know you can try the features in Microsoft Defender for Office 365 Plan 2 for free? Use the 90-day Defender for Office 365 trial at the Microsoft Defender portal trials hub. Learn about who can sign up and trial terms on Try Microsoft Defender for Office 365.
In Attack simulation training in Microsoft Defender for Office 365 Plan 2 or Microsoft 365 E5, Microsoft provides reports from the results of simulations and the corresponding trainings. This information keeps you informed on the threat readiness progress of your users, and recommended next steps to better prepare your users for future attacks.
Reports are available in the following locations on the Attack simulation training page in the Microsoft Defender portal:
- Report summaries:
- The Overview tab at https://security.microsoft.com/attacksimulator?viewid=overview.
- The Reports tab at https://security.microsoft.com/attacksimulator?viewid=reports.
- Full reports:
- The Attack simulation report page at https://security.microsoft.com/attacksimulationreport:
- The reports for in-progress and completed simulations and training campaigns: For more information, see Attack simulation report.
The rest of this article describes the available reports for Attack simulation training.
For getting started information about Attack simulation training, see Get started using Attack simulation training.
Report summaries on the Overview and Reports tabs of Attack simulation training
To go to the Overview tab, open the Microsoft Defender portal at https://security.microsoft.com, go to Email & collaboration > Attack simulation training:
- Overview tab: Verify that the Overview tab is selected (it's the default). Or, to go directly to the Overview tab, use https://security.microsoft.com/attacksimulator?viewid=overview.
- Reports tab: Select the Reports tab. Or, to go directly to the Reports tab, use https://security.microsoft.com/attacksimulationreport.
The distribution of report summaries on the tabs is described in the following table:
| Report | Overview tab | Reports tab |
|---|---|---|
| Recent simulations card | ✔ | |
| Recommendations card | ✔ | |
| Simulation coverage card | ✔ | ✔ |
| Training completion card | ✔ | ✔ |
| Repeat offenders card | ✔ | ✔ |
| Behavior impact on compromise rate card | ✔ | ✔ |
The rest of this section describes the information that's available on the Overview and Reports tabs of Attack simulation training.
Recent simulations card
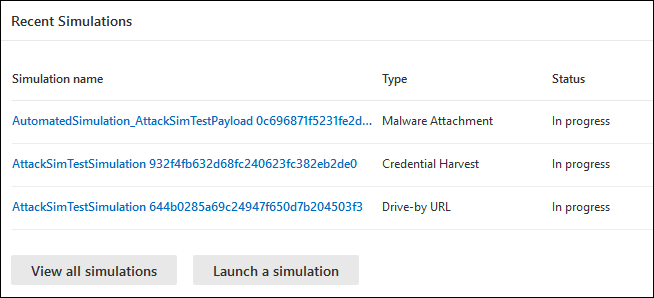
The Recent simulations card on the Overview tab shows the last three simulations that you created or ran in your organization.
You can select a simulation to view details.
Selecting View all simulations takes you to the Simulations tab.
Selecting Launch a simulation starts the new simulation wizard. For more information, see Simulate a phishing attack in Defender for Office 365.
Recommendations card
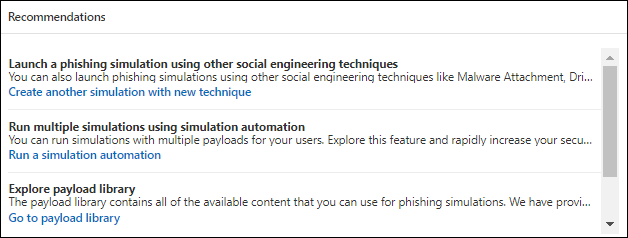
The Recommendations card on the Overview tab suggests different types of simulations to run.
Selecting Launch now starts the new simulation wizard with the specified simulation type automatically selected on the Select technique page. For more information, see Simulate a phishing attack in Defender for Office 365.
Simulation coverage card
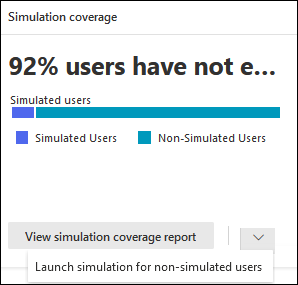
The Simulation coverage card on the Overview and Reports tabs shows the percentage of users in your organization who received a simulation (Simulated users) vs. users who didn't receive a simulation (Non-simulated users). You can hover over a section in the chart to see the actual number of users in each category.
Selecting View simulation coverage report takes you to the User coverage tab for the Attack simulation report.
Selecting Launch simulation for non-simulated users starts the new simulation wizard where the users who didn't receive the simulation are automatically selected on the Target user page. For more information, see Simulate a phishing attack in Defender for Office 365.
Training completion card
The Training completion card on the Overview and Reports tabs organizes the percentages of users who received trainings based on the results of simulations into the following categories:
- Completed
- In progress
- Incomplete
You can hover over a section in the chart to see the actual number of users in each category.
Selecting View training completion report takes you to the Training completion tab for the Attack simulation report.

Repeat offenders card
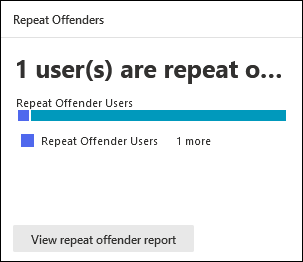
The Repeat offenders card on the Overview and Reports tabs shows the information about repeat offenders. A repeat offender is a user who was compromised by consecutive simulations. The default number of consecutive simulations is two, but you can change the value on the Settings tab of Attack simulation training at https://security.microsoft.com/attacksimulator?viewid=setting. For more information, see Configure the repeat offender threshold.
The chart organizes repeat offender data by simulation type:
- All
- Malware Attachment
- Link to Malware
- Credential Harvest
- Link in attachments
- Drive-by URL
Selecting View repeat offender report takes you to the Repeat offenders tab for the Attack simulation report.
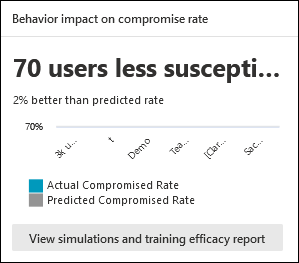
Behavior impact on compromise rate card
The Behavior impact on compromise rate card on the Overview and Reports tabs shows how your users responded to your simulations as compared to the historical data in Microsoft 365. You can use this information to track progress in users threat readiness by running multiple simulations against the same groups of users.
The chart data shows the following information:
- Actual compromise rate: The actual percentage of people who were compromised by the simulation (actual users compromised / total number of users in your organization who received the simulation).
- Predicted compromise rate: Historical data across Microsoft 365 that predicts the percentage of people who will be compromised by this simulation. To learn more about the predicted compromise rate (PCR), see Predicted compromise rate.
If you hover over a data point in the chart, the actual percentage values are shown.
To see a detailed report, select View simulations and training efficacy report. This report is explained later in this article.
Attack simulation report
You can open the Attack simulation report from the Overview tab by selecting the View ... report actions that are available on some of the cards on the Overview and Reports tabs that are described in this article. To go directly to the Attack simulation report page, use https://security.microsoft.com/attacksimulationreport
Training efficacy tab for the Attack simulation report
The Training efficacy tab is selected by default on the Attack simulation report page. This tab provides the same information that's available in the Behavior impact on compromise rate card, with more context from the simulation itself.

The chart shows the Actual compromised rate and the Predicted compromise rate. If you hover over a section in the chart, the actual percentage values for are shown.
The details table below the chart shows the following information. You can sort the simulations by clicking on an available column header. Select ![]() Customize columns to change the columns that are shown. By default, all available columns are selected.
Customize columns to change the columns that are shown. By default, all available columns are selected.
- Simulation name
- Simulation technique
- Simulation tactics
- Predicted compromised rate
- Actual compromised rate
- Total users targeted
- Count of clicked users
Use the ![]() Search box to filter the results by Simulation name or Simulation Technique. Wildcards aren't supported.
Search box to filter the results by Simulation name or Simulation Technique. Wildcards aren't supported.
Use the ![]() Export report button to save the information to a CSV file. The default filename is Attack simulation report - Microsoft Defender.csv, and the default location is the local Downloads folder. If an exported report already exists in that location, the filename is incremented (for example, Attack simulation report - Microsoft Defender (1).csv).
Export report button to save the information to a CSV file. The default filename is Attack simulation report - Microsoft Defender.csv, and the default location is the local Downloads folder. If an exported report already exists in that location, the filename is incremented (for example, Attack simulation report - Microsoft Defender (1).csv).
User coverage tab for the Attack simulation report
On the User coverage tab, the chart shows the Simulated users and Non-simulated users. If you hover over a data point in the chart, the actual values are shown.

The details table below the chart shows the following information. You can sort the information by clicking on an available column header. Select ![]() Customize columns to change the columns that are shown. By default, all available columns are selected.
Customize columns to change the columns that are shown. By default, all available columns are selected.
- Username
- Email address
- Included in simulation
- Date of last simulation
- Last simulation result
- Count of clicked
- Count of compromised
Use the ![]() Search box to filter the results by Username or Email address. Wildcards aren't supported.
Search box to filter the results by Username or Email address. Wildcards aren't supported.
Use the ![]() Export report button to save the information to a CSV file. The default filename is Attack simulation report - Microsoft Defender.csv, and the default location is the local Downloads folder. If an exported report already exists in that location, the filename is incremented (for example, Attack simulation report - Microsoft Defender (1).csv).
Export report button to save the information to a CSV file. The default filename is Attack simulation report - Microsoft Defender.csv, and the default location is the local Downloads folder. If an exported report already exists in that location, the filename is incremented (for example, Attack simulation report - Microsoft Defender (1).csv).
Training completion tab for the Attack simulation report
On the Training completion tab, the chart shows the number of Completed, In progress, and Incomplete simulations. If you hover over a section in the chart, the actual values are shown.

The details table below the chart shows the following information. You can sort the information by clicking on an available column header. Select ![]() Customize columns to change the columns that are shown. By default, all available columns are selected.
Customize columns to change the columns that are shown. By default, all available columns are selected.
- Username
- Email address
- Included in simulation
- Date of last simulation
- Last simulation result
- Name of most recent training completed
- Date completed
- All trainings
Select ![]() Filter to filter the chart and details table by a Status values of the trainings: Completed, In progress, or All.
Filter to filter the chart and details table by a Status values of the trainings: Completed, In progress, or All.
When you're finished configuring the filters, select Apply, Cancel, or ![]() Clear filters.
Clear filters.
Use the ![]() Search box to filter the results by Username or Email address. Wildcards aren't supported.
Search box to filter the results by Username or Email address. Wildcards aren't supported.
If you select the ![]() Export report button, report generation progress is shown as a percentage of complete. In the dialog that opens, you can choose to open the .csv file, save the .csv file, and remember the selection.
Export report button, report generation progress is shown as a percentage of complete. In the dialog that opens, you can choose to open the .csv file, save the .csv file, and remember the selection.
Repeat offenders tab for the Attack simulation report
A repeat offender is a user who was compromised by consecutive simulations. The default number of consecutive simulations is two, but you can change the value on the Settings tab of Attack simulation training at https://security.microsoft.com/attacksimulator?viewid=setting. For more information, see Configure the repeat offender threshold.
On the Repeat offenders tab, the chart shows the number of Repeat offender users and Simulated users.

If you hover over a data point in the chart, the actual values are shown.
The details table below the chart shows the following information. You can sort the information by clicking on an available column header. Select ![]() Customize columns to change the columns that are shown. By default, all available columns are selected.
Customize columns to change the columns that are shown. By default, all available columns are selected.
User: Name of the user.
Simulation types: Type of simulations where the user was involved.
Simulations: Name of simulations where the user was involved.
Email address: Email address of the user.
Latest repeat count: Latest count of compromises for users categorized as repeat offenders. For example, if the repeat offender threshold is set to 3, and a user was compromised in three consecutive simulations, then the latest repeat count is 3. If the user was compromised in four consecutive simulations, then the latest repeat count is 4. If the user was compromised in two consecutive simulations, then the value N/A. The latest repeat count sets to 0 (N/A), every time a repeat offender flag is reset (meaning the user passes a simulation).
Repeat offenses: Includes the number of times a user was classified as a repeat offender. For example:
- The user was classified as a repeat offender in first few simulations (they were compromised three consecutive times, where repeat offender threshold is 2).
- The user was classified as 'clean' after passing a simulation.
- The user was classified as a repeat offender in the next few simulations (they were compromised four consecutive times, where repeat offender threshold is 2).
In these cases, the number of repeat offenses is set to 2. The count updates every time a user is considered to be a repeat offender.
Last simulation name
Last simulation result
Last training assigned
Last training status
Select ![]() Filter to filter the chart and details table by one or more simulation type values:
Filter to filter the chart and details table by one or more simulation type values:
- Credential Harvest
- Malware Attachment
- Link in Attachment
- Link to Malware
When you're finished configuring the filters, select Apply, Cancel, or ![]() Clear filters.
Clear filters.
Use the ![]() Search box to filter the results by any of the column values. Wildcards aren't supported.
Search box to filter the results by any of the column values. Wildcards aren't supported.
Use the ![]() Export report button to save the information to a CSV file. The default filename is Attack simulation report - Microsoft Defender.csv, and the default location is the local Downloads folder. If an exported report already exists in that location, the filename is incremented (for example, Attack simulation report - Microsoft Defender (1).csv).
Export report button to save the information to a CSV file. The default filename is Attack simulation report - Microsoft Defender.csv, and the default location is the local Downloads folder. If an exported report already exists in that location, the filename is incremented (for example, Attack simulation report - Microsoft Defender (1).csv).
Tip
If the Department property in Microsoft Entra ID is populated for users, you can export the information from this report to identify departments that were most vulnerable to completed phishing simulations.
Simulation report in Attack simulation training
The simulation report shows the details of in-progress or completed simulations (the Status value is In progress or Completed). To view the simulation report, use any of the following methods:
On the Overview tab of the Attack simulation training page at https://security.microsoft.com/attacksimulator?viewid=overview, select a simulation from the Recent simulations card.
On the Simulations tab of the Attack simulation training page at https://security.microsoft.com/attacksimulator?viewid=simulations, select a simulation by clicking anywhere in the row other than the check box next to the name. For more information, see View simulation reports.
- On the Training tab of the Attack simulation training page at https://security.microsoft.com/attacksimulator?viewid=trainingcampaign, select the training campaign using either of the following methods:
- Click anywhere in the row other than the check box next to the name.
- Select the check box next to the name, and then select
 View report.
For more information, see View Training campaign reports.
The report page that opens contains Report, Users, and Details tabs that contain information about the simulation. The rest of this section describes the information available on the Report tab.
The sections on the Report tab for a simulation are described in the following subsections.
For more information about the Users and Details tabs, see the following links.
- Simulations:
-
Tip
If the Department property in Microsoft Entra ID is populated for users, you can export the information from the Users tab to identify departments that were most vulnerable to a completed phishing simulation.
-
- Training campaigns:
Reporting for QR code simulations
You can select QR code payloads to use in simulations. The QR code replaces the phishing URL as the payload that's used in the simulation email message. For more information, see QR code payloads.
Because QR codes are a different type of a phishing URL, user events around read, delete, compromise, and click events remain the same. For example, scanning the QR code opens the phishing URL, so the event is tracked as a click event. The existing mechanisms for tracking compromise, deletes, and report events remain the same.
If you export a simulation report to a CSV file, the EmailLinkClicked_ClickSource column is available with the following values:
PhishingURL: The user clicked on the phishing link in the simulation email message.QRCode: The user scanned the QR code in the simulation email message.
Other metrics like reads, compromises, deletes, and reported messages continue to be tracked without any other updates. For more information, the Appendix section later in this article.
Simulation report for simulations
This section describes the information in the simulation report for regular simulations (not Training campaigns).

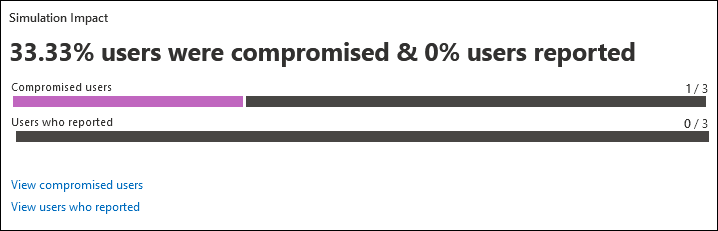
Simulation impact section in the report for simulations
The Simulation impact section on Report tab** for a simulation shows the number and percentage of Compromised users and Users who reported the message.
Tip
Simulation messages reported by non-Microsoft tools aren't captured in attack simulation reports.
If you hover over a section in the chart, the actual numbers for each category are shown.
Select View compromised users to go to the Users tab tab in the report where the results are filtered by Compromised: Yes.
Select View users who reported to go to the Users tab tab in the report where the results are filtered by Reported message: Yes.
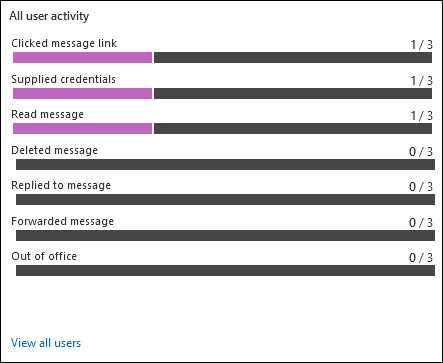
All user activity section in the report for simulations
The All user activity section on Report tab** for a simulation shows numbers for the possible outcomes of the simulation. The information varies based on the simulation type. For example:
- Clicked message link or Attachment link clicked or Attachment opened
- Supplied credentials
- Read message
- Deleted message
- Replied to message
- Forwarded message
- Out of office
Select View all users to go to the Users tab tab in the report where the results are unfiltered.
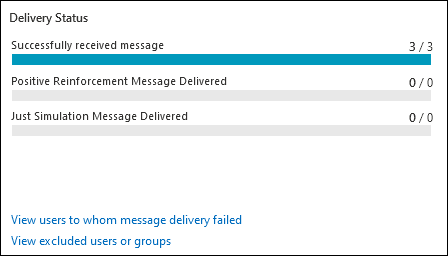
Delivery status section in the report for simulations
The Delivery status section on Report tab** for a simulation shows the numbers for the possible delivery statuses for the simulation message. For example:
- Successfully received message
- Positive reinforcement message delivered
- Just simulation message delivered
Select View users to whom message delivery failed to go to the Users tab tab in the report where the results are filtered by Simulation message delivery: Failed to deliver.
Select View excluded users or groups to open an Excluded users or groups flyout that shows the users or groups that were excluded from the simulation.
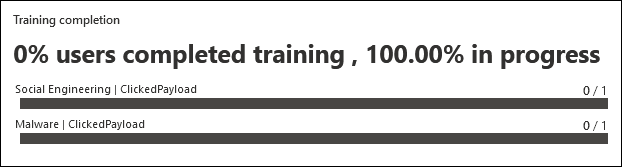
Training completion section in the report for simulations
The Training completion section on the simulation details page shows the trainings that are required for the simulation, and how many users completed the trainings.
If no trainings were included in the simulation, the only value in this section is Trainings were not part of this simulation.
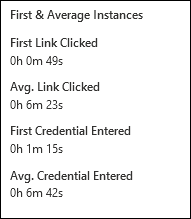
First & average instance section in the report for simulations
The First & average instance section on Report tab** for a simulation shows information about the time it took to do specific actions in the simulation. For example:
- First link clicked
- Avg. link clicked
- First credential entered
- Avg. credential entered
Recommendations section in the report for simulations
The Recommendations section on Report tab** for a simulation shows recommendations for using Attack simulation training to help secure your organization.

Simulation report for Training campaigns
This section describes the information in the simulation report for Training campaigns (not simulations).

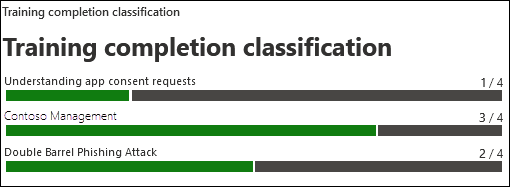
Training completion classification section in the report for Training campaigns
The Training completion classification section on Report tab** for a Training campaign shows information about the completed Training modules in the Training campaign.
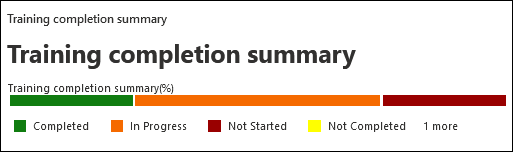
Training completion summary section in the report for Training campaigns
The Training completion summary section on Report tab** for a Training campaign uses bar graphs show the progression of assigned users through all Training modules in the campaign (number of users / total number of users):
- Completed
- In progress
- Not started
- Not completed
- Previously assigned
You can hover over a section in the chart to see the actual percentage in each category.
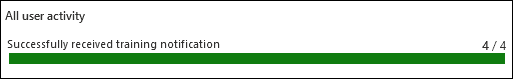
All user activity section in the report for Training campaigns
The All user activity section on Report tab** for a Training campaign uses a bar graph to shows how main people Successfully received training notification (number of users / total number of users).
You can hover over a section in the chart to see the actual numbers in each category.
Appendix
When you export information from the reports, the CSV file contains more information than what's shown in the report, even if you have all column shown. The fields are described in the following table.
Tip
For maximum information, verify that all available columns in the report are visible before you export.
Simulation messages reported by non-Microsoft tools aren't captured in attack simulation reports.
| Field Name | Description |
|---|---|
| UserName | Username of the user who did the activity. |
| UserMail | Email address of the user who did the activity. |
| Compromised | Indicates if the user was compromised. Values are Yes or No. |
| AttachmentOpened_TimeStamp | When the attachment payload was opened in Malware Attachment simulations. |
| AttachmentOpened_Browser | When the attachment payload was opened in a web browser in Malware Attachment simulations. This information comes from UserAgent. |
| AttachmentOpened_IP | The IP address where the attachment payload was opened in Malware Attachment simulations. This information comes from UserAgent. |
| AttachmentOpened_Device | The device where the attachment payload was opened in Malware Attachment simulations. This information comes from UserAgent. |
| AttachmentLinkClicked_TimeStamp | When the attachment link payload was clicked in Link in Attachment simulations. |
| AttachmentLinkClicked_Browser | The web browser that was used to click the attachment link payload in Link in Attachment simulations. This information comes from UserAgent. |
| AttachmentLinkClicked_IP | The IP address where the attachment link payload was clicked in Link in Attachment simulations. This information comes from UserAgent. |
| AttachmentLinkClicked_Device | The device where the attachment link payload was clicked in Link in Attachment simulations. This information comes from UserAgent. |
| EmailLinkClicked_TimeStamp | When the link payload was clicked in Credential Harvest, Link to Malware, Drive-by-url, and OAuth Consent Grant simulations. |
| EmailLinkClicked_Browser | The web browser that was used to click the link payload in Credential Harvest, Link to Malware, Drive-by-url, and OAuth Consent Grant simulations. This information comes from UserAgent. |
| EmailLinkClicked_IP | The IP address where the link payload was clicked in Credential Harvest, Link to Malware, Drive-by-url, and OAuth Consent Grant simulations. This information comes from UserAgent. |
| EmailLinkClicked_Device | The device where the link payload was clicked in Credential Harvest, Link to Malware, Drive-by-url, and OAuth Consent Grant simulations. This information comes from UserAgent. |
| EmailLinkClicked_ClickSource | Whether the payload link was selected by clicking on a URL or scanning a QR Code in Credential Harvest, Link to Malware, Drive-by-url, and OAuth Consent Grant simulations. Values are PhishingURL or QRCode. |
| CredSupplied_TimeStamp(Compromised) | When the user entered their credentials. |
| CredSupplied_Browser | The web browser that was used when the user entered their credentials. This information comes from UserAgent. |
| CredSupplied_IP | The IP address where the user entered their credentials. This information comes from UserAgent. |
| CredSupplied_Device | The device where the user entered their credentials. This information comes from UserAgent. |
| SuccessfullyDeliveredEmail_TimeStamp | When the simulation email message was delivered to the user. |
| MessageRead_TimeStamp | When the simulation message was read. |
| MessageDeleted_TimeStamp | When the simulation message was deleted. |
| MessageReplied_TimeStamp | When the user replied to the simulation message. |
| MessageForwarded_TimeStamp | When the user forwarded the simulation message. |
| OutOfOfficeDays | Determines whether the user is out of office. This information comes from the Automatic replies setting in Outlook. |
| PositiveReinforcementMessageDelivered_TimeStamp | When the positive reinforcement message was delivered to the user. |
| PositiveReinforcementMessageFailed_TimeStamp | When the positive reinforcement message failed to be delivered to the user. |
| JustSimulationMessageDelivered_TimeStamp | When the simulation message was delivered to the user as part of a simulation with no trainings assigned (No training was selected on the Assign training page of the new simulation wizard). |
| JustSimulationMessageFailed_TimeStamp | When the simulation email message failed to be delivered to the user, and the simulation had no trainings assigned. |
| TrainingAssignmentMessageDelivered_TimeStamp | When the training assignment message was delivered to the user. This value is empty if no trainings were assigned in the simulation. |
| TrainingAssignmentMessageFailed_TimeStamp | When the training assignment message failed to be delivered to the user. This value is empty if no trainings were assigned in the simulation. |
| FailedToDeliverEmail_TimeStamp | When the simulation email message failed to be delivered to the user. |
| Last Simulation Activity | The last simulation activity of the user (whether they passed or were compromised). |
| Assigned Trainings | The list of trainings assigned to the user as part of the simulation. |
| Completed Trainings | The list of trainings completed by the user as part of the simulation. |
| Training Status | The current status of trainings for the user as part of the simulation. |
| Phishing Reported On | When the user reported the simulation message as phishing. |
| Department | The user's Department property value in Microsoft Entra ID at the time of simulation. |
| Company | The user's Company property value in Microsoft Entra ID at the time of simulation. |
| Title | The user's Title property value in Microsoft Entra ID at the time of simulation. |
| Office | The user's Office property value in Microsoft Entra ID at the time of simulation. |
| City | The user's City property value in Microsoft Entra ID at the time of simulation. |
| Country | The user's Country property value in Microsoft Entra ID at the time of simulation. |
| Manager | The user's Manager property value in Microsoft Entra ID at the time of simulation. |
User Activity Signals
How user activity signals are captured is described in the following table.
| Field | Description | Calculation logic |
|---|---|---|
| DownloadAttachment | A user downloaded the attachment. | The signal comes from the client (for example, Outlook or Word). |
| Opened Attachment | A user opened the attachment. | The signal comes from the client (for example, Outlook or Word). |
| Read Message | The user read the simulation message. | Message read signals might experience issues in the following scenarios:
|
| Out of Office | Determines whether the user is out of office. | Currently calculated by the Automatic replies setting from Outlook. |
| Compromised User | The user was compromised. The compromise signal varies based on the social engineering technique. |
|
| Clicked Message Link | The user clicked on the payload link in the simulation message. For the Drive-by URL technique, a click event also leads to compromise. | The URL in the simulation is unique for each user, which allows individual user activity tracking. Non-Microsoft filtering services or email forwarding can lead to false positives. For more information, see I see clicks or compromise events from users who insist they didn't click the link in the simulation message OR I see clicks within a few seconds of delivery for many users (false positives). What's going on? |
| Forwarded Message | The user forwarded the message. | |
| Replied to Message | The user replied to the message. | |
| Deleted message | The user deleted the message. | The signal comes from the Outlook activity of the user. If the user reports the message as phishing, the message might be moved to the Deleted Items folder, which is identified as a deletion. |
| Permissions granted | The user shared permissions in an OAuth Consent Grant simulation. This action is also considered a compromised event. |
¹ The clicked link can be a selected URL or a scanned QR code.
Training assignment trigger behavior by technique
When you choose Select training courses and modules myself for training assignments in simulations and simulation automations, you can use the following triggers to assign training:
- All users
- Clicked payload
- Compromised
But not all training assignment triggers apply to every social engineering technique. The following table summarizes the available and recommended training assignment triggers by technique:
| Technique | Training assignemnt: All users |
Training assignemnt: Clicked payload |
Training assignemnt: Compromised |
Recommendation |
|---|---|---|---|---|
| Credential Harvest | Supported | Supported | Supported | Use any training assignment trigger based on your training strategy. |
| Malware Attachment | Supported | Not applicable (no click event) | Supported | Assign training for All users or Compromised. Don't assign training for Clicked payload. |
| Link in Attachment | Supported | Supported | Supported | Use any training assignment trigger based on your training strategy. |
| Link to Malware | Supported | Supported | Supported | Use any trigger training assignment based on your training strategy. |
| Drive-by URL | Supported | Not recommended (click = compromise) | Supported | Assign training for All users or Compromised. |
| OAuth Consent Grant | Supported | Supported | Supported | Use any training assignment trigger based on your training strategy. |
Related Links
Get started using Attack simulation training