Note
Access to this page requires authorization. You can try signing in or changing directories.
Access to this page requires authorization. You can try changing directories.
Starting with .NET 5, the runtime can emit events through EventPipe with detailed information about managed assembly loading to aid in diagnosing assembly loading issues. These events are emitted by the Microsoft-Windows-DotNETRuntime provider under the AssemblyLoader keyword (0x4).
Prerequisites
- .NET 5 SDK or later versions
dotnet-tracetool
Note
The scope of dotnet-trace capabilities is greater than collecting detailed assembly loading information. For more information on the usage of dotnet-trace, see dotnet-trace.
Collect a trace with assembly loading events
You can use dotnet-trace to trace an existing process or to launch a child process and trace it from startup.
Trace an existing process
To enable assembly loading events in the runtime and collect a trace of them, use dotnet-trace with the following command:
dotnet-trace collect --providers Microsoft-Windows-DotNETRuntime:4 --process-id <pid>
This command collects a trace of the specified <pid>, enabling the AssemblyLoader events in the Microsoft-Windows-DotNETRuntime provider. The result is a .nettrace file.
Use dotnet-trace to launch a child process and trace it from startup
Sometimes it may be useful to collect a trace of a process from its startup. For apps running .NET 5 or later, you can use dotnet-trace to do this.
The following command launches hello.exe with arg1 and arg2 as its command line arguments and collects a trace from its runtime startup:
dotnet-trace collect --providers Microsoft-Windows-DotNETRuntime:4 -- hello.exe arg1 arg2
You can stop collecting the trace by pressing Enter or Ctrl + C. This also closes hello.exe.
Note
- Launching hello.exe via
dotnet-traceredirects its input and output, and you won't be able to interact with it on the console by default. Use the--show-child-ioswitch to interact with itsstdinandstdout. - Exiting the tool via Ctrl+C or
SIGTERMsafely ends both the tool and the child process. - If the child process exits before the tool, the tool exits as well and the trace should be safely viewable.
View a trace
The collected trace file can be viewed on Windows using the Events view in PerfView. All the assembly loading events will be prefixed with Microsoft-Windows-DotNETRuntime/AssemblyLoader.
Example (on Windows)
This example uses the assembly loading extension points sample. The application attempts to load an assembly MyLibrary - an assembly that is not referenced by the application and thus requires handling in an assembly loading extension point to be successfully loaded.
Collect the trace
Navigate to the directory with the downloaded sample. Build the application with:
dotnet buildLaunch the application with arguments indicating that it should pause, waiting for a key press. On resuming, it will attempt to load the assembly in the default
AssemblyLoadContext- without the handling necessary for a successful load. Navigate to the output directory and run:AssemblyLoading.exe /d defaultFind the application's process ID.
dotnet-trace psThe output will list the available processes. For example:
35832 AssemblyLoading C:\src\AssemblyLoading\bin\Debug\net5.0\AssemblyLoading.exeAttach
dotnet-traceto the running application.dotnet-trace collect --providers Microsoft-Windows-DotNETRuntime:4 --process-id 35832In the window running the application, press any key to let the program continue. Tracing will automatically stop once the application exits.
View the trace
Open the collected trace in PerfView and open the Events view. Filter the events list to Microsoft-Windows-DotNETRuntime/AssemblyLoader events.
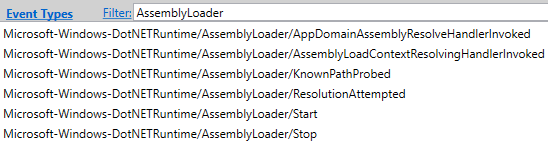
All assembly loads that occurred in the application after tracing started will be shown. To inspect the load operation for the assembly of interest for this example - MyLibrary, we can do some more filtering.
Assembly loads
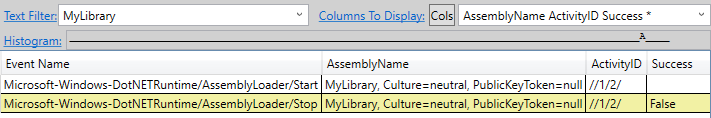
Filter the view to the Start and Stop events under Microsoft-Windows-DotNETRuntime/AssemblyLoader using the event list on the left. Add the columns AssemblyName, ActivityID, and Success to the view. Filter to events containing MyLibrary.
| Event Name | AssemblyName | ActivityID | Success |
|---|---|---|---|
AssemblyLoader/Start |
MyLibrary, Culture=neutral, PublicKeyToken=null |
//1/2/ | |
AssemblyLoader/Stop |
MyLibrary, Culture=neutral, PublicKeyToken=null |
//1/2/ | False |
You should see one Start/Stop pair with Success=False on the Stop event, indicating the load operation failed. Note that the two events have the same activity ID. The activity ID can be used to filter all the other assembly loader events to just the ones corresponding to this load operation.
Breakdown of attempt to load
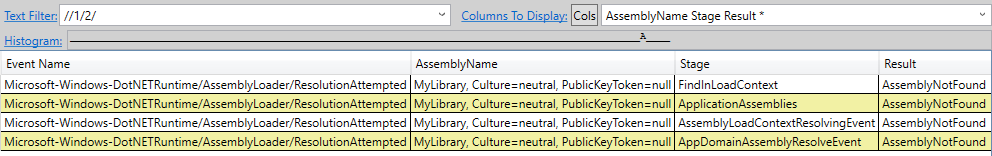
For a more detailed breakdown of the load operation, filter the view to the ResolutionAttempted events under Microsoft-Windows-DotNETRuntime/AssemblyLoader using the event list on the left. Add the columns AssemblyName, Stage, and Result to the view. Filter to events with the activity ID from the Start/Stop pair.
| Event Name | AssemblyName | Stage | Result |
|---|---|---|---|
AssemblyLoader/ResolutionAttempted |
MyLibrary, Culture=neutral, PublicKeyToken=null |
FindInLoadContext |
AssemblyNotFound |
AssemblyLoader/ResolutionAttempted |
MyLibrary, Culture=neutral, PublicKeyToken=null |
ApplicationAssemblies |
AssemblyNotFound |
AssemblyLoader/ResolutionAttempted |
MyLibrary, Culture=neutral, PublicKeyToken=null |
AssemblyLoadContextResolvingEvent |
AssemblyNotFound |
AssemblyLoader/ResolutionAttempted |
MyLibrary, Culture=neutral, PublicKeyToken=null |
AppDomainAssemblyResolveEvent |
AssemblyNotFound |
The events above indicate that the assembly loader attempted to resolve the assembly by looking in the current load context, running the default probing logic for managed application assemblies, invoking handlers for the AssemblyLoadContext.Resolving event, and invoking handlers for the AppDomain.AssemblyResolve. For all of these steps, the assembly was not found.
Extension points
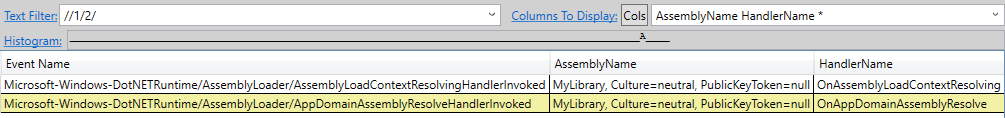
To see which extension points were invoked, filter the view to the AssemblyLoadContextResolvingHandlerInvoked and AppDomainAssemblyResolveHandlerInvoked under Microsoft-Windows-DotNETRuntime/AssemblyLoader using the event list on the left. Add the columns AssemblyName and HandlerName to the view. Filter to events with the activity ID from the Start/Stop pair.
| Event Name | AssemblyName | HandlerName |
|---|---|---|
AssemblyLoader/AssemblyLoadContextResolvingHandlerInvoked |
MyLibrary, Culture=neutral, PublicKeyToken=null |
OnAssemblyLoadContextResolving |
AssemblyLoader/AppDomainAssemblyResolveHandlerInvoked |
MyLibrary, Culture=neutral, PublicKeyToken=null |
OnAppDomainAssemblyResolve |
The events above indicate that a handler named OnAssemblyLoadContextResolving was invoked for the AssemblyLoadContext.Resolving event and a handler named OnAppDomainAssemblyResolve was invoked for the AppDomain.AssemblyResolve event.
Collect another trace
Run the application with arguments such that its handler for the AssemblyLoadContext.Resolving event will load the MyLibrary assembly.
AssemblyLoading /d default alc-resolving
Collect and open another .nettrace file using the steps from above.
Filter to the Start and Stop events for MyLibrary again. You should see a Start/Stop pair with another Start/Stop between them. The inner load operation represents the load triggered by the handler for AssemblyLoadContext.Resolving when it called AssemblyLoadContext.LoadFromAssemblyPath. This time, you should see Success=True on the Stop event, indicating the load operation succeeded. The ResultAssemblyPath field shows the path of the resulting assembly.
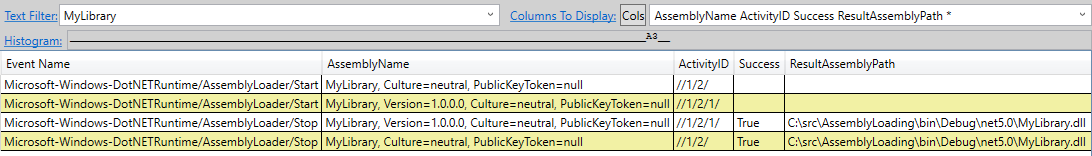
| Event Name | AssemblyName | ActivityID | Success | ResultAssemblyPath |
|---|---|---|---|---|
AssemblyLoader/Start |
MyLibrary, Culture=neutral, PublicKeyToken=null |
//1/2/ | ||
AssemblyLoader/Start |
MyLibrary, Version=1.0.0.0, Culture=neutral, PublicKeyToken=null |
//1/2/1/ | ||
AssemblyLoader/Stop |
MyLibrary, Version=1.0.0.0, Culture=neutral, PublicKeyToken=null |
//1/2/1/ | True | C:\src\AssemblyLoading\bin\Debug\net5.0\MyLibrary.dll |
AssemblyLoader/Stop |
MyLibrary, Culture=neutral, PublicKeyToken=null |
//1/2/ | True | C:\src\AssemblyLoading\bin\Debug\net5.0\MyLibrary.dll |
We can then look at the ResolutionAttempted events with the activity ID from the outer load to determine the step at which the assembly was successfully resolved. This time, the events will show that the AssemblyLoadContextResolvingEvent stage was successful. The ResultAssemblyPath field shows the path of the resulting assembly.
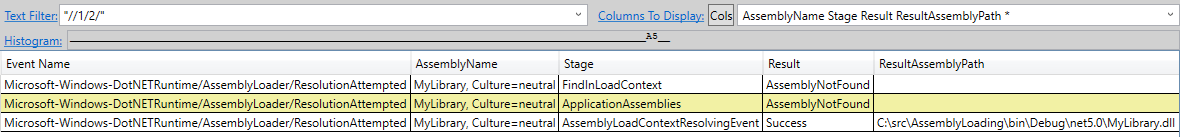
| Event Name | AssemblyName | Stage | Result | ResultAssemblyPath |
|---|---|---|---|---|
AssemblyLoader/ResolutionAttempted |
MyLibrary, Culture=neutral, PublicKeyToken=null |
FindInLoadContext |
AssemblyNotFound |
|
AssemblyLoader/ResolutionAttempted |
MyLibrary, Culture=neutral, PublicKeyToken=null |
ApplicationAssemblies |
AssemblyNotFound |
|
AssemblyLoader/ResolutionAttempted |
MyLibrary, Culture=neutral, PublicKeyToken=null |
AssemblyLoadContextResolvingEvent |
Success |
C:\src\AssemblyLoading\bin\Debug\net5.0\MyLibrary.dll |
Looking at AssemblyLoadContextResolvingHandlerInvoked events will show that the handler named OnAssemblyLoadContextResolving was invoked. The ResultAssemblyPath field shows the path of the assembly returned by the handler.

| Event Name | AssemblyName | HandlerName | ResultAssemblyPath |
|---|---|---|---|
AssemblyLoader/AssemblyLoadContextResolvingHandlerInvoked |
MyLibrary, Culture=neutral, PublicKeyToken=null |
OnAssemblyLoadContextResolving |
C:\src\AssemblyLoading\bin\Debug\net5.0\MyLibrary.dll |
Note that there is no longer a ResolutionAttempted event with the AppDomainAssemblyResolveEvent stage or any AppDomainAssemblyResolveHandlerInvoked events, as the assembly was successfully loaded before reaching the step of the loading algorithm that raises the AppDomain.AssemblyResolve event.
See also
Collaborate with us on GitHub
The source for this content can be found on GitHub, where you can also create and review issues and pull requests. For more information, see our contributor guide.