Note
Access to this page requires authorization. You can try signing in or changing directories.
Access to this page requires authorization. You can try changing directories.
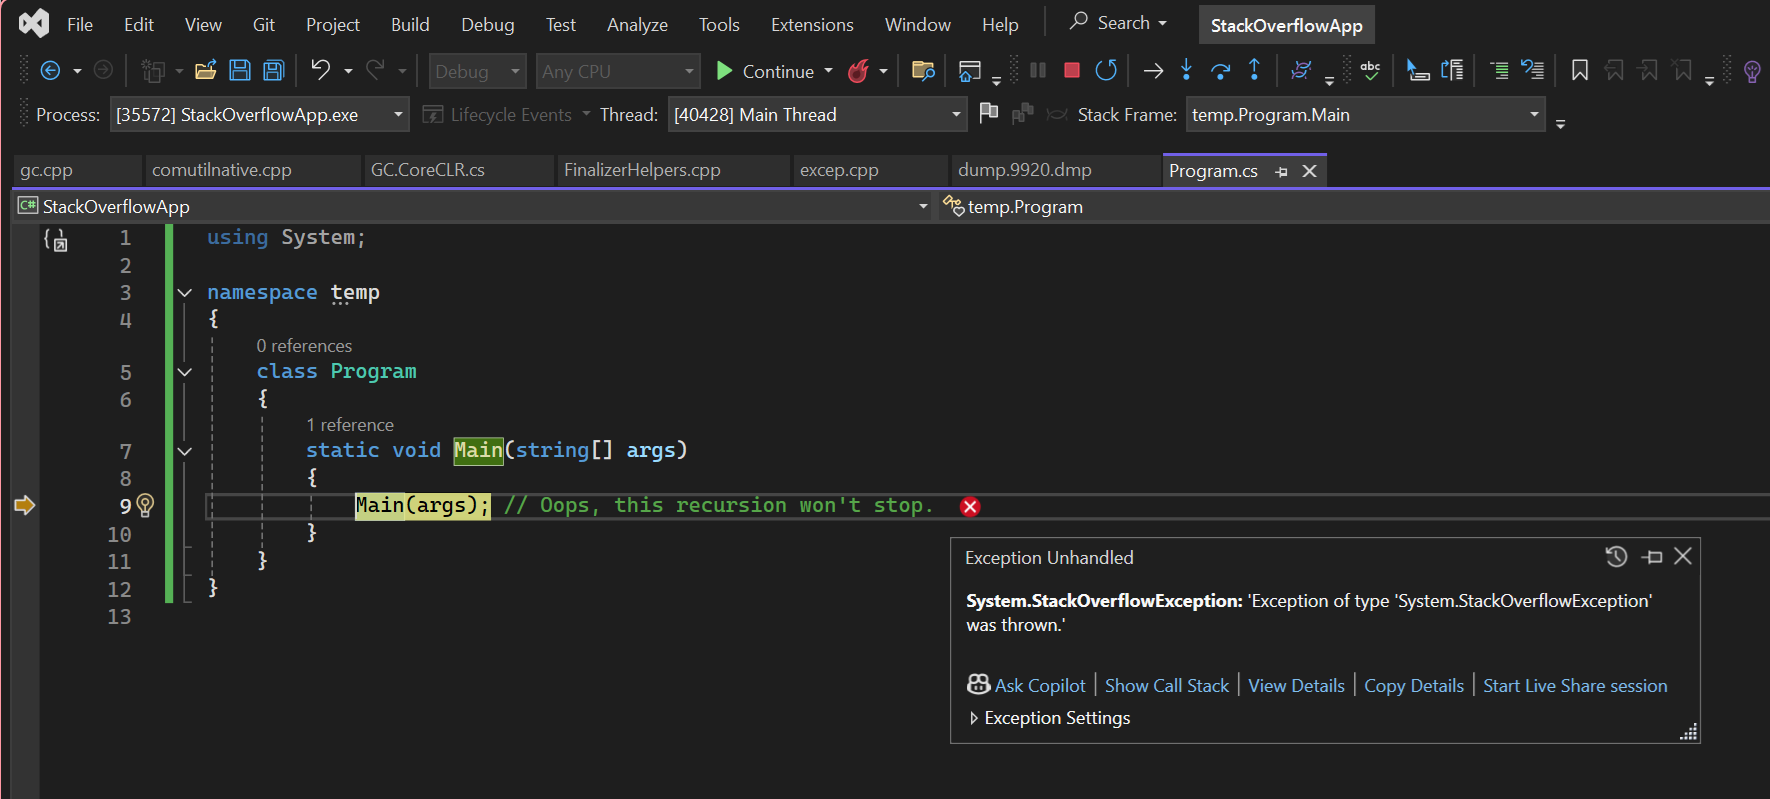
A StackOverflowException is thrown when the execution stack overflows because it contains too many nested method calls. Very often this occurs because methods are calling each other recursively.
For example, suppose you have an app as follows:
using System;

namespace temp
{
    class Program
    {
        static void Main(string[] args)
        {
            Main(args); // Oops, this recursion won't stop.
        }
    }
}
The Main method will continuously call itself until there is no more stack space. Once there is no more stack space, execution cannot continue and so it will throw a StackOverflowException.
> dotnet run
Stack overflow.
   at temp.Program.Main(System.String[])
   at temp.Program.Main(System.String[])
   at temp.Program.Main(System.String[])
   at temp.Program.Main(System.String[])
   at temp.Program.Main(System.String[])
   at temp.Program.Main(System.String[])
   <this output repeats many more times>
When you see the program exit with output like this, you can find the source code for the repeating method(s) and investigate the logic that causes the large number of calls.
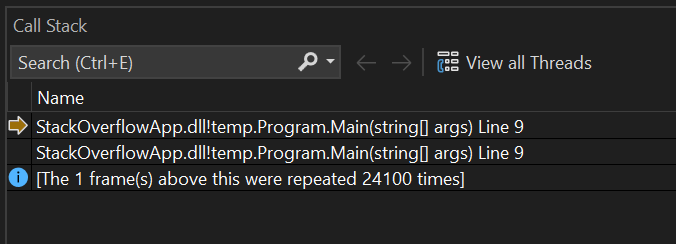
Using the debugger
Often just seeing this callstack on the console above is enough to identify the problematic code. However if the problem is still unclear you can debug further.
This example creates a core dump when the StackOverflowException occurs, then loads the dump into lldb (a common Linux command-line debugger) and debugs it.
Run the app with it configured to collect a dump on crash.
> export DOTNET_DbgEnableMiniDump=1
> dotnet run
Stack overflow.
Writing minidump with heap to file /tmp/coredump.6412
Written 58191872 bytes (14207 pages) to core file
Install the SOS extension using dotnet-sos.
dotnet-sos installOpen the dump in lldb and use the
bt(backtrace) command to display the stack.lldb --core /temp/coredump.6412 (lldb) bt ... frame #261930: 0x00007f59b40900cc frame #261931: 0x00007f59b40900cc frame #261932: 0x00007f59b40900cc frame #261933: 0x00007f59b40900cc frame #261934: 0x00007f59b40900cc frame #261935: 0x00007f5a2d4a080f libcoreclr.so`CallDescrWorkerInternal at unixasmmacrosamd64.inc:867 frame #261936: 0x00007f5a2d3cc4c3 libcoreclr.so`MethodDescCallSite::CallTargetWorker(unsigned long const*, unsigned long*, int) at callhelpers.cpp:70 frame #261937: 0x00007f5a2d3cc468 libcoreclr.so`MethodDescCallSite::CallTargetWorker(this=<unavailable>, pArguments=0x00007ffe8222e7b0, pReturnValue=0x0000000000000000, cbReturnValue=0) at callhelpers.cpp:604 frame #261938: 0x00007f5a2d4b6182 libcoreclr.so`RunMain(MethodDesc*, short, int*, PtrArray**) [inlined] MethodDescCallSite::Call(this=<unavailable>, pArguments=<unavailable>) at callhelpers.h:468 ...The top frame
0x00007f59b40900ccis repeated several times. Use the SOSip2mdcommand to figure out what managed method is located at the0x00007f59b40900ccaddress.(lldb) ip2md 0x00007f59b40900cc MethodDesc: 00007f59b413ffa8 Method Name: temp.Program.Main(System.String[]) Class: 00007f59b4181d40 MethodTable: 00007f59b4190020 mdToken: 0000000006000001 Module: 00007f59b413dbf8 IsJitted: yes Current CodeAddr: 00007f59b40900a0 Version History: ILCodeVersion: 0000000000000000 ReJIT ID: 0 IL Addr: 0000000000000000 CodeAddr: 00007f59b40900a0 (MinOptJitted) NativeCodeVersion: 0000000000000000 Source file: /temp/Program.cs @ 9Go look at the indicated method temp.Program.Main(System.String[]) and source "/temp/Program.cs @ 9" to see if you can figure out what the code is doing wrong. If additional information is needed, you can use further debugger or SOS commands to inspect the process.
Collaborate with us on GitHub
The source for this content can be found on GitHub, where you can also create and review issues and pull requests. For more information, see our contributor guide.