Note
Access to this page requires authorization. You can try signing in or changing directories.
Access to this page requires authorization. You can try changing directories.
This article applies to: ✔️ .NET Core 3.1 and later versions ✔️ .NET Framework 4.5 and later versions
The Getting started guide showed you how to create a minimal EventSource and collect events in a trace file. This tutorial shows how different tools can configure which events are collected in a trace and then view the traces.
Example app
You'll use the following sample app that generates events for this tutorial. Compile a .NET console application containing the following code:
using System.Diagnostics.Tracing;

namespace EventSourceDemo
{
    public static class Program
    {
        public static void Main(string[] args)
        {
            DemoEventSource.Log.AppStarted("Hello World!", 12);
            DemoEventSource.Log.DebugMessage("Got here");
            DemoEventSource.Log.DebugMessage("finishing startup");
            DemoEventSource.Log.RequestStart(3);
            DemoEventSource.Log.RequestStop(3);
        }
    }

    [EventSource(Name = "Demo")]
    class DemoEventSource : EventSource
    {
        public static DemoEventSource Log { get; } = new DemoEventSource();

        [Event(1, Keywords = Keywords.Startup)]
        public void AppStarted(string message, int favoriteNumber) => WriteEvent(1, message, favoriteNumber);
        [Event(2, Keywords = Keywords.Requests)]
        public void RequestStart(int requestId) => WriteEvent(2, requestId);
        [Event(3, Keywords = Keywords.Requests)]
        public void RequestStop(int requestId) => WriteEvent(3, requestId);
        [Event(4, Keywords = Keywords.Startup, Level = EventLevel.Verbose)]
        public void DebugMessage(string message) => WriteEvent(4, message);


        public class Keywords
        {
            public const EventKeywords Startup = (EventKeywords)0x0001;
            public const EventKeywords Requests = (EventKeywords)0x0002;
        }
    }
}
Configure which events to collect
Most event collection tools use these configuration options to decide which events should be included in a trace:
- Provider names - This is a list of one or more EventSource names. Only events that are defined on EventSources in this list are eligible to be included. To collect events from the DemoEventSource class in the preceding example app, you would need to include the EventSource name "Demo" in the list of provider names.
- Event verbosity level - For each provider you can define a verbosity level and events with verbosity higher than that level will be excluded from the trace. If you specified that the "Demo" provider in the preceding example app should collect at the Informational verbosity level, then the DebugMessage event would be excluded because it has a higher level. Specifying EventLevel LogAlways(0) is a special case that indicates that events of any verbosity level should be included.
- Event keywords - For each provider you can define a set of keywords and only events tagged with at least one of the keywords will be included. In the example app above if you specified the Startup keyword then only the AppStarted and DebugMessage events would be included. If no keywords are specified this is a special case and means that events with any keyword should be included.
Conventions for describing provider configuration
Although each tool determines its own user interface for setting the trace configuration, there's a common convention
many tools use when specifying the configuration as a text string. The list of providers is specified as a semi-colon
delimited list, and each provider element in the list consists of name, keywords, and level separated by colons. For example,
"Demo:3:5" identifies the EventSource named "Demo" with the keyword bitmask 3 (the Startup bit and the Requests bit) and
EventLevel 5, which is Verbose. Many tools also let you omit the level and keywords
if no level or keyword filtering is desired. For example, "Demo::5" only does level-based filtering, "Demo:3" only does
keyword-based filtering, and "Demo" does no keyword or level filtering.
Visual Studio
The Visual Studio profiler supports both collecting and viewing traces. It also can view traces that have been collected in advance by other tools, such as dotnet-trace.
Collect a trace
Most of Visual Studio's profiling tools use predefined sets of events that serve a particular purpose, such as analyzing CPU usage or allocations. To collect a trace with customized events, you'll use the Events Viewer tool.
To open the Performance Profiler in Visual Studio, select Alt+F2.
Select the Events Viewer check box.
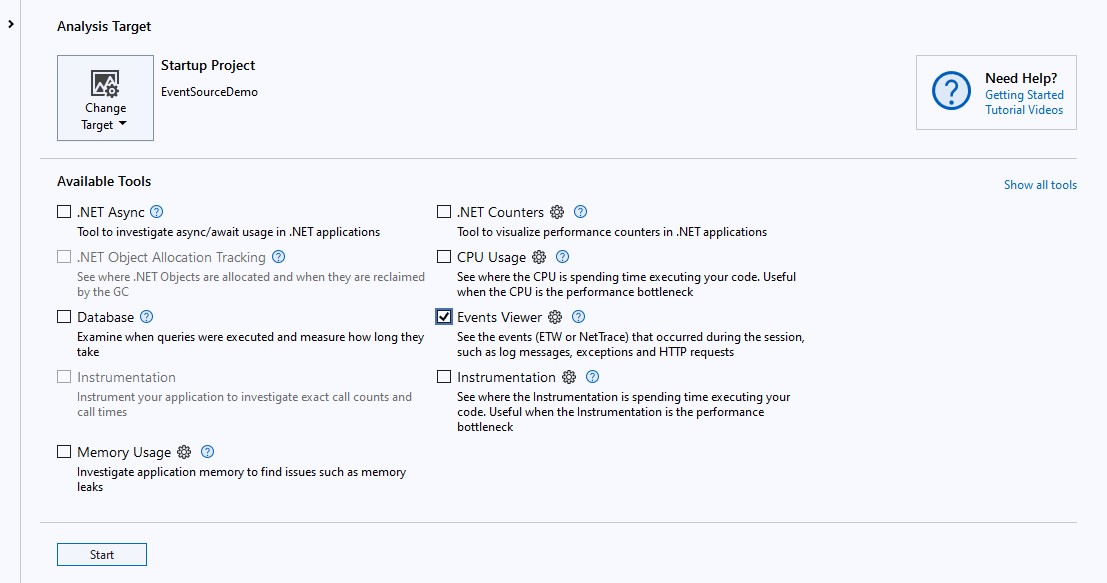
Select the small gear icon to the right of Events Viewer to open the configuration window.
In the table below Additional Providers, add a row for each provider you wish to configure by clicking the Enabled checkbox, and then entering the provider name, keywords, and level. You don't need to enter the provider GUID; it's computed automatically.
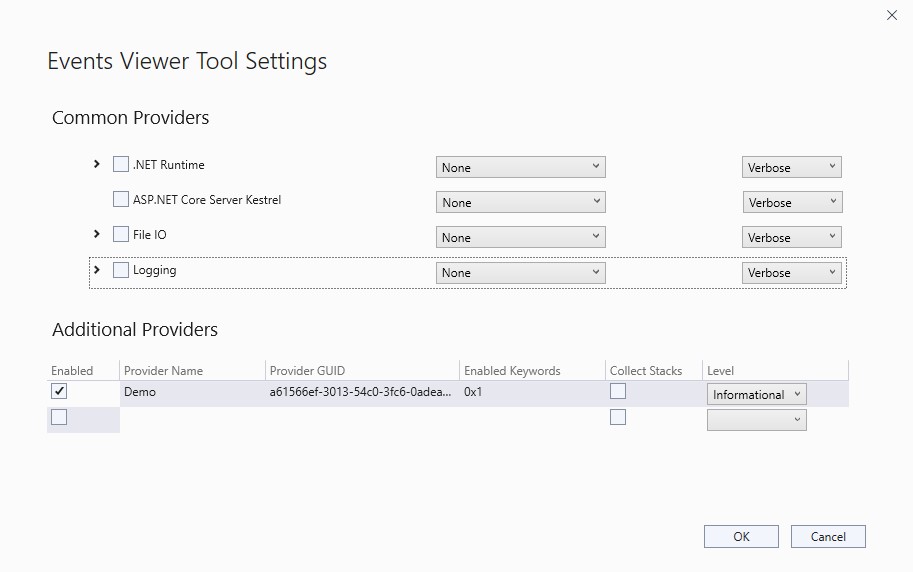
Select OK to confirm the configuration settings.
Select Start to begin running the app and collecting logs.
Select Stop Collection or exit the app to stop collecting logs and show the collected data.
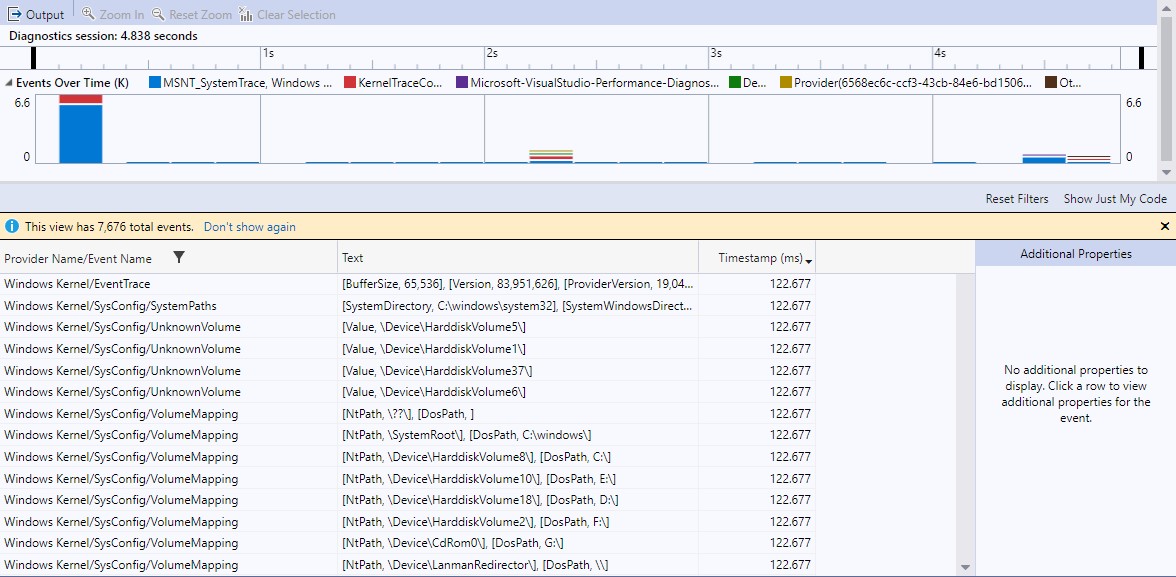
View a trace
Visual Studio can view traces it collected itself, or it can view traces collected in other tools. To view traces from other tools, use File > Open and select a trace file in the file picker. Visual Studio profiler supports .etl files (ETW's standard format), .nettrace files (EventPipe's standard format), and .diagsession files (Visual Studio's standard format). For information about working with trace files in Visual Studio, see the Visual Studio documentation.
Note
Visual Studio collects some events automatically from ETW or EventPipe, even if they weren't explicitly configured. If you see events you don't recognize in the Provider Name or Event Name column and want to filter them out, use the filter icon to the right to select only the events you want to view.
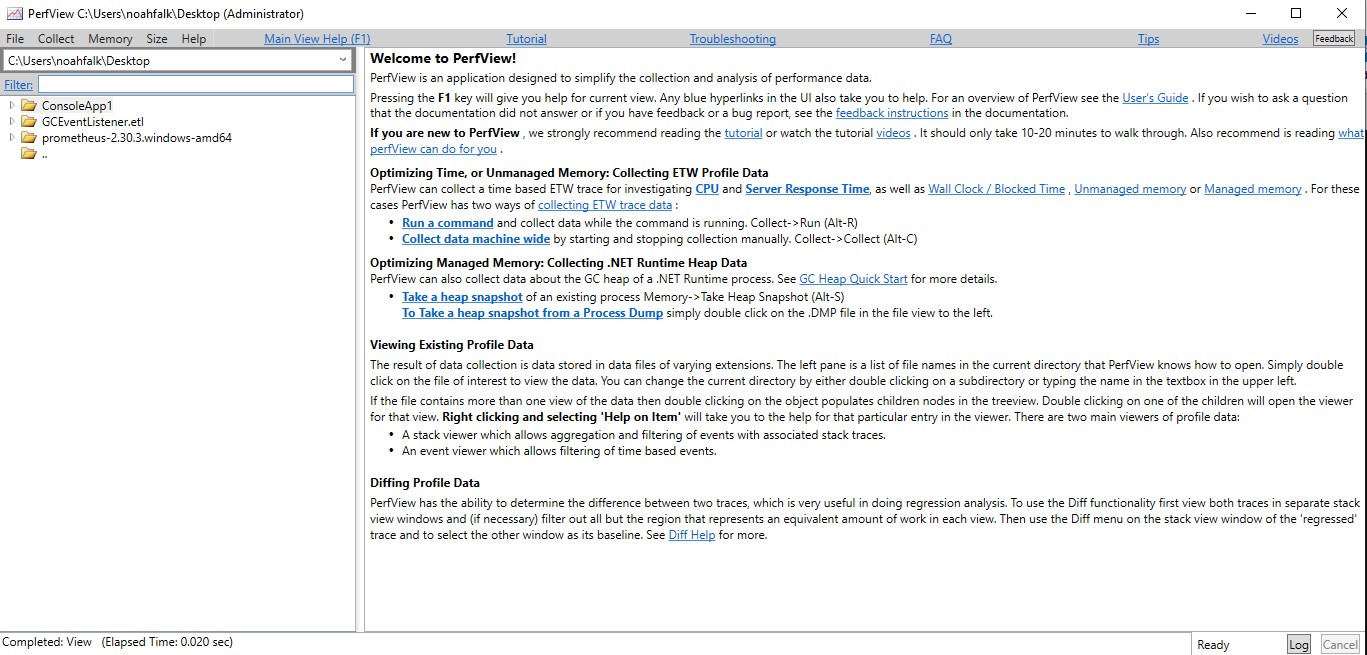
PerfView
PerfView is a performance tool created by the .NET team that can collect and view ETW traces. It can also view trace files collected by other tools in various formats. In this tutorial, you'll collect an ETW trace of the demo app and then examine the collected events in PerfView's event viewer.
Collect a trace
Download PerfView from the releases page. This tutorial was done with PerfView version 2.0.76, but any recent version should work.
Start PerfView.exe with administrator permissions.
Note
ETW trace collection always requires administrator permissions, however if you are only using PerfView to view a pre-existing trace, then no special permissions are needed.
From the Collect menu, select Run. This opens a new dialog where you'll enter the path to the demo app.
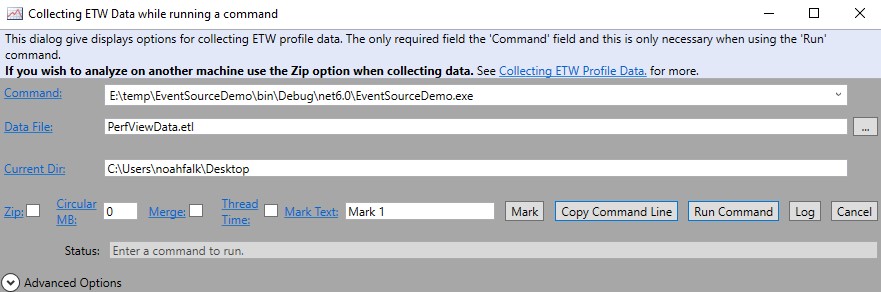
To configure which events get collected, expand Advanced Options at the bottom of the dialog. In the Additional Providers text box, enter providers using the conventional text format described previously. In this case, you're entering "Demo:1:4", which means keyword bit 1 (
Startupevents) and verbosity 4 (Informational).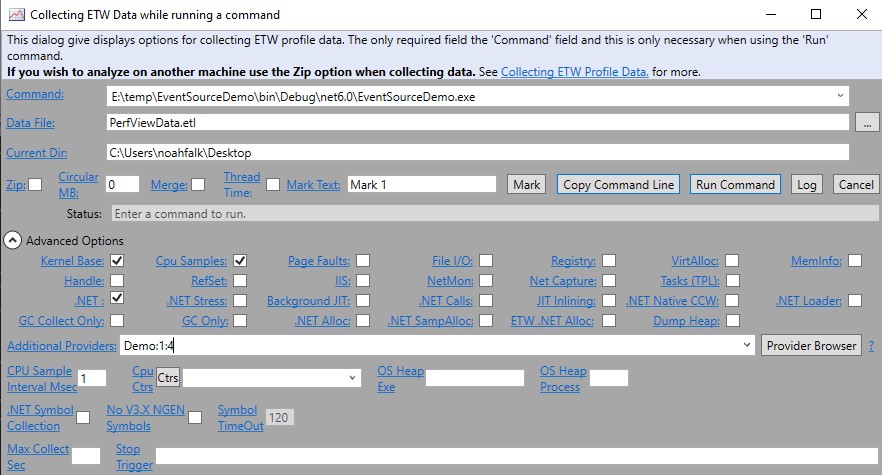
To launch the app and begin collecting the trace, select the Run Command button. When the app exits, the trace PerfViewData.etl is saved in the current directory.
View a trace
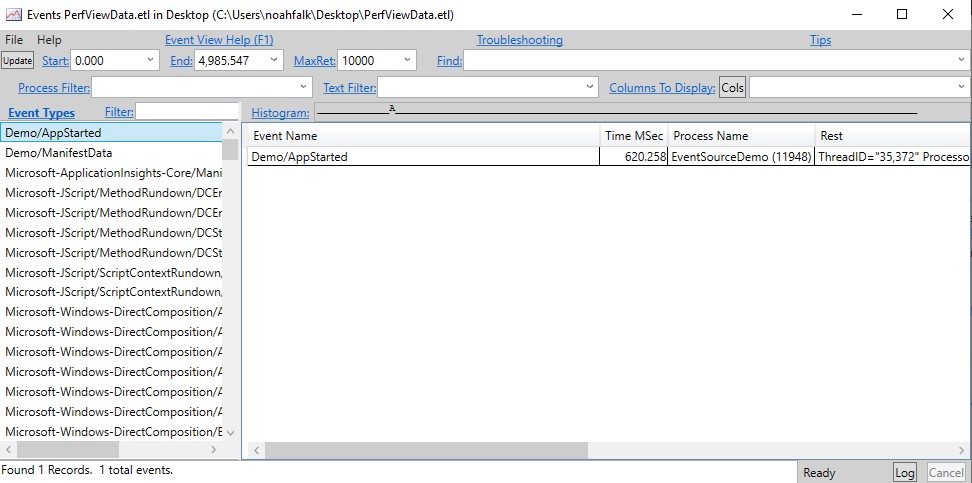
In the main window drop-down text box at the upper left, select the directory containing the trace file. Then double click the trace file in the tree view below.
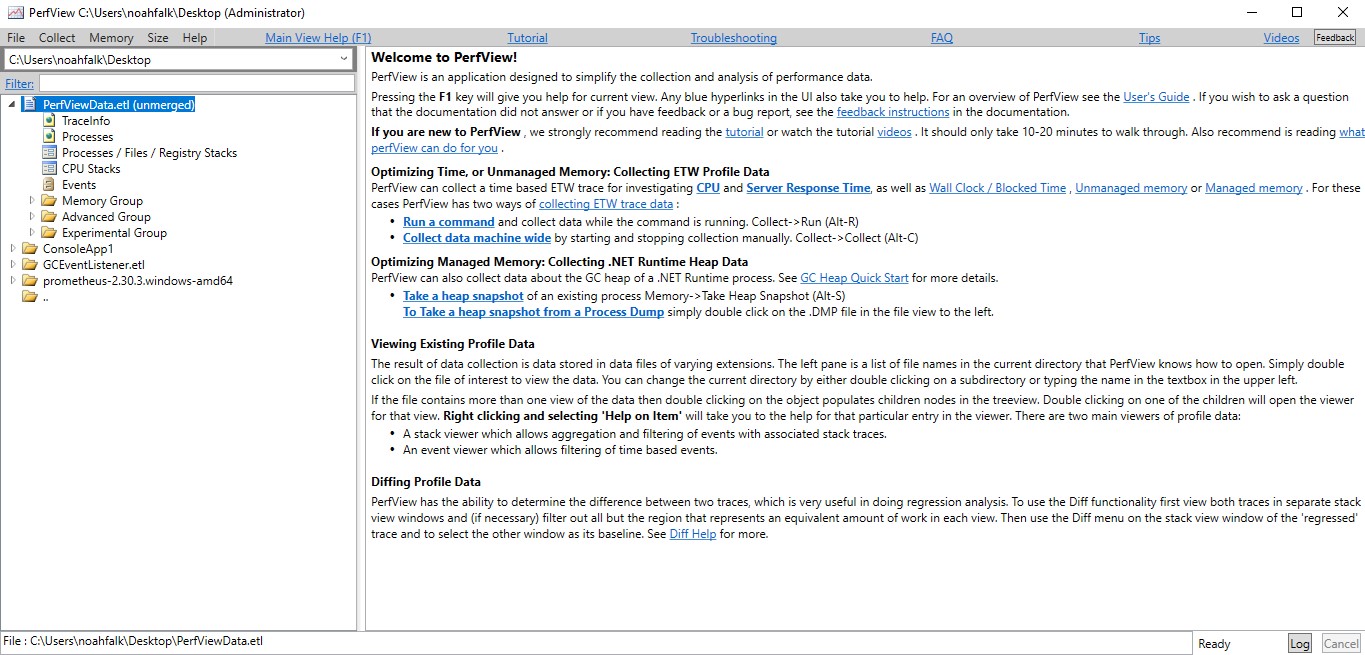
To bring up the Events viewer, double click the Events item that appears in the tree view below the trace file.
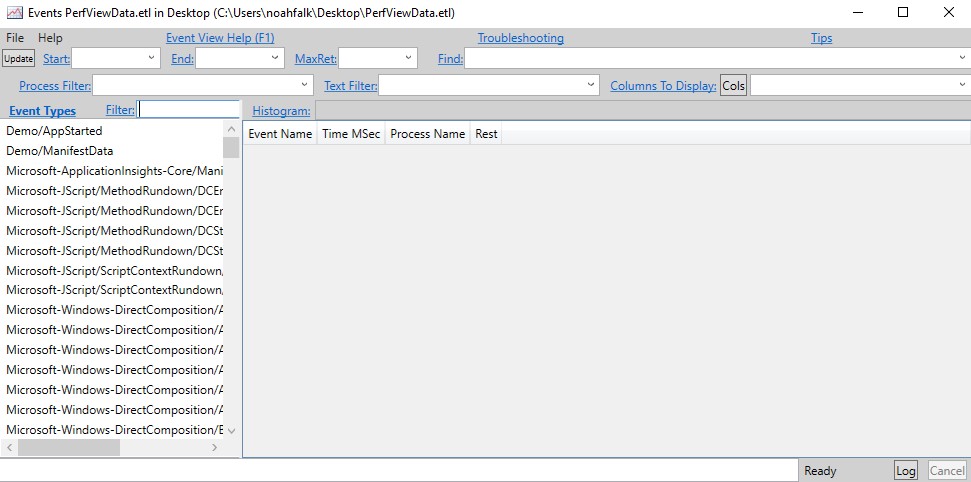
All event types in the trace are shown in the list at the left. Double click an event type, such as Demo\AppStarted, to show all events of that type in the table on the right.
Learn more
To learn more about using PerfView, see the PerfView video tutorials.
dotnet-trace
dotnet-trace is a cross-platform command-line tool that can collect traces from .NET Core apps using EventPipe tracing. It doesn't support viewing trace data, but the traces it collects can be viewed by other tools such as PerfView or Visual Studio. dotnet-trace also supports converting its default .nettrace format traces into other formats, such as Chromium or Speedscope.
Collect a trace
Download and Install dotnet-trace.
At the command line, run the dotnet-trace collect command:
E:\temp\EventSourceDemo\bin\Debug\net6.0>dotnet-trace collect --providers Demo:1:4 -- EventSourceDemo.exeThis should show output similar to:
E:\temp\EventSourceDemo\bin\Debug\net6.0> dotnet-trace collect --providers Demo:1:4 -- EventSourceDemo.exe

Provider Name                           Keywords            Level               Enabled By
Demo                                    0x0000000000000001  Informational(4)    --providers

Launching: EventSourceDemo.exe
Process        : E:\temp\EventSourceDemo\bin\Debug\net6.0\EventSourceDemo.exe
Output File    : E:\temp\EventSourceDemo\bin\Debug\net6.0\EventSourceDemo.exe_20220317_021512.nettrace

[00:00:00:00]   Recording trace 0.00     (B)
Press <Enter> or <Ctrl+C> to exit...

Trace completed.
dotnet-trace uses the conventional text format for describing provider configuration in the
--providersargument. For more options on how to take traces using dotnet-trace, see the dotnet-trace docs.
EventListener
System.Diagnostics.Tracing.EventListener is an .NET API that can be used from in-process to receive callbacks for events generated by an System.Diagnostics.Tracing.EventSource. This API can be used to create custom logging tools or to analyze the events in memory without ever serializing them.
To use EventListener, declare a type that derives from EventListener, invoke EnableEvents to
subscribe to the events from any EventSource of interest, and override the OnEventWritten,
which will be called whenever a new event is available. It's often useful to override
OnEventSourceCreated to discover which EventSource objects exist, but
this isn't required. Following is an example EventListener implementation that prints to console when messages are received:
Add this code to the demo app.
class ConsoleWriterEventListener : EventListener
{
    protected override void OnEventSourceCreated(EventSource eventSource)
    {
        if(eventSource.Name == "Demo")
        {
            EnableEvents(eventSource, EventLevel.Informational);
        }
    }

    protected override void OnEventWritten(EventWrittenEventArgs eventData)
    {
        Console.WriteLine(eventData.TimeStamp + " " + eventData.EventName);
    }
}
Modify the
Mainmethod to create an instance of the new listener.public static void Main(string[] args) { ConsoleWriterEventListener listener = new ConsoleWriterEventListener(); DemoEventSource.Log.AppStarted("Hello World!", 12); DemoEventSource.Log.DebugMessage("Got here"); DemoEventSource.Log.DebugMessage("finishing startup"); DemoEventSource.Log.RequestStart(3); DemoEventSource.Log.RequestStop(3); }Build and run the app. Previously, it had no output, but now it writes the events to the console:
3/24/2022 9:23:35 AM AppStarted
3/24/2022 9:23:35 AM RequestStart
3/24/2022 9:23:35 AM RequestStop
Warning
Potential Pitfalls when implementing EventSource Callbacks via EventListener include deadlocks, infinite recursions, and uninitialized types.
EventSource instances are initialized early in the runtime, before some core features are fully initialized. As a result, acquiring locks inside an EventSource callback like OnEventWritten when the thread normally would not have done so may cause deadlocks.
To mitigate this risk, consider the following precautions:
Use Queues to Defer Work: There are a variety of APIs you might want to call in OnEventWritten() that do non-trivial work, for example File IO, Console, or Http. For most events, these APIs work fine, but if you tried to call Console.WriteLine() in an event handler during the initialization of the Console class then it would probably fail. If you don't know whether a given event handler occurs at a time when APIs are safe to call, consider adding some information about the event to an in-memory queue instead. Then, on a separate thread, process items in the queue.
Minimize Lock Duration: Ensure that any locks acquired within the callback are not held for extended periods.
Use Non-blocking APIs: Prefer using non-blocking APIs within the callback to avoid potential deadlocks.
Implement a Re-entrancy Guard: Use a re-entrancy guard to prevent infinite recursion. For example:
[ThreadStatic] private static bool t_insideCallback;

public void OnEventWritten(...)
{
    if (t_insideCallback) return; // if our callback triggered the event to occur recursively
                                  // exit now to avoid infinite recursion
    try
    {
        t_insideCallback = true;
        // do callback work
    }
    finally
    {
        t_insideCallback = false;
    }
}
Collaborate with us on GitHub
The source for this content can be found on GitHub, where you can also create and review issues and pull requests. For more information, see our contributor guide.