Note
Access to this page requires authorization. You can try signing in or changing directories.
Access to this page requires authorization. You can try changing directories.
This article applies to: ✔️ .NET 6.0 and later ✔️ .NET Framework 4.6.1 and later
Instrumented code can record numeric measurements, but the measurements usually need to be aggregated, transmitted, and stored to create useful metrics for monitoring. The process of aggregating, transmitting, and storing data is called collection. This tutorial shows several examples of collecting metrics:
- Populating metrics in Grafana with OpenTelemetry and Prometheus.
- Viewing metrics in real time with
dotnet-counters - Creating a custom collection tool using the underlying .NET MeterListener API.
For more information on custom metric instrumentation and options, see Compare metric APIs.
Prerequisites
- .NET 6.0 SDK or a later
Create an example app
Before metrics can be collected, measurements must be produced. This tutorial creates an app that has basic metric instrumentation. The .NET runtime also has various metrics built-in. For more information about creating new metrics using the System.Diagnostics.Metrics.Meter API, see the instrumentation tutorial.
dotnet new console -o metric-instr
cd metric-instr
dotnet add package System.Diagnostics.DiagnosticSource
Replace the contents of Program.cs with the following code:
using System.Diagnostics.Metrics;

class Program
{
    static Meter s_meter = new("HatCo.HatStore", "1.0.0");
    static Counter<int> s_hatsSold = s_meter.CreateCounter<int>("hats-sold");

    static void Main(string[] args)
    {
        var rand = Random.Shared;
        Console.WriteLine("Press any key to exit");
        while (!Console.KeyAvailable)
        {
            //// Simulate hat selling transactions.
            Thread.Sleep(rand.Next(100, 2500));
            s_hatsSold.Add(rand.Next(0, 1000));
        }
    }
}
The preceding code simulates selling hats at random intervals and random times.
View metrics with dotnet-counters
dotnet-counters is a command-line tool that can view live metrics for .NET Core apps on demand. It doesn't require setup, making it useful for ad-hoc investigations or verifying that metric instrumentation is working. It works with both System.Diagnostics.Metrics based APIs and EventCounters.
If the dotnet-counters tool isn't installed, run the following command:
dotnet tool update -g dotnet-counters
If your app is running a version of .NET older than .NET 9, the output UI of dotnet-counters will look slightly different than below; see dotnet-counters for details.
While the example app is running, launch dotnet-counters. The following command shows an example of dotnet-counters monitoring all metrics from the HatCo.HatStore meter. The meter name is case-sensitive. Our sample app was metric-instr.exe, substitute this with the name of your sample app.
dotnet-counters monitor -n metric-instr HatCo.HatStore
Output similar to the following is displayed:
Press p to pause, r to resume, q to quit.
    Status: Running

[HatCo.HatStore]
    hats-sold (Count / 1 sec)                          4
dotnet-counters can be run with a different set of metrics to see some of the built-in instrumentation from the .NET runtime:
dotnet-counters monitor -n metric-instr
Output similar to the following is displayed:
System.Runtime
  Press p to pause, r to resume, q to quit.
      Status: Running
  Name                                              Current Value
  [System.Runtime]
  dotnet.assembly.count ({assembly})                    11
  dotnet.gc.collections ({collection})
    gc.heap.generation
    ------------------
      gen0                                              0
      gen1                                              0
      gen2                                              0
  dotnet.gc.heap.total_allocated (By)                   1,376,024
  dotnet.gc.last_collection.heap.fragmentation.size (By)
    gc.heap.generation
    ------------------
      gen0                                              0
      gen1                                              0
      gen2                                              0
      loh                                               0
      poh                                               0
  dotnet.gc.last_collection.heap.size (By)
    gc.heap.generation
    ------------------
      gen0                                              0
      gen1                                              0
      gen2                                              0
      loh                                               0
      poh                                               0
  dotnet.gc.last_collection.memory.committed_size (By)   0
  dotnet.gc.pause.time (s)                              0
  dotnet.jit.compilation.time (s)                       0.253
  dotnet.jit.compiled_il.size (By)                      79,536
  dotnet.jit.compiled_methods ({method})                743
  dotnet.monitor.lock_contentions ({contention})        0
  dotnet.process.cpu.count ({cpu})                      22
  dotnet.process.cpu.time (s)
    cpu.mode
    --------
      system                                            0.125
      user                                              46.453
  dotnet.process.memory.working_set (By)                34,447,360
  dotnet.thread_pool.queue.length ({work_item})         0
  dotnet.thread_pool.thread.count ({thread})            0
  dotnet.thread_pool.work_item.count ({work_item})      0
  dotnet.timer.count ({timer})                          0
For more information, see dotnet-counters. To learn more about metrics in .NET, see built-in metrics.
View metrics in Grafana with OpenTelemetry and Prometheus
Overview
- Is a vendor-neutral open-source project supported by the Cloud Native Computing Foundation.
- Standardizes generating and collecting telemetry for cloud-native software.
- Works with .NET using the .NET metric APIs.
- Is endorsed by Azure Monitor and many APM vendors.
This tutorial shows one of the integrations available for OpenTelemetry metrics using the OSS Prometheus and Grafana projects. The metrics data flow:
The .NET metric APIs record measurements from the example app.
The OpenTelemetry library running in the app aggregates the measurements.
The Prometheus exporter library makes the aggregated data available via an HTTP metrics endpoint. 'Exporter' is what OpenTelemetry calls the libraries that transmit telemetry to vendor-specific backends.
A Prometheus server:
- Polls the metrics endpoint
- Reads the data
- Stores the data in a database for long-term persistence. Prometheus refers to reading and storing data as scraping an endpoint.
- Can run on a different machine
The Grafana server:
- Queries the data stored in Prometheus and displays it on a web-based monitoring dashboard.
- Can run on a different machine.
Configure the example app to use OpenTelemetry's Prometheus exporter
Add a reference to the OpenTelemetry Prometheus exporter to the example app:
dotnet add package OpenTelemetry.Exporter.Prometheus.HttpListener --prerelease
Note
This tutorial uses a pre-release build of OpenTelemetry's Prometheus support available at the time of writing.
Update Program.cs with OpenTelemetry configuration:
using OpenTelemetry;
using OpenTelemetry.Metrics;
using System.Diagnostics.Metrics;

class Program
{
    static Meter s_meter = new("HatCo.HatStore", "1.0.0");
    static Counter<int> s_hatsSold = s_meter.CreateCounter<int>(
        name: "hats-sold",
        unit: "Hats",
        description: "The number of hats sold in our store");

    static void Main(string[] args)
    {
        using MeterProvider meterProvider = Sdk.CreateMeterProviderBuilder()
                .AddMeter("HatCo.HatStore")
                .AddPrometheusHttpListener(options => options.UriPrefixes = new string[] { "http://localhost:9184/" })
                .Build();

        var rand = Random.Shared;
        Console.WriteLine("Press any key to exit");
        while (!Console.KeyAvailable)
        {
            //// Simulate hat selling transactions.
            Thread.Sleep(rand.Next(100, 2500));
            s_hatsSold.Add(rand.Next(0,1000));
        }
    }
}
In the preceding code:
AddMeter("HatCo.HatStore")configures OpenTelemetry to transmit all the metrics collected by the Meter defined in the app.AddPrometheusHttpListenerconfigures OpenTelemetry to:- Expose Prometheus' metrics endpoint on port
9184 - Use the HttpListener.
- Expose Prometheus' metrics endpoint on port
See the OpenTelemetry documentation for more information about OpenTelemetry configuration options. The OpenTelemetry documentation shows hosting options for ASP.NET apps.
Run the app and leave it running so measurements can be collected:
dotnet run
Set up and configure Prometheus
Follow the Prometheus first steps to set up a Prometheus server and confirm it is working.
Modify the prometheus.yml configuration file so that Prometheus scrapes the metrics endpoint that the example app is exposing. Add the following highlighted text in the scrape_configs section:
# my global config
global:
  scrape_interval: 15s # Set the scrape interval to every 15 seconds. Default is every 1 minute.
  evaluation_interval: 15s # Evaluate rules every 15 seconds. The default is every 1 minute.
  # scrape_timeout is set to the global default (10s).

# Alertmanager configuration
alerting:
  alertmanagers:
    - static_configs:
        - targets:
          # - alertmanager:9093

# Load rules once and periodically evaluate them according to the global 'evaluation_interval'.
rule_files:
  # - "first_rules.yml"
  # - "second_rules.yml"

# A scrape configuration containing exactly one endpoint to scrape:
# Here it's Prometheus itself.
scrape_configs:
  # The job name is added as a label `job=<job_name>` to any timeseries scraped from this config.
  - job_name: "prometheus"

    # metrics_path defaults to '/metrics'
    # scheme defaults to 'http'.

    static_configs:
      - targets: ["localhost:9090"]

  - job_name: 'OpenTelemetryTest'
    scrape_interval: 1s # poll very quickly for a more responsive demo
    static_configs:
      - targets: ['localhost:9184']
Start Prometheus
Reload the configuration or restart the Prometheus server.
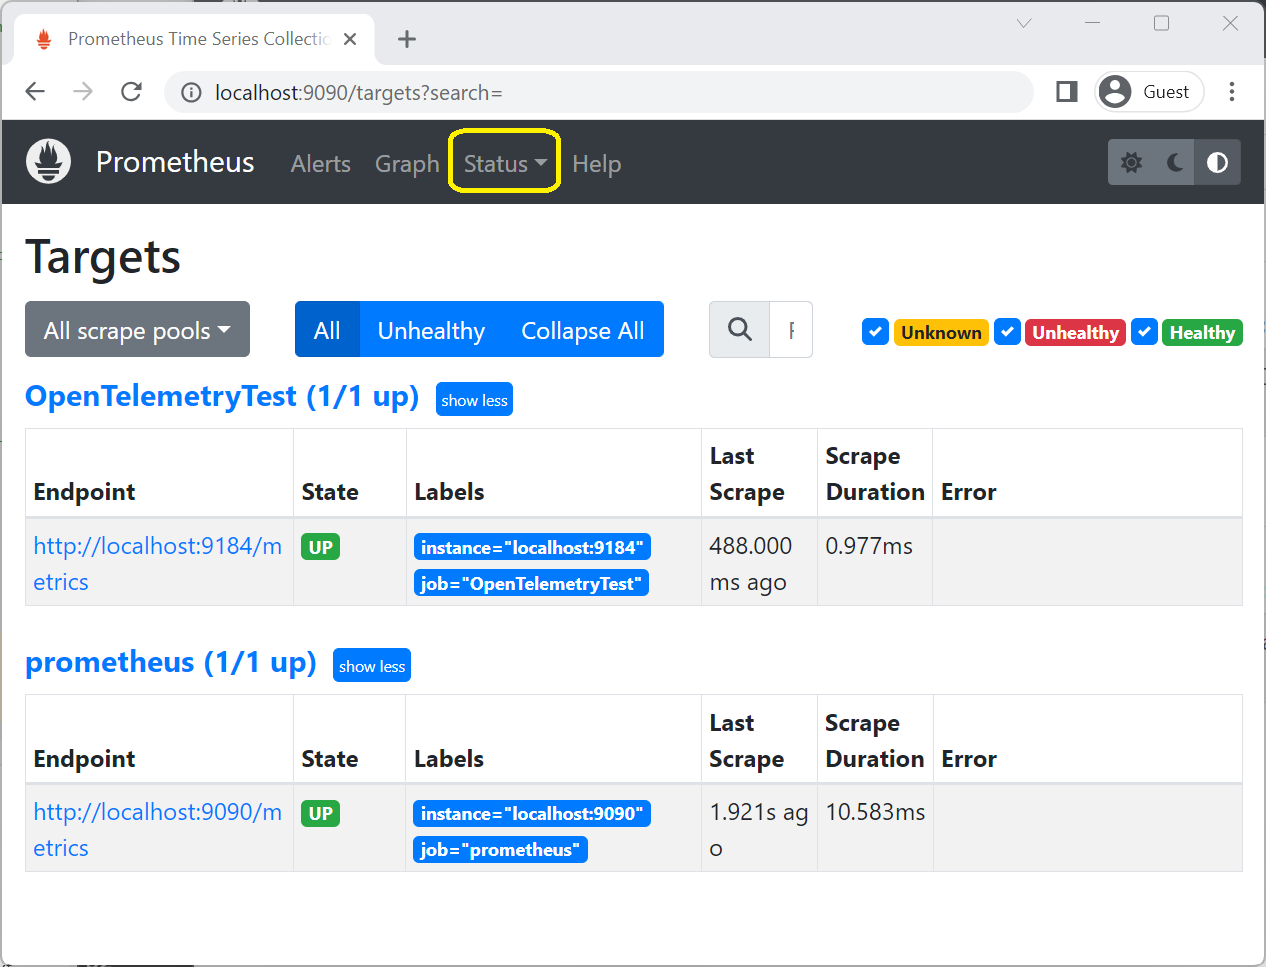
Confirm that OpenTelemetryTest is in the UP state in the Status > Targets page of the Prometheus web portal.
On the Graph page of the Prometheus web portal, enter
hatsin the expression text box and selecthats_sold_Hats In the graph tab, Prometheus shows the increasing value of the "hats-sold" Counter that is being emitted by the example app.
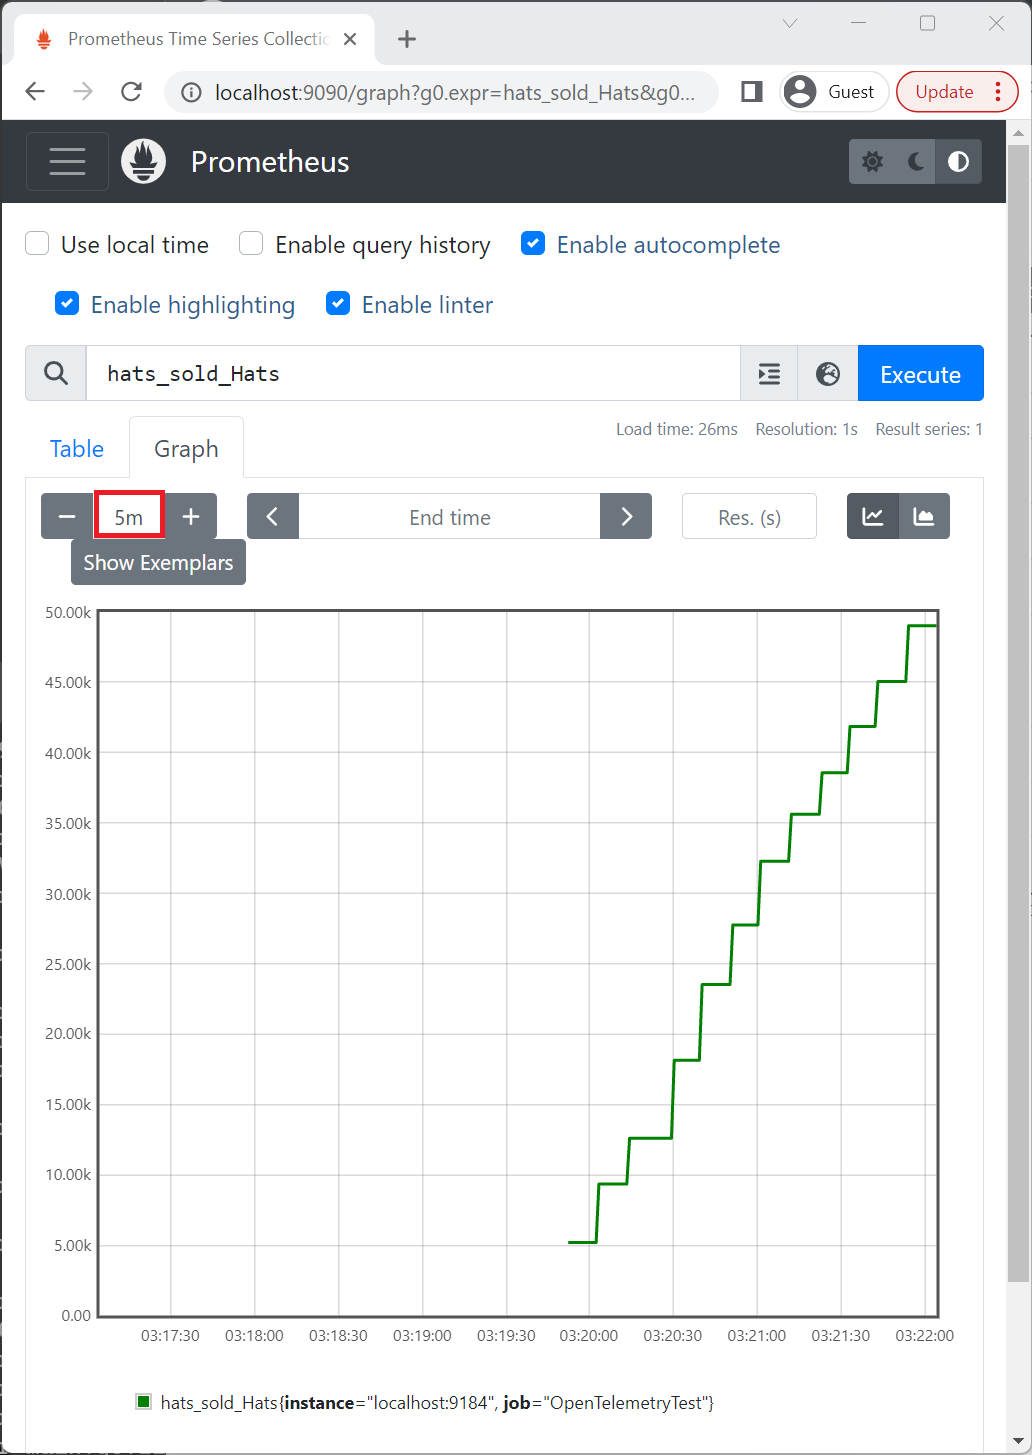
In the preceding image, the graph time is set to 5m, which is 5 minutes.
If the Prometheus server hasn't been scraping the example app for long, you may need to wait for data to accumulate.
Show metrics on a Grafana dashboard
Follow the standard instructions to install Grafana and connect it to a Prometheus data source.
Create a Grafana dashboard by clicking the + icon on the left toolbar in the Grafana web portal, then select Dashboard. In the dashboard editor that appears, enter Hats Sold/Sec in the Title input box and rate(hats_sold[5m]) in the PromQL expression field:
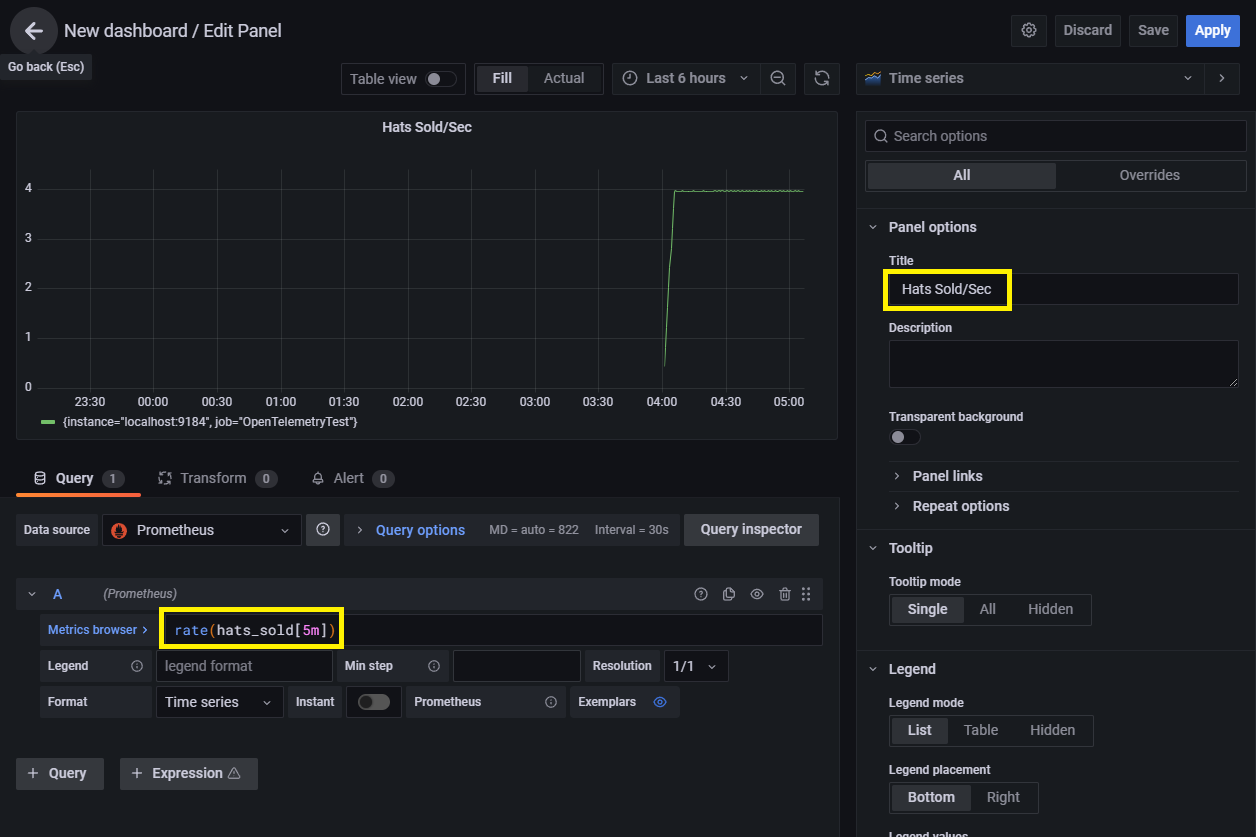
Click Apply to save and view the new dashboard.
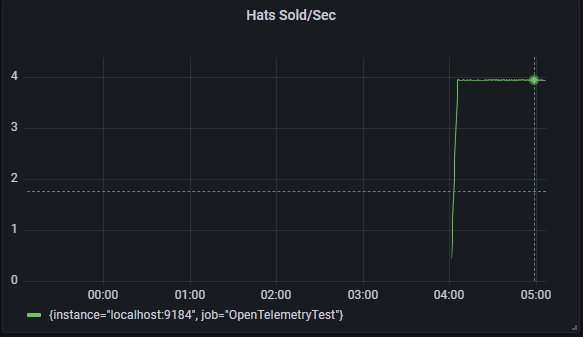 ]
]
Create a custom collection tool using the .NET MeterListener API
The .NET MeterListener API allows you to create custom in-process logic to observe the measurements being recorded by System.Diagnostics.Metrics.Meter. For guidance on creating custom logic compatible with the older EventCounters instrumentation, see EventCounters.
Modify the code of Program.cs to use MeterListener:
using System.Diagnostics.Metrics;

class Program
{
    static Meter s_meter = new("HatCo.HatStore", "1.0.0");
    static Counter<int> s_hatsSold = s_meter.CreateCounter<int>(
        name: "hats-sold",
        unit: "Hats",
        description: "The number of hats sold in our store");

    static void Main(string[] args)
    {
        using MeterListener meterListener = new();
        meterListener.InstrumentPublished = (instrument, listener) =>
        {
            if (instrument.Meter.Name is "HatCo.HatStore")
            {
                listener.EnableMeasurementEvents(instrument);
            }
        };

        meterListener.SetMeasurementEventCallback<int>(OnMeasurementRecorded);
        // Start the meterListener, enabling InstrumentPublished callbacks.
        meterListener.Start();

        var rand = Random.Shared;
        Console.WriteLine("Press any key to exit");
        while (!Console.KeyAvailable)
        {
            //// Simulate hat selling transactions.
            Thread.Sleep(rand.Next(100, 2500));
            s_hatsSold.Add(rand.Next(0, 1000));
        }
    }

    static void OnMeasurementRecorded<T>(
        Instrument instrument,
        T measurement,
        ReadOnlySpan<KeyValuePair<string, object?>> tags,
        object? state)
    {
        Console.WriteLine($"{instrument.Name} recorded measurement {measurement}");
    }
}
The following output shows the output of the app with custom callback on each measurement:
> dotnet run
Press any key to exit
hats-sold recorded measurement 978
hats-sold recorded measurement 775
hats-sold recorded measurement 666
hats-sold recorded measurement 66
hats-sold recorded measurement 914
hats-sold recorded measurement 912
...
Sample code explanation
The code snippets in this section come from the preceding sample.
In the following highlighted code, an instance of the MeterListener is created to receive measurements. The using keyword causes Dispose to be called when the meterListener goes out of scope.
using MeterListener meterListener = new();
meterListener.InstrumentPublished = (instrument, listener) =>
{
    if (instrument.Meter.Name is "HatCo.HatStore")
    {
        listener.EnableMeasurementEvents(instrument);
    }
};
The following highlighted code configures which instruments the listener receives measurements from. InstrumentPublished is a delegate that is invoked when a new instrument is created within the app.
using MeterListener meterListener = new();
meterListener.InstrumentPublished = (instrument, listener) =>
{
    if (instrument.Meter.Name is "HatCo.HatStore")
    {
        listener.EnableMeasurementEvents(instrument);
    }
};
The delegate can examine the instrument to decide whether to subscribe. For example, the delegate can check the name, the Meter, or any other public property. EnableMeasurementEvents enables receiving measurements from the specified instrument. Code that obtains a reference to an instrument by another approach:
- Is not typically done.
- Can invoke
EnableMeasurementEvents()at any time with the reference.
The delegate that is invoked when measurements are received from an instrument is configured by calling SetMeasurementEventCallback:
    meterListener.SetMeasurementEventCallback<int>(OnMeasurementRecorded);
    // Start the meterListener, enabling InstrumentPublished callbacks.
    meterListener.Start();

    var rand = Random.Shared;
    Console.WriteLine("Press any key to exit");
    while (!Console.KeyAvailable)
    {
        //// Simulate hat selling transactions.
        Thread.Sleep(rand.Next(100, 2500));
        s_hatsSold.Add(rand.Next(0, 1000));
    }
}

static void OnMeasurementRecorded<T>(
    Instrument instrument,
    T measurement,
    ReadOnlySpan<KeyValuePair<string, object?>> tags,
    object? state)
{
    Console.WriteLine($"{instrument.Name} recorded measurement {measurement}");
}
The generic parameter controls which data type of measurement is received by the callback. For example, a Counter<int> generates int measurements, Counter<double> generates double measurements. Instruments can be created with byte, short, int, long, float, double, and decimal types. We recommend registering a callback for every data type unless you have scenario-specific knowledge that not all data types are needed. Making repeated calls to SetMeasurementEventCallback with different generic arguments may appear a little unusual. The API was designed this way to allow a MeterListener to receive measurements with low performance overhead, typically just a few nanoseconds.
When MeterListener.EnableMeasurementEvents is called, a state object can be provided as
one of the parameters. The state object is arbitrary. If you provide a state object in that call, then it is stored with that instrument and returned to you as the state parameter in the callback. This is intended both as a convenience and as a performance optimization. Often listeners need to:
- Create an object for each instrument that is storing measurements in memory.
- Have code to do calculations on those measurements.
Alternatively, create a Dictionary that maps from the instrument to the storage object and look it up on every measurement. Using a Dictionary is much slower than accessing it from state.
meterListener.Start();
The preceding code starts the MeterListener which enables callbacks. The InstrumentPublished delegate is invoked for every pre-existing Instrument in the process. Newly created Instrument objects also trigger InstrumentPublished to be invoked.
using MeterListener meterListener = new MeterListener();
When the app is done listening, disposing the listener stops the flow of callbacks and releases any internal references to the listener object. The using keyword used when declaring meterListener causes Dispose to be called when the variable goes out of scope. Note that Dispose is only promising that it won't initiate new callbacks. Because callbacks
occur on different threads, there may still be callbacks in progress after the call to Dispose returns.
To guarantee that a certain region of code in the callback isn't currently executing and won't execute in the future, thread synchronization must be added. Dispose doesn't include synchronization by default because:
- Synchronization adds performance overhead in every measurement callback.
MeterListeneris designed as a highly performance conscious API.
Collaborate with us on GitHub
The source for this content can be found on GitHub, where you can also create and review issues and pull requests. For more information, see our contributor guide.