Note
Access to this page requires authorization. You can try signing in or changing directories.
Access to this page requires authorization. You can try changing directories.
Learn how to forecast demand for a bike rental service using univariate time series analysis on data stored in a SQL Server database with ML.NET.
In this tutorial, you learn how to:
- Understand the problem
- Load data from a database
- Create a forecasting model
- Evaluate forecasting model
- Save a forecasting model
- Use a forecasting model
Prerequisites
- Visual Studio 2022 or later with the .NET Desktop Development workload installed.
Time series forecasting sample overview
This sample is a C# console application that forecasts demand for bike rentals using a univariate time series analysis algorithm known as Singular Spectrum Analysis. The code for this sample can be found on the dotnet/machinelearning-samples repository on GitHub.
Understand the problem
In order to run an efficient operation, inventory management plays a key role. Having too much of a product in stock means unsold products sitting on the shelves not generating any revenue. Having too little product leads to lost sales and customers purchasing from competitors. Therefore, the constant question is, what is the optimal amount of inventory to keep on hand? Time-series analysis helps provide an answer to these questions by looking at historical data, identifying patterns, and using this information to forecast values some time in the future.
The technique for analyzing data used in this tutorial is univariate time-series analysis. Univariate time-series analysis takes a look at a single numerical observation over a period of time at specific intervals such as monthly sales.
The algorithm used in this tutorial is Singular Spectrum Analysis(SSA). SSA works by decomposing a time-series into a set of principal components. These components can be interpreted as the parts of a signal that correspond to trends, noise, seasonality, and many other factors. Then, these components are reconstructed and used to forecast values some time in the future.
Create console application
Create a C# Console Application called "BikeDemandForecasting". Click the Next button.
Choose .NET 8 as the framework to use. Click the Create button.
Install Microsoft.ML version NuGet package
Note
This sample uses the latest stable version of the NuGet packages mentioned unless otherwise stated.
- In Solution Explorer, right-click on your project and select Manage NuGet Packages.
- Choose "nuget.org" as the Package source, select the Browse tab, search for Microsoft.ML.
- Check the Include prerelease checkbox.
- Select the Install button.
- Select the OK button on the Preview Changes dialog and then select the I Accept button on the License Acceptance dialog if you agree with the license terms for the packages listed.
- Repeat these steps for System.Data.SqlClient and Microsoft.ML.TimeSeries.
Prepare and understand the data
- Create a directory called Data.
- Download the DailyDemand.mdf database file and save it to the Data directory.
Note
The data used in this tutorial comes from the UCI Bike Sharing Dataset. Hadi Fanaee-T and João Gama, 'Event labeling combining ensemble detectors and background knowledge', Progress in Artificial Intelligence (2013): pp. 1-15, Springer Berlin Heidelberg, Web Link.
The original dataset contains several columns corresponding to seasonality and weather. For brevity and because the algorithm used in this tutorial only requires the values from a single numerical column, the original dataset has been condensed to include only the following columns:
- dteday: The date of the observation.
- year: The encoded year of the observation (0=2011, 1=2012).
- cnt: The total number of bike rentals for that day.
The original dataset is mapped to a database table with the following schema in a SQL Server database.
CREATE TABLE [Rentals] (
    [RentalDate] DATE NOT NULL,
    [Year] INT NOT NULL,
    [TotalRentals] INT NOT NULL
);
The following is a sample of the data:
| RentalDate | Year | TotalRentals |
|---|---|---|
| 1/1/2011 | 0 | 985 |
| 1/2/2011 | 0 | 801 |
| 1/3/2011 | 0 | 1349 |
Create input and output classes
Open Program.cs file and replace the existing
usingdirectives with the following:using Microsoft.ML; using Microsoft.ML.Data; using Microsoft.ML.Transforms.TimeSeries; using System.Data.SqlClient;Create
ModelInputclass. Below theProgramclass, add the following code.public class ModelInput { public DateTime RentalDate { get; set; } public float Year { get; set; } public float TotalRentals { get; set; } }The
ModelInputclass contains the following columns:- RentalDate: The date of the observation.
- Year: The encoded year of the observation (0=2011, 1=2012).
- TotalRentals: The total number of bike rentals for that day.
Create
ModelOutputclass below the newly createdModelInputclass.public class ModelOutput { public float[] ForecastedRentals { get; set; } public float[] LowerBoundRentals { get; set; } public float[] UpperBoundRentals { get; set; } }The
ModelOutputclass contains the following columns:- ForecastedRentals: The predicted values for the forecasted period.
- LowerBoundRentals: The predicted minimum values for the forecasted period.
- UpperBoundRentals: The predicted maximum values for the forecasted period.
Define paths and initialize variables
Below the
usingdirectives define variables to store the location of your data, connection string, and where to save the trained model.string rootDir = Path.GetFullPath(Path.Combine(AppDomain.CurrentDomain.BaseDirectory, "../../../")); string dbFilePath = Path.Combine(rootDir, "Data", "DailyDemand.mdf"); string modelPath = Path.Combine(rootDir, "MLModel.zip"); var connectionString = $"Data Source=(LocalDB)\\MSSQLLocalDB;AttachDbFilename={dbFilePath};Integrated Security=True;Connect Timeout=30;";Initialize the
mlContextvariable with a new instance ofMLContextby adding the following line after defining the paths.MLContext mlContext = new MLContext();The
MLContextclass is a starting point for all ML.NET operations, and initializing mlContext creates a new ML.NET environment that can be shared across the model creation workflow objects. It's similar, conceptually, toDBContextin Entity Framework.
Load the data
Create
DatabaseLoaderthat loads records of typeModelInput.DatabaseLoader loader = mlContext.Data.CreateDatabaseLoader<ModelInput>();Define the query to load the data from the database.
string query = "SELECT RentalDate, CAST(Year as REAL) as Year, CAST(TotalRentals as REAL) as TotalRentals FROM Rentals";ML.NET algorithms expect data to be of type
Single. Therefore, numerical values coming from the database that are not of typeReal, a single-precision floating-point value, have to be converted toReal.The
YearandTotalRentalcolumns are both integer types in the database. Using theCASTbuilt-in function, they are both cast toReal.Create a
DatabaseSourceto connect to the database and execute the query.DatabaseSource dbSource = new DatabaseSource(SqlClientFactory.Instance, connectionString, query);Load the data into an
IDataView.IDataView dataView = loader.Load(dbSource);The dataset contains two years worth of data. Only data from the first year is used for training, the second year is held out to compare the actual values against the forecast produced by the model. Filter the data using the
FilterRowsByColumntransform.IDataView firstYearData = mlContext.Data.FilterRowsByColumn(dataView, "Year", upperBound: 1); IDataView secondYearData = mlContext.Data.FilterRowsByColumn(dataView, "Year", lowerBound: 1);For the first year, only the values in the
Yearcolumn less than 1 are selected by setting theupperBoundparameter to 1. Conversely, for the second year, values greater than or equal to 1 are selected by setting thelowerBoundparameter to 1.
Define time series analysis pipeline
Define a pipeline that uses the SsaForecastingEstimator to forecast values in a time-series dataset.
var forecastingPipeline = mlContext.Forecasting.ForecastBySsa(
    outputColumnName: "ForecastedRentals",
    inputColumnName: "TotalRentals",
    windowSize: 7,
    seriesLength: 30,
    trainSize: 365,
    horizon: 7,
    confidenceLevel: 0.95f,
    confidenceLowerBoundColumn: "LowerBoundRentals",
    confidenceUpperBoundColumn: "UpperBoundRentals");
The
forecastingPipelinetakes 365 data points for the first year and samples or splits the time-series dataset into 30-day (monthly) intervals as specified by theseriesLengthparameter. Each of these samples is analyzed through weekly or a 7-day window. When determining what the forecasted value for the next period(s) is, the values from previous seven days are used to make a prediction. The model is set to forecast seven periods into the future as defined by thehorizonparameter. Because a forecast is an informed guess, it's not always 100% accurate. Therefore, it's good to know the range of values in the best and worst-case scenarios as defined by the upper and lower bounds. In this case, the level of confidence for the lower and upper bounds is set to 95%. The confidence level can be increased or decreased accordingly. The higher the value, the wider the range is between the upper and lower bounds to achieve the desired level of confidence.Use the
Fitmethod to train the model and fit the data to the previously definedforecastingPipeline.SsaForecastingTransformer forecaster = forecastingPipeline.Fit(firstYearData);
Evaluate the model
Evaluate how well the model performs by forecasting next year's data and comparing it against the actual values.
Create a new utility method called
Evaluateat the bottom of the Program.cs file.Evaluate(IDataView testData, ITransformer model, MLContext mlContext) { }Inside the
Evaluatemethod, forecast the second year's data by using theTransformmethod with the trained model.IDataView predictions = model.Transform(testData);Get the actual values from the data by using the
CreateEnumerablemethod.IEnumerable<float> actual = mlContext.Data.CreateEnumerable<ModelInput>(testData, true) .Select(observed => observed.TotalRentals);Get the forecast values by using the
CreateEnumerablemethod.IEnumerable<float> forecast = mlContext.Data.CreateEnumerable<ModelOutput>(predictions, true) .Select(prediction => prediction.ForecastedRentals[0]);Calculate the difference between the actual and forecast values, commonly referred to as the error.
var metrics = actual.Zip(forecast, (actualValue, forecastValue) => actualValue - forecastValue);Measure performance by computing the Mean Absolute Error and Root Mean Squared Error values.
var MAE = metrics.Average(error => Math.Abs(error)); // Mean Absolute Error
var RMSE = Math.Sqrt(metrics.Average(error => Math.Pow(error, 2))); // Root Mean Squared Error
To evaluate performance, the following metrics are used:
- Mean Absolute Error: Measures how close predictions are to the actual value. This value ranges between 0 and infinity. The closer to 0, the better the quality of the model.
- Root Mean Squared Error: Summarizes the error in the model. This value ranges between 0 and infinity. The closer to 0, the better the quality of the model.
Output the metrics to the console.
Console.WriteLine("Evaluation Metrics");
Console.WriteLine("---------------------");
Console.WriteLine($"Mean Absolute Error: {MAE:F3}");
Console.WriteLine($"Root Mean Squared Error: {RMSE:F3}\n");
Call the
Evaluatemethod below calling theFit()method.Evaluate(secondYearData, forecaster, mlContext);
Save the model
If you're satisfied with your model, save it for later use in other applications.
Below the
Evaluate()method create aTimeSeriesPredictionEngine.TimeSeriesPredictionEngineis a convenience method to make single predictions.var forecastEngine = forecaster.CreateTimeSeriesEngine<ModelInput, ModelOutput>(mlContext);Save the model to a file called
MLModel.zipas specified by the previously definedmodelPathvariable. Use theCheckpointmethod to save the model.forecastEngine.CheckPoint(mlContext, modelPath);
Use the model to forecast demand
Below the
Evaluatemethod, create a new utility method calledForecast.void Forecast(IDataView testData, int horizon, TimeSeriesPredictionEngine<ModelInput, ModelOutput> forecaster, MLContext mlContext) { }Inside the
Forecastmethod, use thePredictmethod to forecast rentals for the next seven days.ModelOutput forecast = forecaster.Predict();Align the actual and forecast values for seven periods.
IEnumerable<string> forecastOutput =
    mlContext.Data.CreateEnumerable<ModelInput>(testData, reuseRowObject: false)
        .Take(horizon)
        .Select((ModelInput rental, int index) =>
        {
            string rentalDate = rental.RentalDate.ToShortDateString();
            float actualRentals = rental.TotalRentals;
            float lowerEstimate = Math.Max(0, forecast.LowerBoundRentals[index]);
            float estimate = forecast.ForecastedRentals[index];
            float upperEstimate = forecast.UpperBoundRentals[index];
            return $"Date: {rentalDate}\n" +
            $"Actual Rentals: {actualRentals}\n" +
            $"Lower Estimate: {lowerEstimate}\n" +
            $"Forecast: {estimate}\n" +
            $"Upper Estimate: {upperEstimate}\n";
        });
Iterate through the forecast output and display it on the console.
Console.WriteLine("Rental Forecast");
Console.WriteLine("---------------------");
foreach (var prediction in forecastOutput)
{
    Console.WriteLine(prediction);
}
Run the application
Below calling the
Checkpoint()method call theForecastmethod.Forecast(secondYearData, 7, forecastEngine, mlContext);Run the application. Output similar to that below should appear on the console. For brevity, the output has been condensed.
Evaluation Metrics
---------------------
Mean Absolute Error: 726.416
Root Mean Squared Error: 987.658

Rental Forecast
---------------------
Date: 1/1/2012
Actual Rentals: 2294
Lower Estimate: 1197.842
Forecast: 2334.443
Upper Estimate: 3471.044

Date: 1/2/2012
Actual Rentals: 1951
Lower Estimate: 1148.412
Forecast: 2360.861
Upper Estimate: 3573.309
Inspection of the actual and forecasted values shows the following relationships:
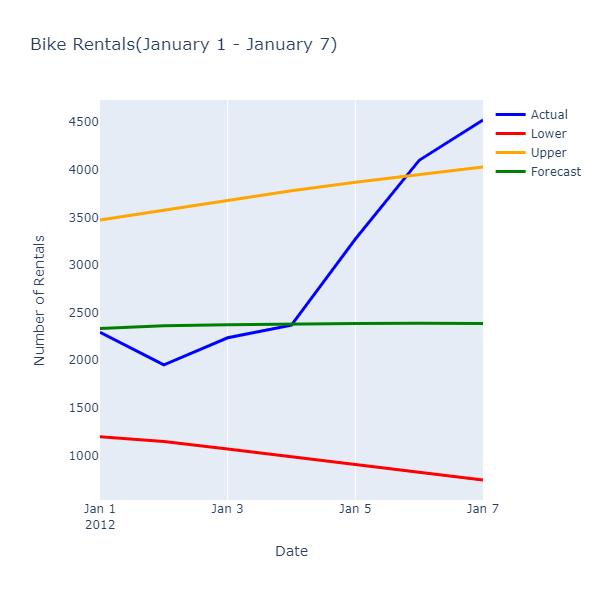
While the forecasted values are not predicting the exact number of rentals, they provide a more narrow range of values that allows an operation to optimize their use of resources.
Congratulations! You've now successfully built a time series machine learning model to forecast bike rental demand.
You can find the source code for this tutorial at the dotnet/machinelearning-samples repository.
Next steps
Collaborate with us on GitHub
The source for this content can be found on GitHub, where you can also create and review issues and pull requests. For more information, see our contributor guide.