Note
Access to this page requires authorization. You can try signing in or changing directories.
Access to this page requires authorization. You can try changing directories.
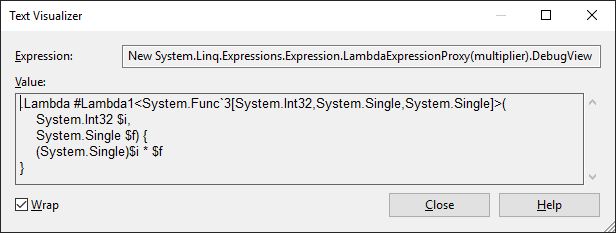
You can analyze the structure and content of expression trees when you debug your applications. To get a quick overview of the expression tree structure, you can use the DebugView property, which represents expression trees using a special syntax. (Note that DebugView is available only in debug mode.)

Since DebugView is a string, you can use the built-in Text Visualizer to view it across multiple lines, by selecting Text Visualizer from the magnifying glass icon next to the DebugView label.
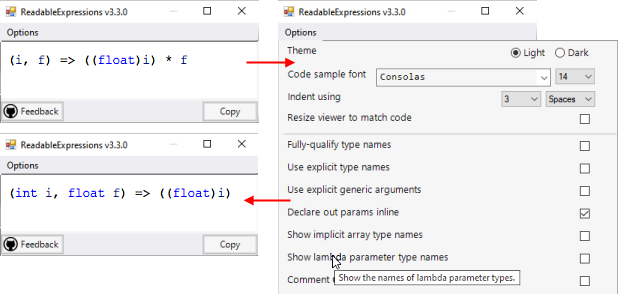
Alternatively, you can install and use a custom visualizer for expression trees, such as:
Readable Expressions (MIT license, available at the Visual Studio Marketplace), renders the expression tree as themeable C# code, with various rendering options:
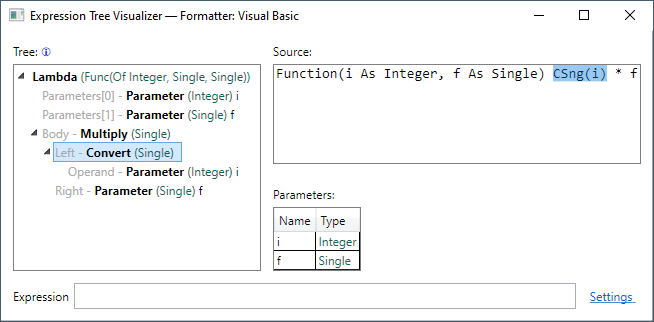
Expression Tree Visualizer (MIT license) provides a tree view of the expression tree and its individual nodes; and can render the expression tree using Visual Basic syntax:
To open a visualizer for an expression tree
Click the magnifying glass icon that appears next to the expression tree in DataTips, a Watch window, the Autos window, or the Locals window.
A list of available visualizers is displayed.:
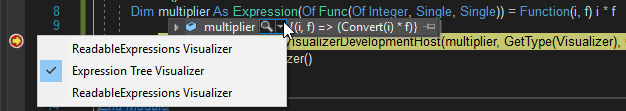
Click the visualizer you want to use.
See also
Collaborate with us on GitHub
The source for this content can be found on GitHub, where you can also create and review issues and pull requests. For more information, see our contributor guide.