Note
Access to this page requires authorization. You can try signing in or changing directories.
Access to this page requires authorization. You can try changing directories.
Note
We're working to improve the onboarding experience for AL developers. If you have feedback about this article, use the Feedback section at the bottom of the article to tell us what you'd like to see.
We also welcome contributions to our documentation. Learn more about contributing in Contribute to the help.
Debugging is the process of finding and correcting errors. Visual Studio Code and the AL Language extension for Microsoft Dynamics 365 Business Central provide an integrated debugger that helps you inspect code and verify that your application runs as expected. Press F5 to start a debugging session. Learn more about Visual Studio Code debugging in Debugging.
An alternative to classic debugging is snapshot debugging, which allows you to record running code and debug it later. Learn more in Snapshot debugging.
Limitations to be aware of
- You can debug external code only if the code has the
allowDebuggingflag set totrue. Learn more about this setting in Resource exposure policy. - By default, starting a launch debugging session opens the web client because
launchBrowseristrue. - Pausing the debugging session isn't supported.
To control table data synchronization between each debugging session, see Retaining table data after publishing.
Breakpoints
The basic concept in debugging is the breakpoint, which is a mark that you set on a statement. When the program flow reaches the breakpoint, the debugger stops execution until you instruct it to continue. Without any breakpoints, the code runs without interruption when the debugger is active. You can set a breakpoint by using the Debug Menu in Visual Studio Code. Learn more in Debugging shortcuts.
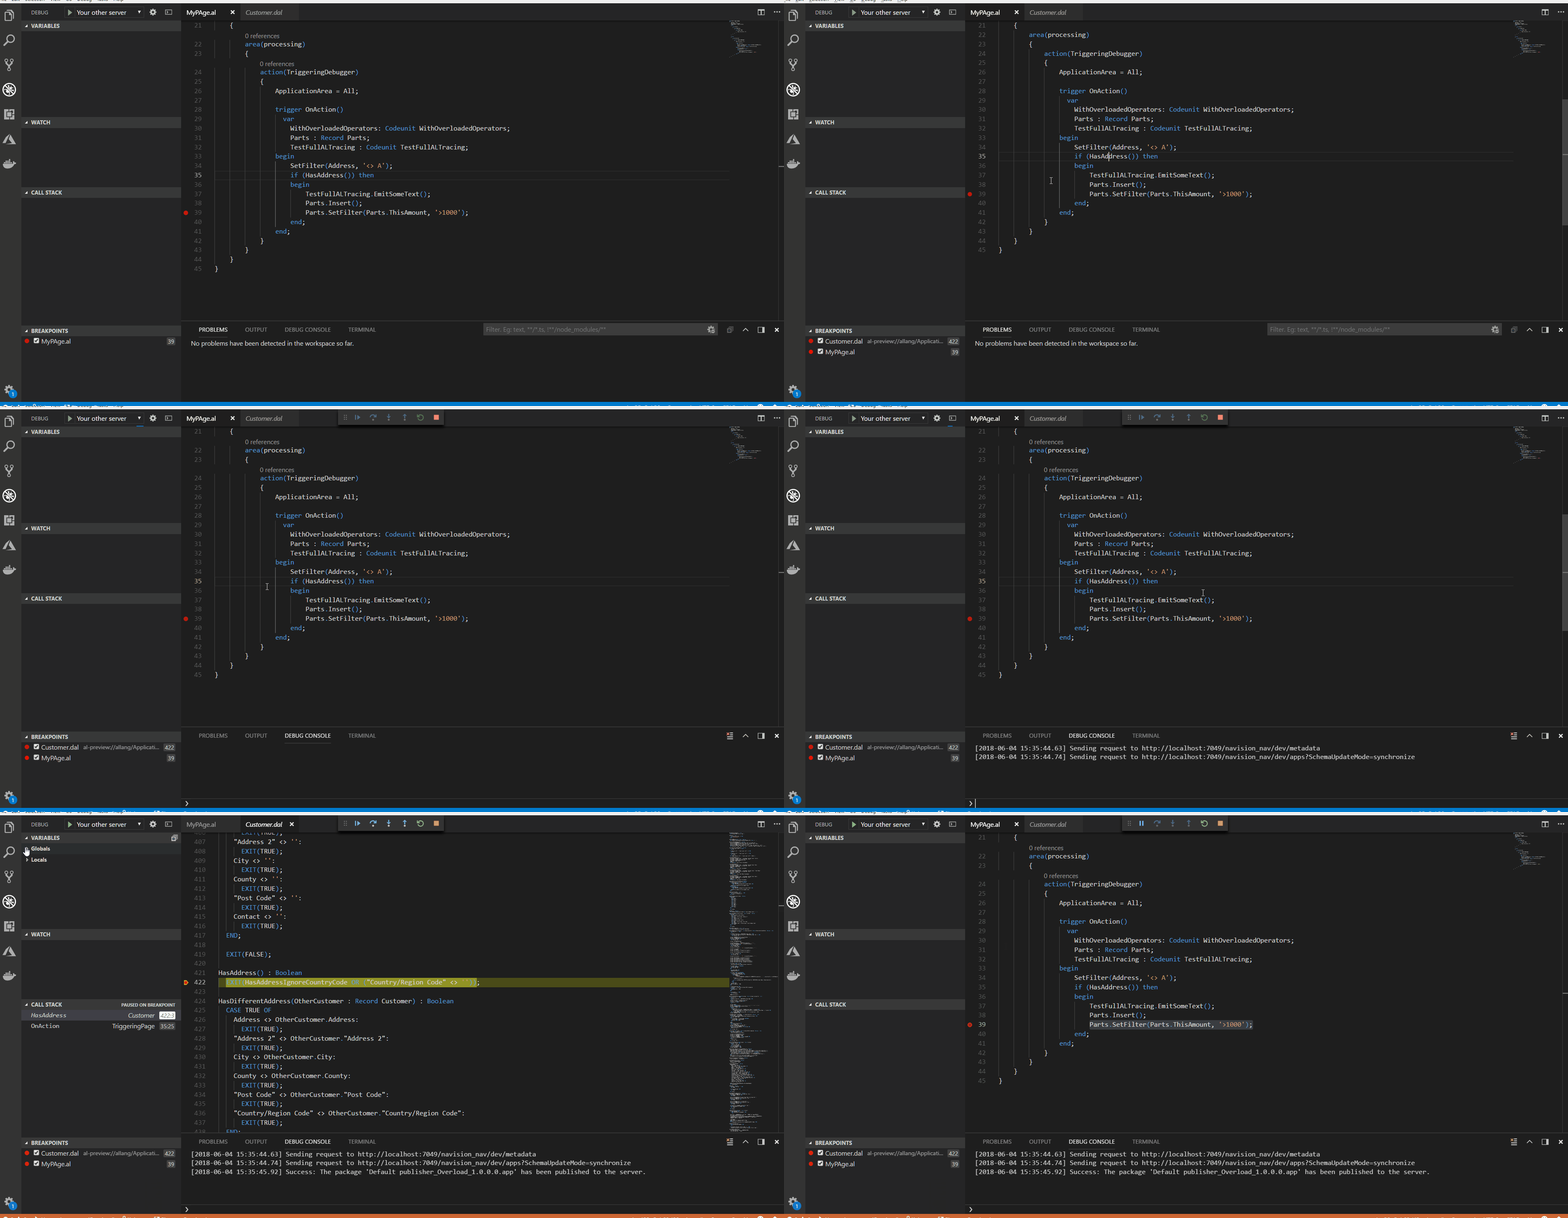
You can set breakpoints in external code that isn't part of your project when its resource exposure policy allows debugging. Use Go to Definition to open the referenced code, which is generally a .dal file, and set a breakpoint. You can also step into the external code during a debugging session and set a breakpoint.
The following video shows how to set a breakpoint in the external Customer.dal file referenced by an AL project.
Learn more about Go to Definition in AL code navigation.
Conditional breakpoints
If a breakpoint condition evaluates to true, code execution stops at the breakpoint. Learn more in Setting conditional breakpoints.
Break on errors
Use the breakOnError property to specify whether the debugger breaks on the next error. If the debugger is set to breakOnError, it stops execution on both errors that are handled in code and unhandled errors.
The default value of breakOnError is All. Other supported values are None and ExcludeTry. To prevent the debugger from breaking on errors, set the property to None. The older Boolean values remain accepted for compatibility.
Break on record changes
Use the breakOnRecordWrite property to specify whether the debugger breaks on record changes. If the debugger is set to break on record changes, it breaks before creating, modifying, or deleting a record. The following table shows each record change and the AL methods that cause each change.
| Record change | AL Methods |
|---|---|
| Create a new record | Insert method (Record) |
| Update an existing record | Modify method (Record), ModifyAll method (Record), Rename method (Record) |
| Delete an existing record | Delete method (Record), DeleteAll method (Record) |
The default value of breakOnRecordWrite is None. Set it to All to break on all supported record changes, or ExcludeTemporary to ignore writes to temporary records. The older Boolean values remain accepted for compatibility. Learn more about these values in Launch JSON file.
Debugging large size variable values
String values longer than 1,024 characters are truncated with an ellipsis in the VARIABLES pane. To inspect the full value, enter the variable name or qualified name in the DEBUG CONSOLE, and then press Enter.
Attach and debug next
If you don't want to publish and invoke the functionality to debug it, you can attach a session to a specified server and await a process to trigger the breakpoint you have set. This is useful when you want to debug a specific process, such as a web service call. Learn more in Attach and debug next.
Debugging shortcuts
| Keystroke | Action |
|---|---|
| F5 | Start debugging |
| Ctrl+F5 | Start without debugging. During an active debugging session, publish the existing extension without rebuilding. |
| Shift+F5 | Stop debugging |
| Ctrl+Shift+F5 | Start debugging without publishing. If the code changed after it was last published, existing breakpoints might map to incorrect lines. For example, if you add two lines to a published method and set a breakpoint on the second new line, the server uses line mappings from the last published code. As a result, the breakpoint might not be hit or might stop on a different line. |
| Alt+F5 | Start RAD with debugging. Learn more in Working with Rapid Application Development. |
| F10 | Step over |
| F11 | Step into |
| Shift+F11 | Step out |
| F12 | Go To Definition |
Learn more about shortcuts in Debugging in Visual Studio Code. Learn more about working with Snapshot debugging in Snapshot debugging.
Debug SQL behavior
The AL debugger can examine your AL code's effect on the Business Central database. The enableSqlInformationDebugger setting enables this functionality and defaults to true. Learn more about debugger settings in Launch JSON file.
View database statistics
In the debugger's VARIABLES pane, expand the <Database statistics> node to view database statistics. These statistics include network latency, executed SQL statements, rows read, held locks, and details about recent SQL statements.
| Insight | Description |
|---|---|
| Current SQL latency (ms) | When the debugger hits a breakpoint, the Business Central Server sends a short SQL statement to the database, and measures the time it takes. The value is in milliseconds. |
| Number of SQL Executes | This number shows the total number of SQL statements executed in the debugging session since the debugger was started. |
| Number of SQL Row Reads | This number shows the total number of rows read from the Business Central database in the debugging session since the debugger started. |
Tip
You can also get database insights from the AL runtime by using the SqlStatementsExecuted() and SqlRowsRead() methods.
View locks held
The Locks section shows the SQL locks held by the debugged session and each lock's access mode. Use this information to understand locks acquired as you step through AL code and evaluate concurrency compatibility with other operations.
View SQL statement statistics
The database insights show the most recently executed SQL statements and the latest long-running SQL statements. To view a list of the statements, expand either the <Last Executed SQL Statements> or <Last Long Running SQL Statements> node. The following insights are part of the SQL statement statistics:
| Insight | Description |
|---|---|
| Statement | The SQL statement that the AL server sent to the Business Central database. For further analysis, you can copy the SQL statement into other database tools, such as SQL Server Management Studio. |
| Execution time (UTC) | The UTC timestamp for the SQL statement. Use this value to determine whether the statement ran between the current breakpoint and the previous breakpoint, if one is set. |
| Duration (ms) | The total execution time of the SQL statement, measured inside the Business Central Server. Use Duration (ms) to identify potentially missing Business Central keys or to test the performance effects of database partitioning and compression. |
| Approx. Rows Read | This number shows the approximate number of rows read from the Business Central database by the SQL statement. You can use this insight to analyze whether you're missing filters. |
The numberOfSqlStatements setting in launch.json controls the number of SQL statements that the debugger tracks and defaults to 10. The launch configuration also provides enableLongRunningSqlStatements and longRunningSqlStatementsThreshold. For on-premises environments, corresponding server settings can control the available SQL statistics.
Note
For Business Central on-premises, Business Central Server configuration settings control the SQL statistics available in the debugger. These settings determine whether the debugger shows SQL statements and long-running SQL statements. Check the server configuration if the expected insights don't appear. Learn more in Configuring Business Central server.
Debugging web services
You can debug code that runs from web service endpoints, including pages and codeunits exposed as OData or SOAP web services, and API pages and queries. Set breakOnNext to WebServiceClient and trigger the endpoint from an API explorer tool or your web service client code. Learn more in Attach and debug next.
NonDebuggable attribute
The NonDebuggable attribute can restrict debugging for certain methods or variables. Learn more in NonDebuggable attribute.
Authenticate with Microsoft Entra ID on Business Central on-premises
You can use Microsoft Entra ID as the authentication mechanism for Business Central on-premises or containers. Learn more in Microsoft Entra authentication for Business Central on-premises.
Troubleshooting your debugging setup
This section provides some tips and tricks for working with and troubleshooting your debugging setup.
Firewall settings for port 7049 in on-premises environments
To use the development environment and debugger for on-premises environments, ensure that port 7049, the default debugger port, is open. You can change the port by using the DeveloperServicesPort server setting.
Debug an online environment with an Embed app published in it
For an existing online environment with an Embed app, specify the applicationFamily property in launch.json. You define the application family during Embed app onboarding.
Launching debug sessions to on-premises environments
For on-premises launch configurations, usePublicURLFromServer defaults to true, which opens the browser by using the server's PublicWebBaseURL. Set it to false to use the server URL from launch.json instead. Learn more about this setting in Publish to local server settings.
Related information
Attach and debug next
Snapshot debugging
Developing extensions
JSON files
AL code navigation