Access and interpret analytics
Customer Insights - Journeys's dashboards and cross-journey insights show metrics, views, and insights summarized across single or multiple journeys, providing a deep understanding of journey, channel, and content performance. The built-in dashboards focus on measuring delivery, engagement, and journey goal attainment so that you can fine-tune the effectiveness of your journeys, channels, and content.
Customer Insights - Journeys analytics overview
With Customer Insights - Journeys analytics, you can:
- Evaluate the effectiveness of journeys against your objectives.
- Troubleshoot journeys by identifying areas of friction.
- Discover what is working so that you can amplify or recreate the same approach elsewhere.
- Understand the effectiveness of various messages and channels of communication through key delivery and engagement insights.
- Gain insights into your audience's behavior and interests and tailor your marketing efforts to their specific needs.
Contact insights
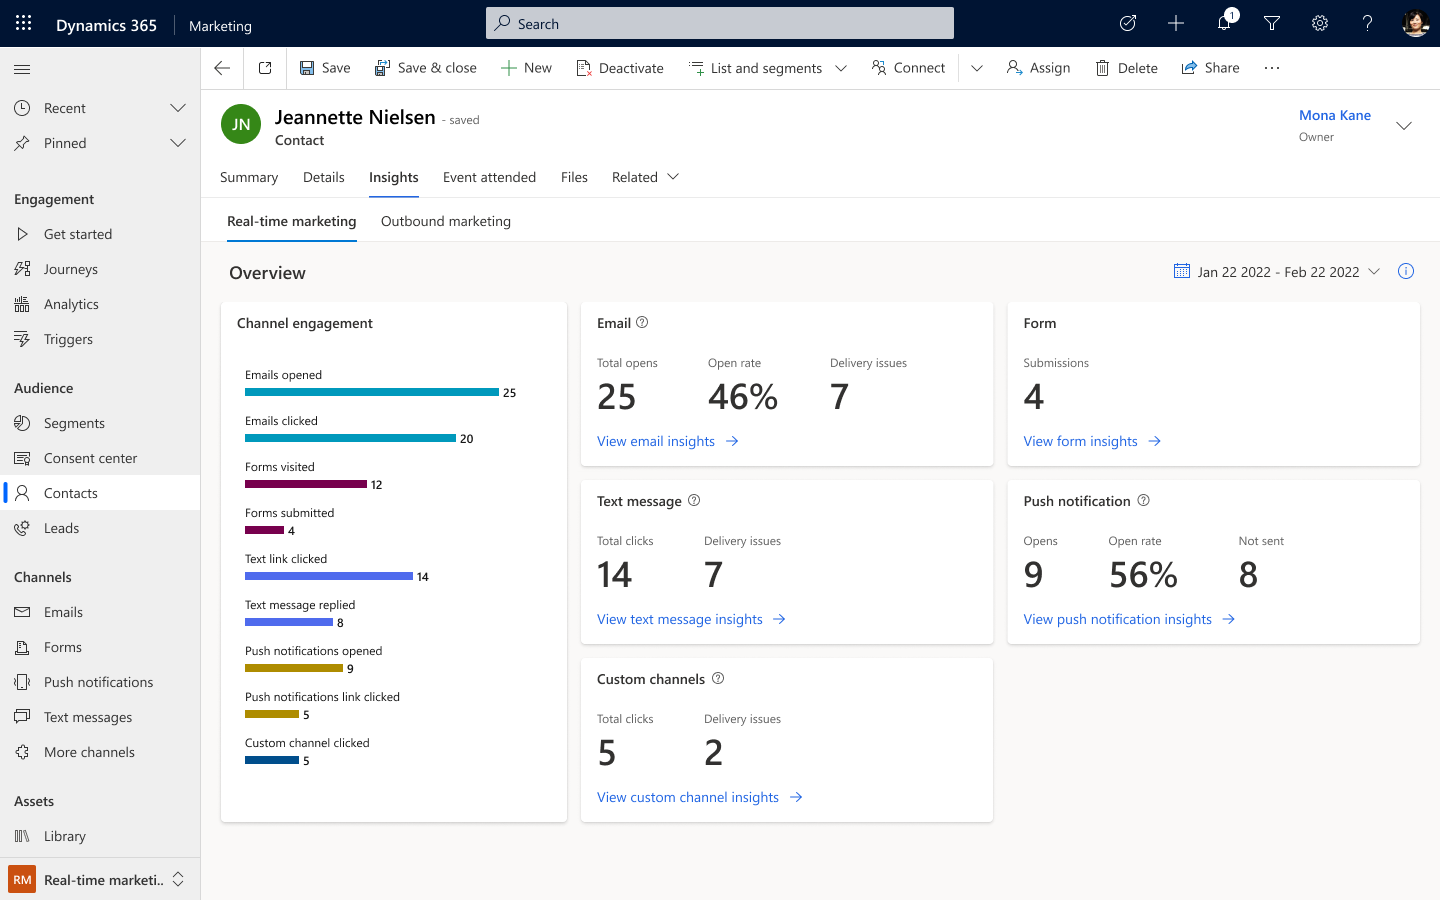
Contact insights is a comprehensive view of how a contact has engaged with your journeys, including all past email sends, opens, clicks, form submissions, and more. Better understand your audience's behavior and interests, make informed decisions based on past engagement, and tailor your marketing efforts to their needs and preferences. To view contact insights, go to Real-time journeys > Audience > Contacts, select a contact record, and then open its Insights tab.
The following insights categories are provided:
Overview: A chart of the engagement interactions and a summary of the most important KPIs for each channel for the selected contact.
Email insights: Complete details of email interactions for the selected contact, including a list of all messages sent to them, plus lists of all opens, clicks, bounces, and more. View the email clients used to open emails and the device types, operating systems, and browsers used to click on emails.
Form insights: See which marketing forms the contact has visited and submitted. View the content of each submission.
Text message insights: Complete details of text message interactions for the selected contact, including a list of all messages sent to them, plus lists of all clicks, replies, and more.
Push notification insights: Complete details of push notification interactions for the selected contact, including a list of all messages sent to them and more.
Custom channels insights: Complete details of custom channel interactions for the selected contact, including messages sent, clicked and more.

Lead insights
Just like with contact insights, you can access a complete overview of your selected lead's interactions with your marketing initiatives. The insights categories displayed for a lead are the same as previously described in contact insights. To view lead insights, go to Real-time journeys > Audience > Leads, select a lead record, and then open its Insights tab.
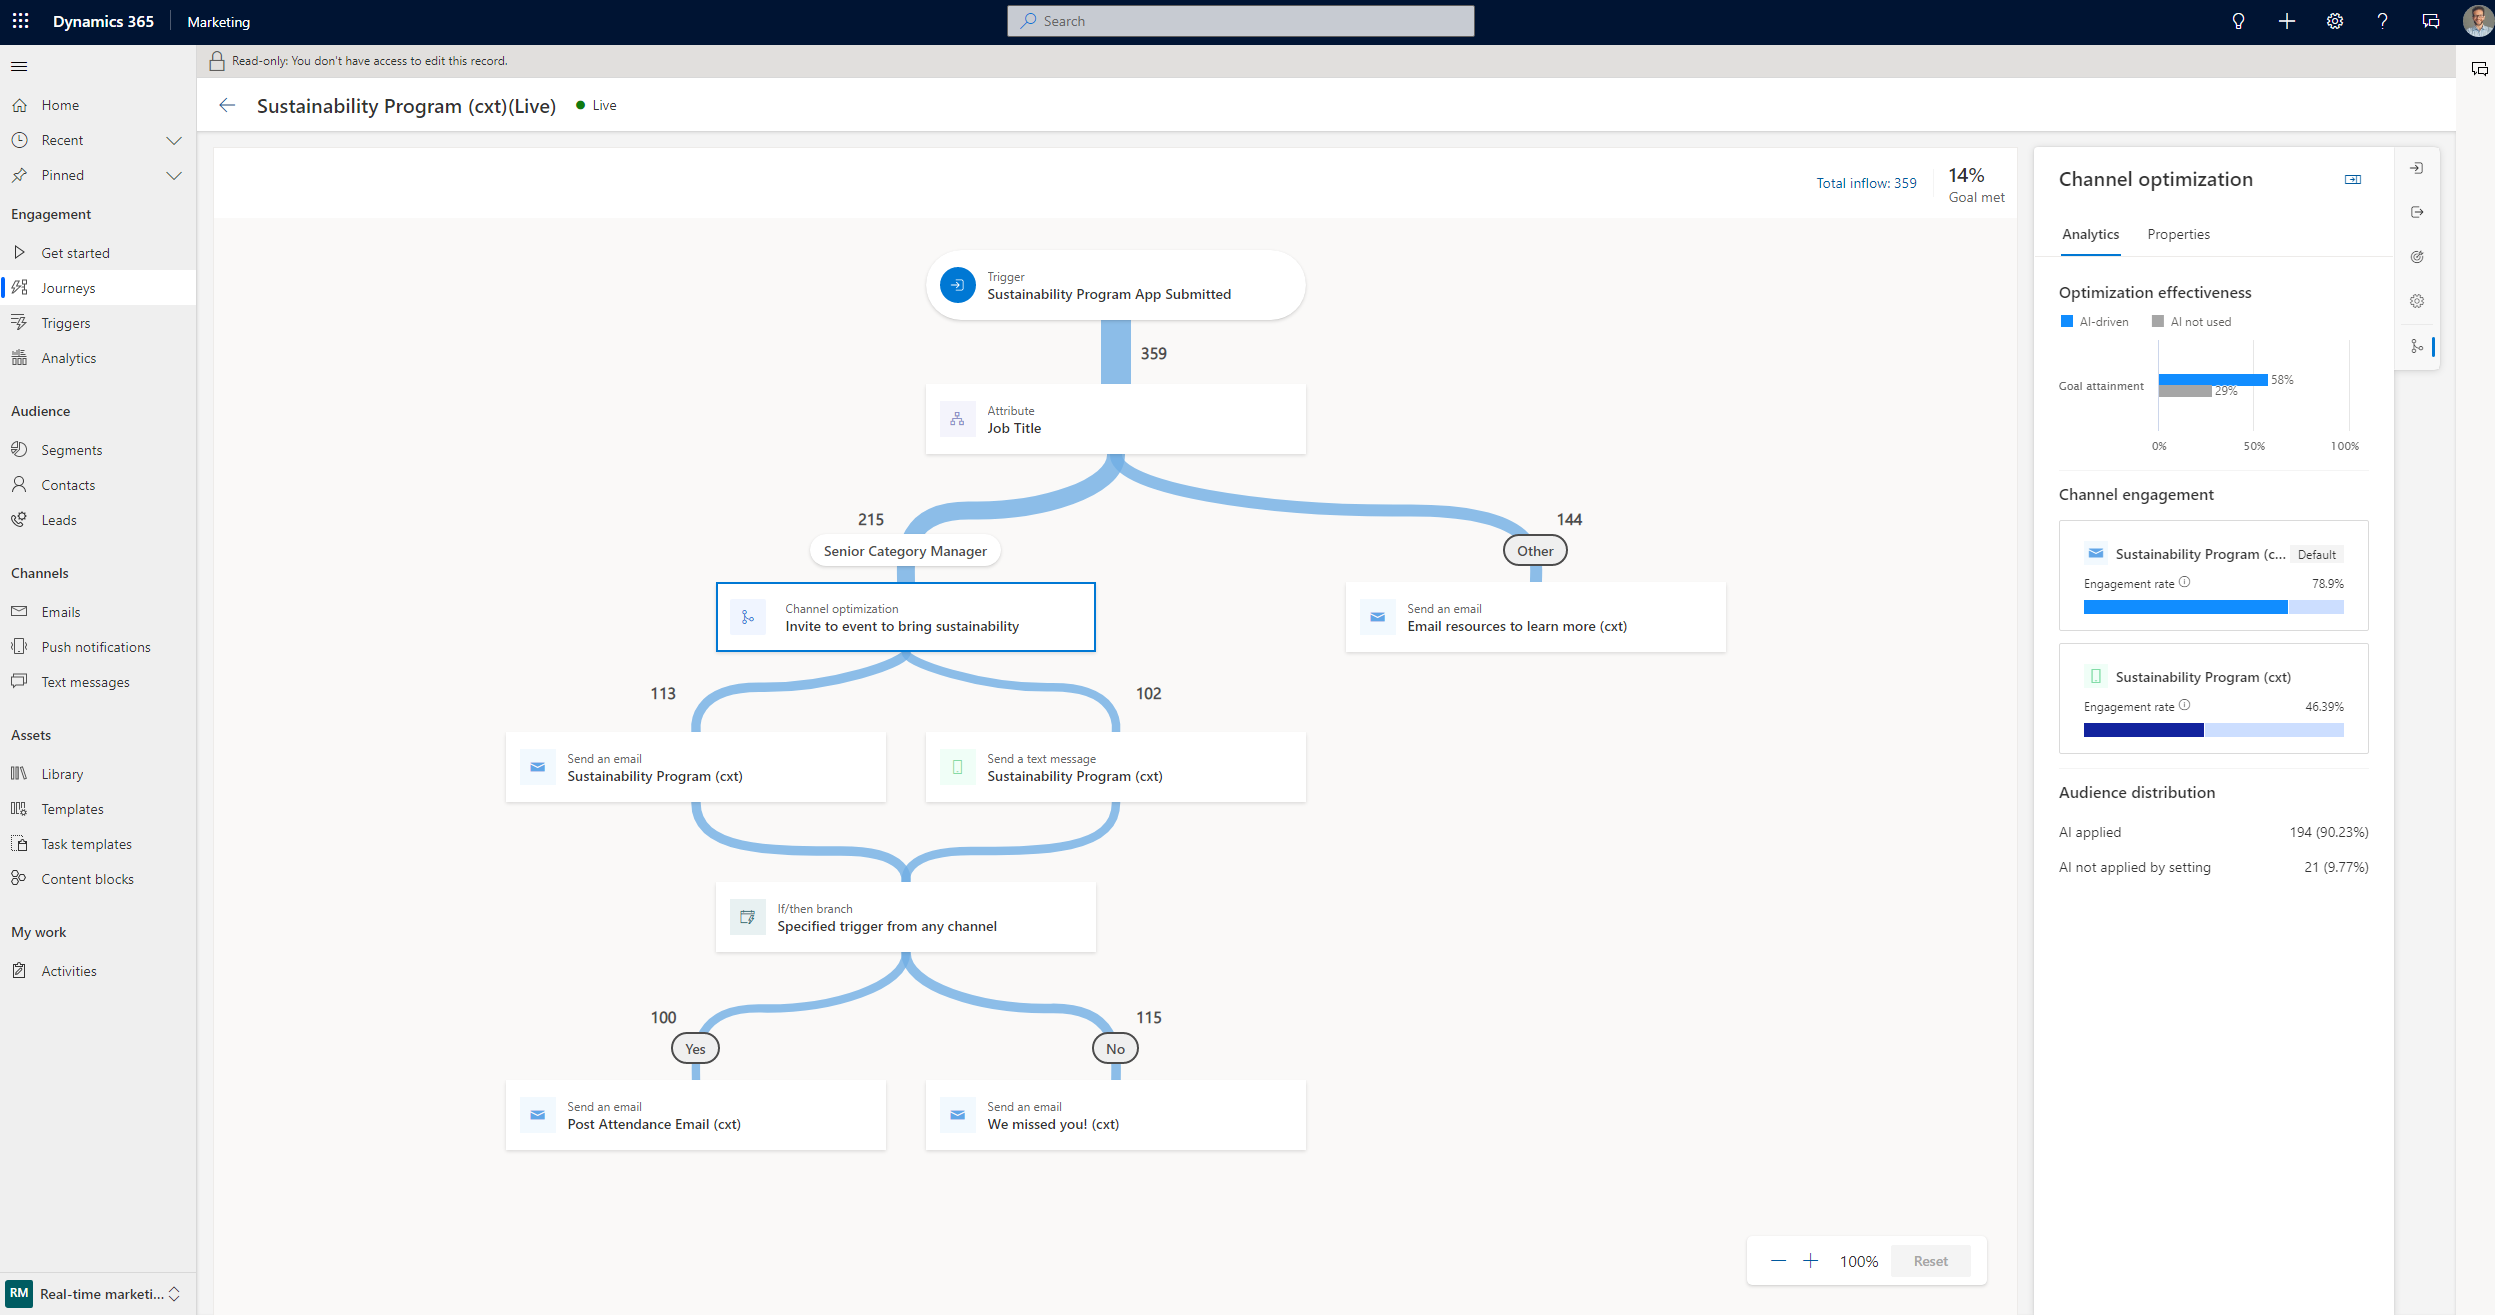
Journey operational analytics
Evaluate journey performance in near real-time using built-in operational analytics. The Sankey view in the designer helps you understand the user flow through the journey, highlighting which branches are working well.
Select any journey component to view near real-time operational analytics in the right pane, including:
Goal analytics: If a goal has been defined as a target set, you can view how the journey is progressing toward its goal and if it has met the goal.
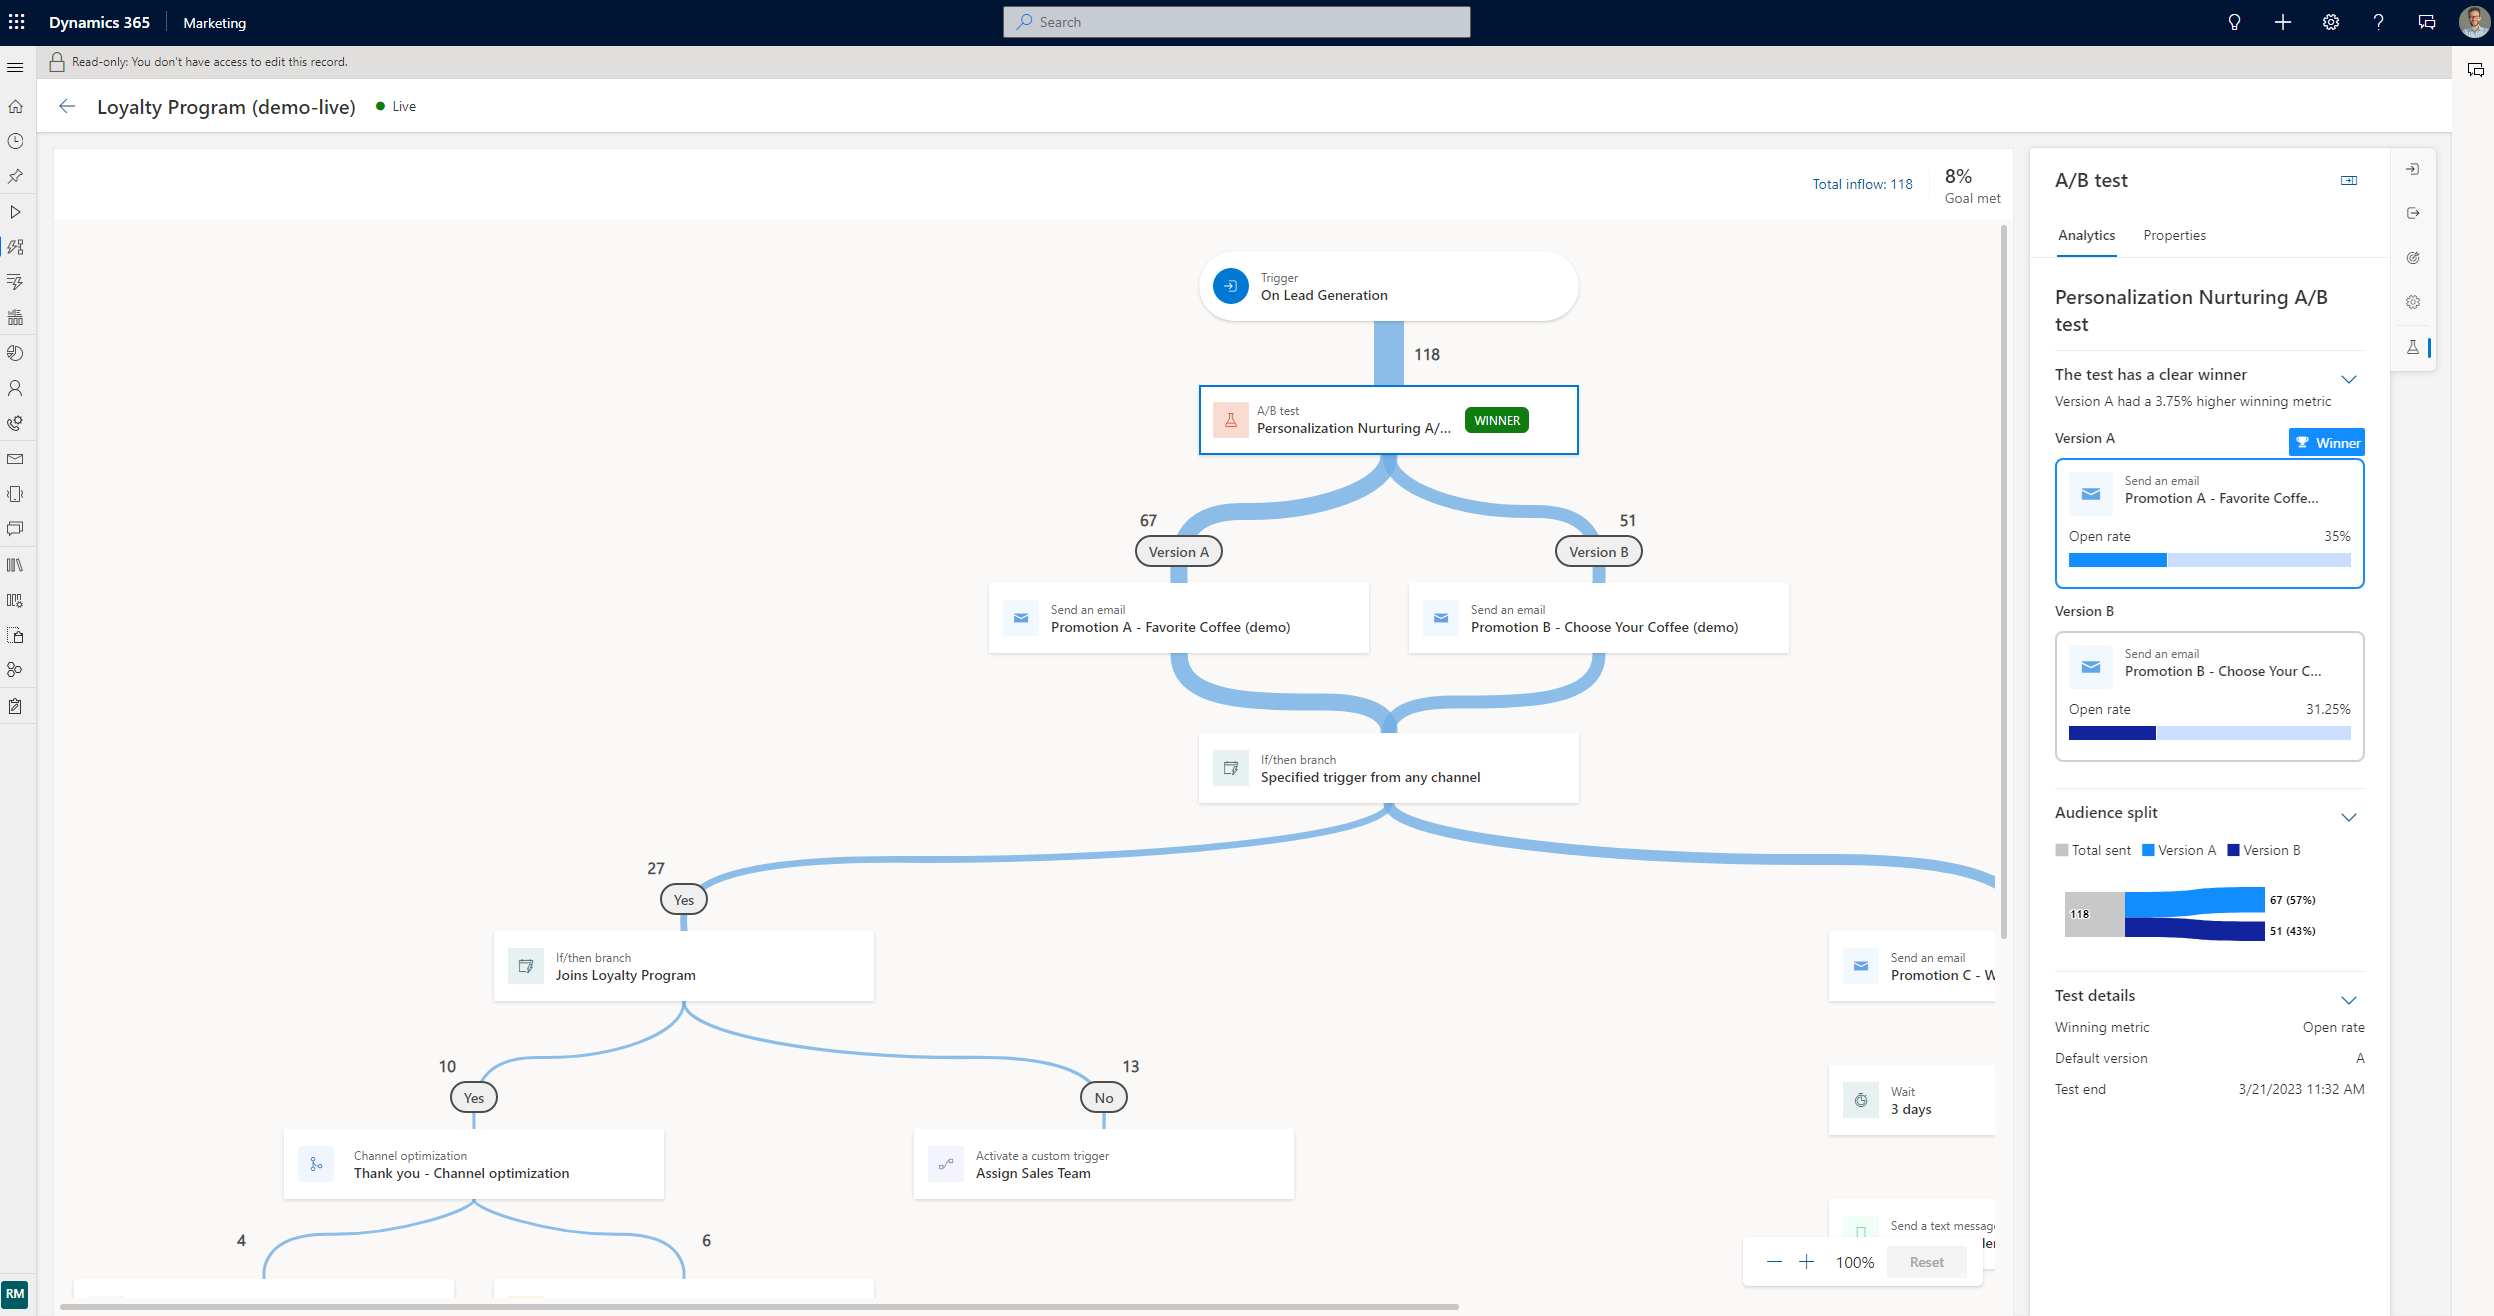
Channel analytics: For any message in the journey (email, text, or push notification), view the delivery funnel and additional metrics to diagnose the content performance.
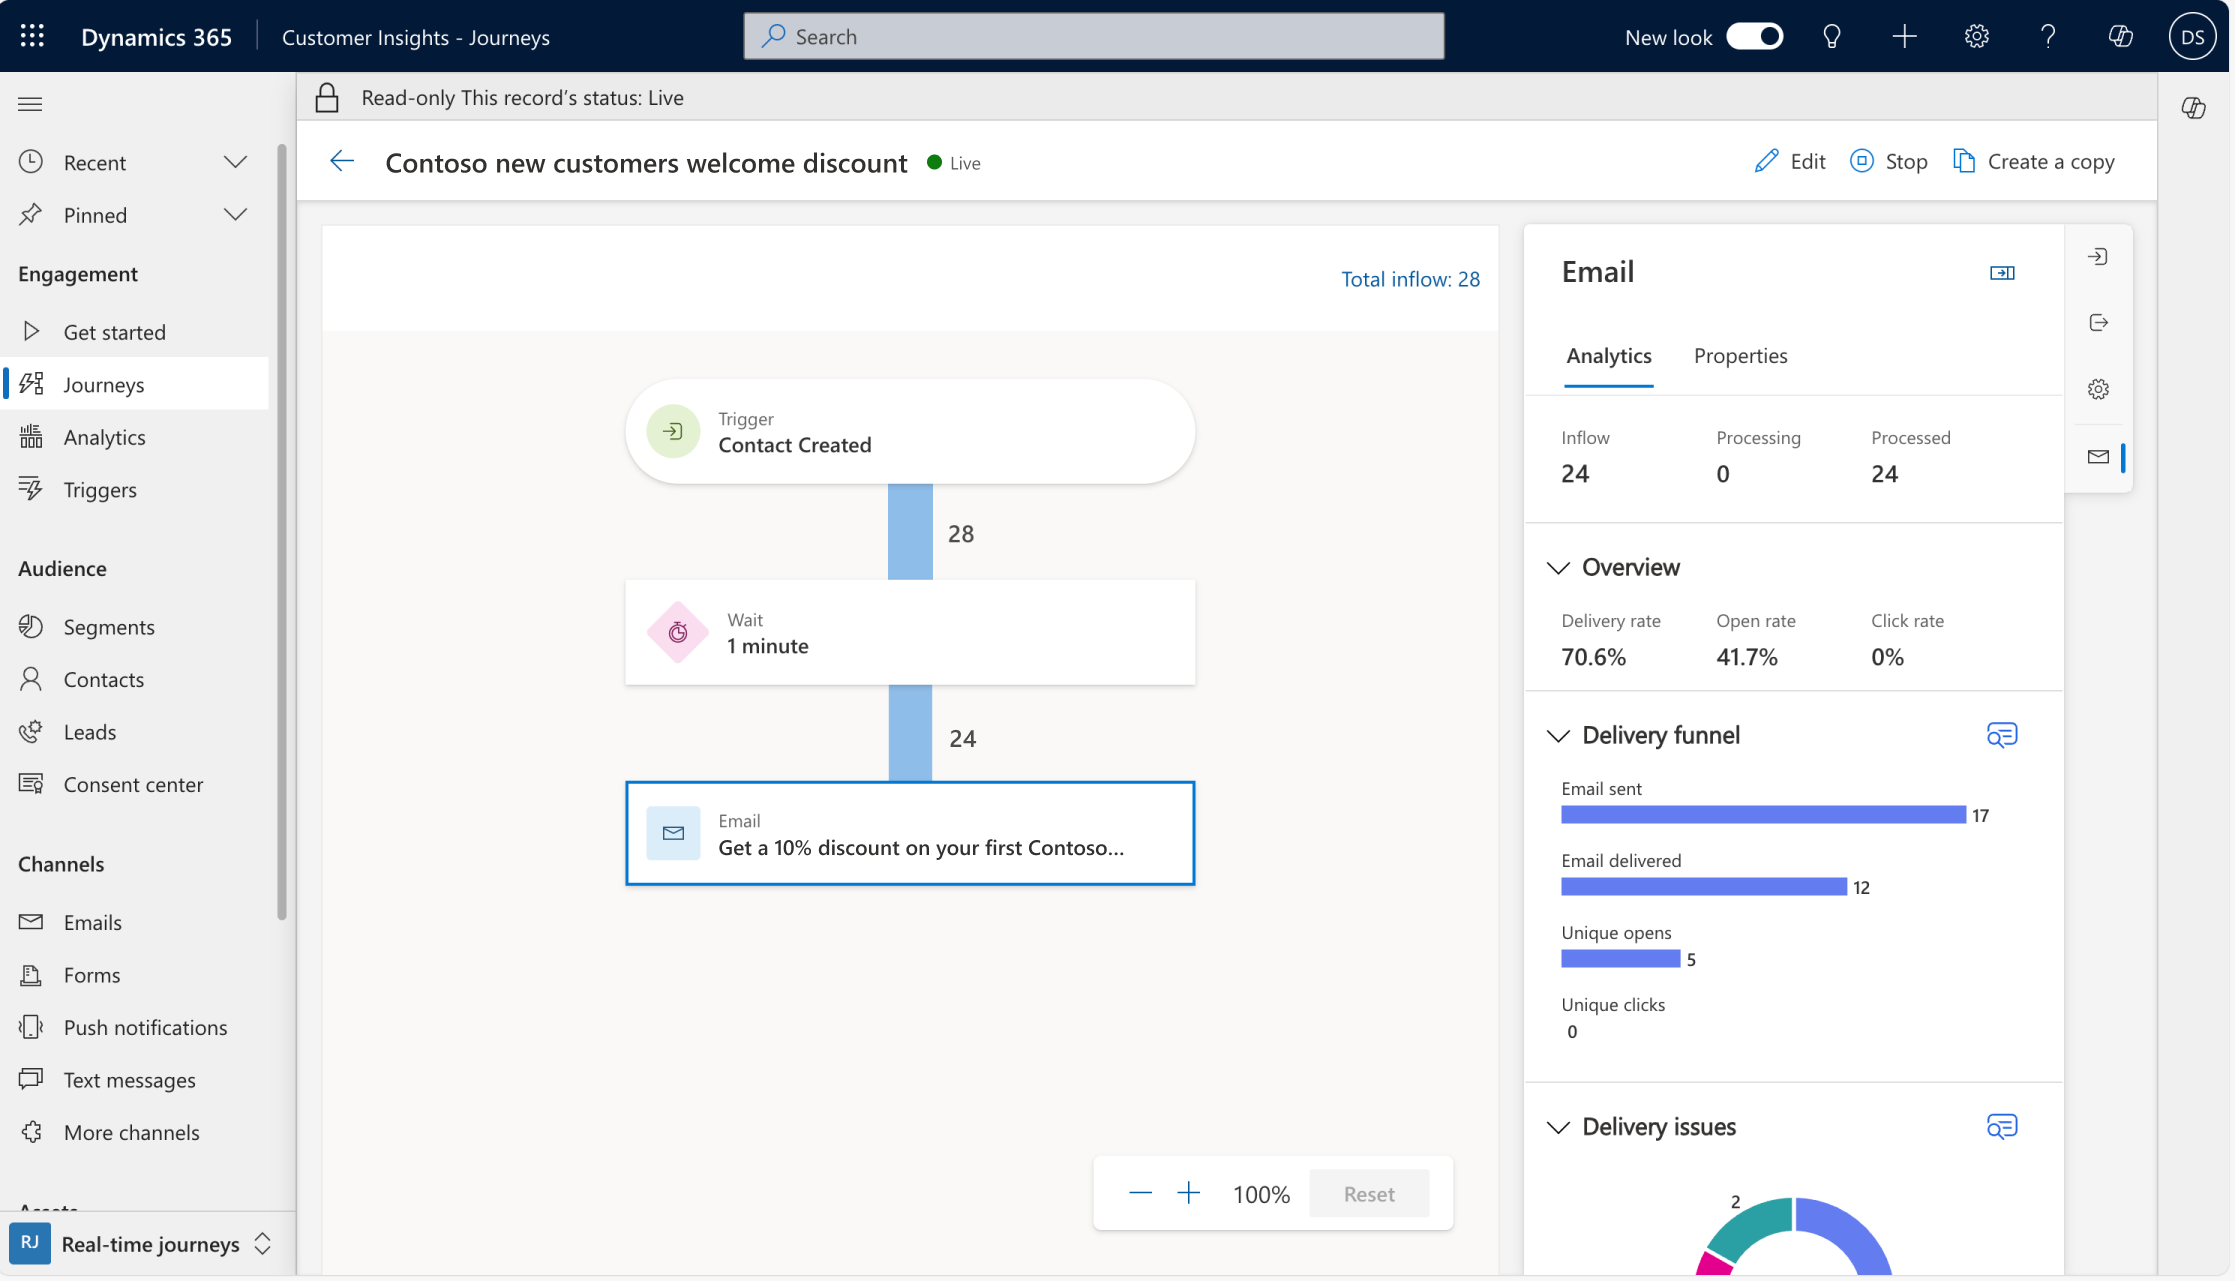
In the Overview section, you can monitor key performance indicators per channel message such as:
- Delivery rate: The percentage of email, text, or custom channel messages delivered divided by the number of email, text, or custom channel messages sent.
- Open rate: The percentage of unique email or push notification opens divided by the number of emails or push notifications delivered.
- Click rate: The percentage of unique email, text, or push notification/custom channel clicks divided by the number of email, text, or push notification/custom channel links delivered.
- Response rate: The percentage of unique text message responses divided by the number of text messages sent.
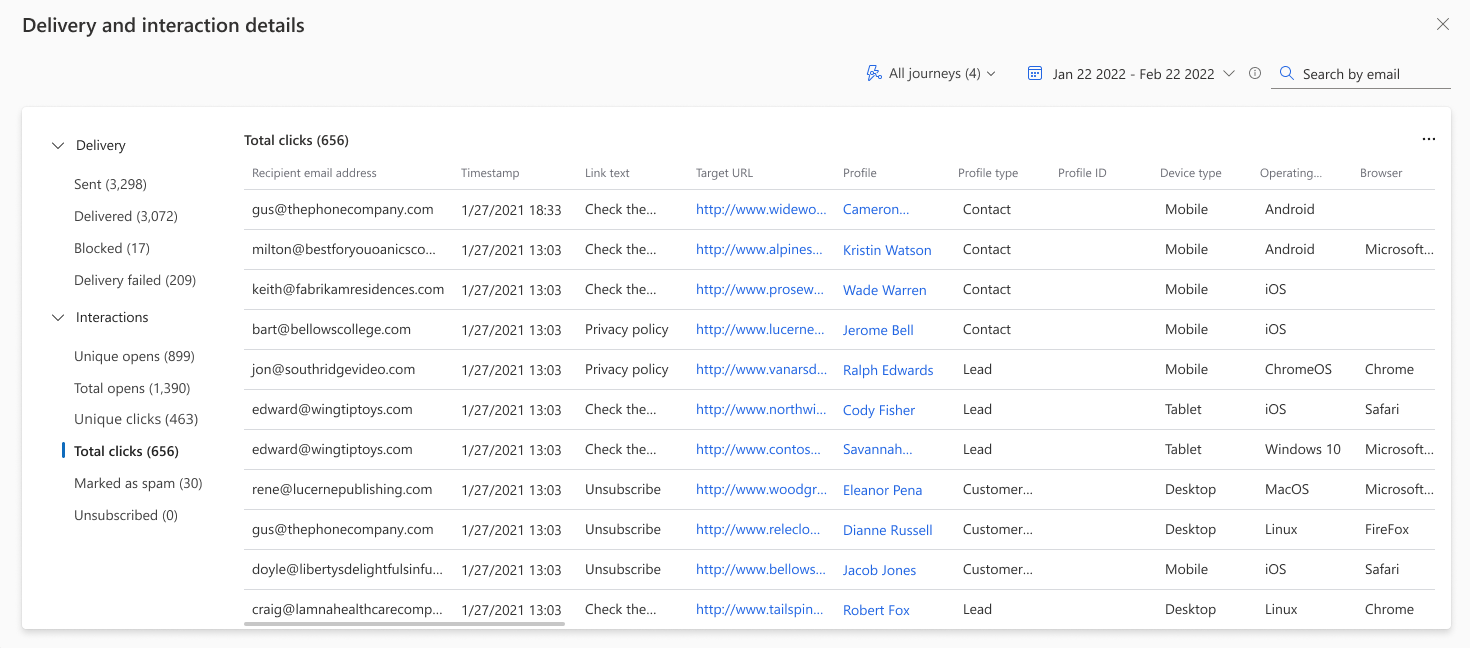
To view delivery and interaction statistics, select the View details link in the Delivery funnel or Delivery issues section on the channel analytics pane. Delivery and interaction details allow you to analyze delivery, engagement, and performance data for your email, text, push notification, or custom channel messages. Timestamps are reported according to the organization's time zone. In this area, you can:
- View deliverability details on messages sent, delivered, blocked, or bounced along with the respective reasons, detailed data on customers who opened or clicked a message, as well as unsubscription interaction data. A message’s unique opens and clicks are calculated based on the customer's journey run. This means that if the same customer enters the same journey multiple times and opens or clicks the same message each time, the system records multiple unique opens or clicks. For example, if a customer clicks the same message in two different journey executions, two unique clicks are recorded.
- For emails, delivery and interactions statistics include data on user agents your customers are using to engage with your emails. Under total opens you can see data about email clients and under total clicks you can find data on types of devices, operating systems, and browsers.
- Use the search option in the top right to search for interactions by email address.
- Access links to audience profiles that interacted with your messages.
- Export up to 50,000 records by selecting the export icon under the search bar.
AI optimization: Near real-time data to help you evaluate how applying AI optimization has helped your engagement rate.


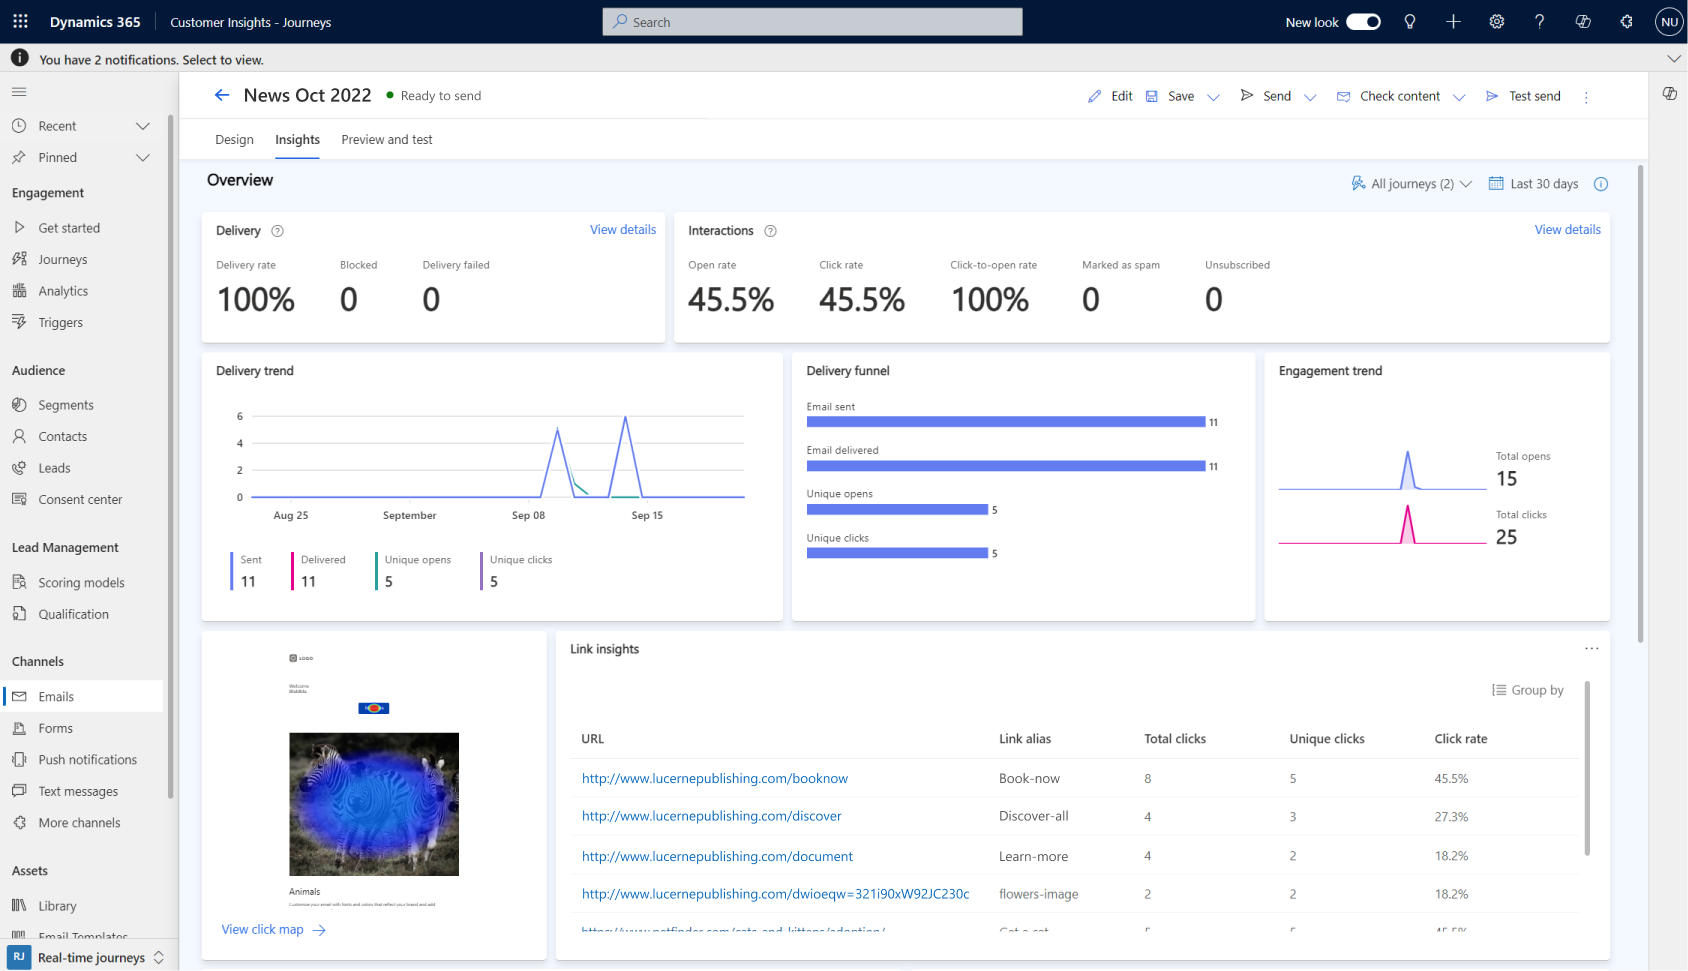
Email insights
Email insights provide a deep dive into how your audience interacts with your emails over time and track the trajectory of delivery rates, open rates, and click-through rates with precision. Beyond delivery and engagement trends, you can evaluate essential email KPIs and access comprehensive delivery and interaction details. To view email insights, go to Real-time journeys > Email > Insights tab.
The following insights categories are provided:
Delivery KPIs: Gain insights into the delivery rate, number of blocks, and delivery failures for the selected message.
Engagement KPIs: Evaluate the open rate, click rate, click-to-open rate, number of messages marked as spam, and the count of unsubscriptions related to the selected message.
Delivery trend and Delivery funnel: Explore the trends and funnel of emails sent and delivered interactions, along with unique opens and unique clicks specific to the selected email.
Engagement trend: Examine the trends for total opens and clicks, providing a comprehensive understanding of the level of engagement associated with the selected email.
Device type and user agents' analysis: Gain a deeper understanding of the various device types, email clients, operating systems, and browsers that customers utilize to engage with your emails.
Note
The data related to user agents may be partial or missing depending on when your journey was running, especially if it was active before August 2024.
The detection of email clients relies on email opens and is dependent on the response received from the email provider. Certain email clients, like Apple, have privacy protections in place that may prevent detection.
The detection of device types, browsers, and operating systems is dependent on email clicks.
Not all email clients, device types, browsers, and operating systems can be detected. They are labelled as “Unknown” when the user agent used by the customer could not be detected. They are labelled as “Other” when the user agent used by the customer can be detected but is non-categorized such as a local provider.
Variation insights: Gain valuable insights into key metrics such as unique opens, unique clicks, number of delivered messages, open rate, click rate, spam messages, and unsubscriptions for each variant, enabling you to identify what resonates best with your audience. Variation insights are visible only if the email contains conditional content.

Note
Data retention is 12 months for contact insights, lead insights, goal analytics, channel analytics (including email insights and delivery and interaction details), and AI optimization analytics.
Aggregate cross-journey analytics
The built-in aggregate cross-journey analytics dashboard shows relevant metrics and insights for all your journey orchestrations in one place.

Use the aggregate cross-journey analytics dashboard to review recent journey effectiveness and quickly share reports with stakeholders.
Learn more: How to use aggregate cross-journey analytics.
Aggregate channel analytics
The aggregate channel analytics dashboard shows metrics and insights related to delivery and engagement.

Use the aggregate channel analytics dashboard to measure campaign effectiveness and track the performance of your marketing assets.
Learn more: How to use aggregate channel analytics.
Note
There is no data retention policy for Customer Insights - Journeys interactions in aggregate cross-journey analytics and aggregate channel analytics. Dataverse entities are limited to a two-year retention policy after their initial creation date. Keep in mind that the two-year Dataverse entity retention policy might impact analytics views associated with interaction data from Dataverse entities. The aggregate cross-journey analytics, channel analytics, and marketing effectiveness analytics dashboards are not supported on mobile devices.
Marketing effectiveness analytics
The marketing effectiveness analytics dashboard enables you to set up key milestones in your buyer’s journey and analyze how your Customer Insights - Journeys activities are contributing to driving customers to those milestones. The dashboard uses AI-powered multi-touch and single-touch attribution models.

Learn more: Preview: Marketing effectiveness analytics
Learn more
Here are some advanced resources for this topic: