Note
Access to this page requires authorization. You can try signing in or changing directories.
Access to this page requires authorization. You can try changing directories.
Supervisors and managers can use the Case historical analytics dashboard to review case demand, response performance, resolution quality, Ageing, and customer satisfaction. Compare queues, identify delays, investigate exceptions, and review the cases behind a metric.
Use the dashboard to:
- Monitor case volume and outcomes.
- Compare case demand by queue, origin, priority, status, product, and business unit.
- Review first-response completion separately from service-level agreement (SLA) attainment.
- Distinguish resolutions from cancellations.
- Investigate reopened, reassigned, waiting, unassigned, and stale cases.
- Compare elapsed resolution time with active working time where effort data is available.
- Interpret customer satisfaction (CSAT) alongside the contributing response counts.
Prerequisites
- Customer Service historical analytics with enriched data is enabled.
Navigation
In Copilot Service workspace, select Case historical analytics from the menu.
Dashboard actions
Use the following actions in the dashboard:
| Action | How to use it |
|---|---|
| Change tabs | Select a dashboard tab in the header. |
| Apply a filter | Select a filter, and then choose the values to include. |
| Change the time zone | Select the time-zone control in the header. |
| Review a KPI trend | Use the trend indicator or sparkline to compare a KPI with the prior period or its recent trend. |
| Inspect a chart value | When tooltips are enabled, point to a chart data point to review its value. |
| Open hourly case volume | On the Agent or Queue tab, select a representative or queue row. |
| Open case details | Select a supported case number or data point. |
| Search metric definitions | Enter a metric, category, or source in the metric catalog. |
| Filter metric definitions | Select a category in the metric catalog. |
| Export case details | On the Case details page, select Export. |
| Return to the previous view | Select Back or Report, depending on the view. |
Understand dates and case counts
The report counts cases based on when each activity occurs:
- New cases: Counted once, on the creation date.
- Closed, resolved, or canceled cases: Counted on the date of that outcome.
- Escalated cases: Counted on the escalation date.
- Active backlog: Counts active cases at the end of a period. Don't add backlog counts across periods.
For example, a case created in January and resolved in March counts as a new case in January and a resolved case in March. Reopening it doesn't count as a new case.
A case's current status doesn't tell you whether it was active at the end of an earlier period. For custom reports, note that AggCaseAnalytics groups data by case creation time, and its TotalCases measure counts assignment cycles, not unique cases. Its outcome counts use primary assignments and can differ from the dashboard's case counts.
Learn more about calculation details and which cases each metric includes in Case metrics reference.
Review dashboard tabs
| Tab | Use it to | Main visuals |
|---|---|---|
| Summary | Review overall demand, completed work, responsiveness, SLA performance, and customer feedback. | Case volume trend, status hierarchy, close and resolution duration, CSAT trend, and sentiment trend. |
| Volume & mix | Identify the sources and types of case work. Distinguish cancellation from resolution. | Volume trend and breakdowns by origin, channel, priority, status reason, product, and case type. |
| Response & SLA | Find response delays and evaluate SLA coverage and outcomes. | Response trend, SLA attainment, SLA scope and outcome, awaiting-response worklist, and breaches by queue. |
| Quality | Investigate rework, handoffs, assignment gaps, and inactivity. | Reopen trend, first and final close comparison, reassignment and transfer analysis, and quality exceptions. |
| Ageing | Separate long-running work from waits and inactivity. | Age bands, time in status reason, waiting cases, queue-by-age matrix, and oldest untouched cases. |
| Agent | Review each representative's accountability and workload without treating ownership as measured effort. | Representative scorecard, response and satisfaction comparison, first contact resolution, reopens, and hourly detail. |
| Queue | Compare queue demand, backlog, responsiveness, SLA attainment, and customer experience. | Queue scorecard, first-response comparison, SLA attainment, CSAT, and hourly detail. |
Summary tab
Use the Summary tab to review case demand, completed work, responsiveness, SLA performance, and customer feedback.
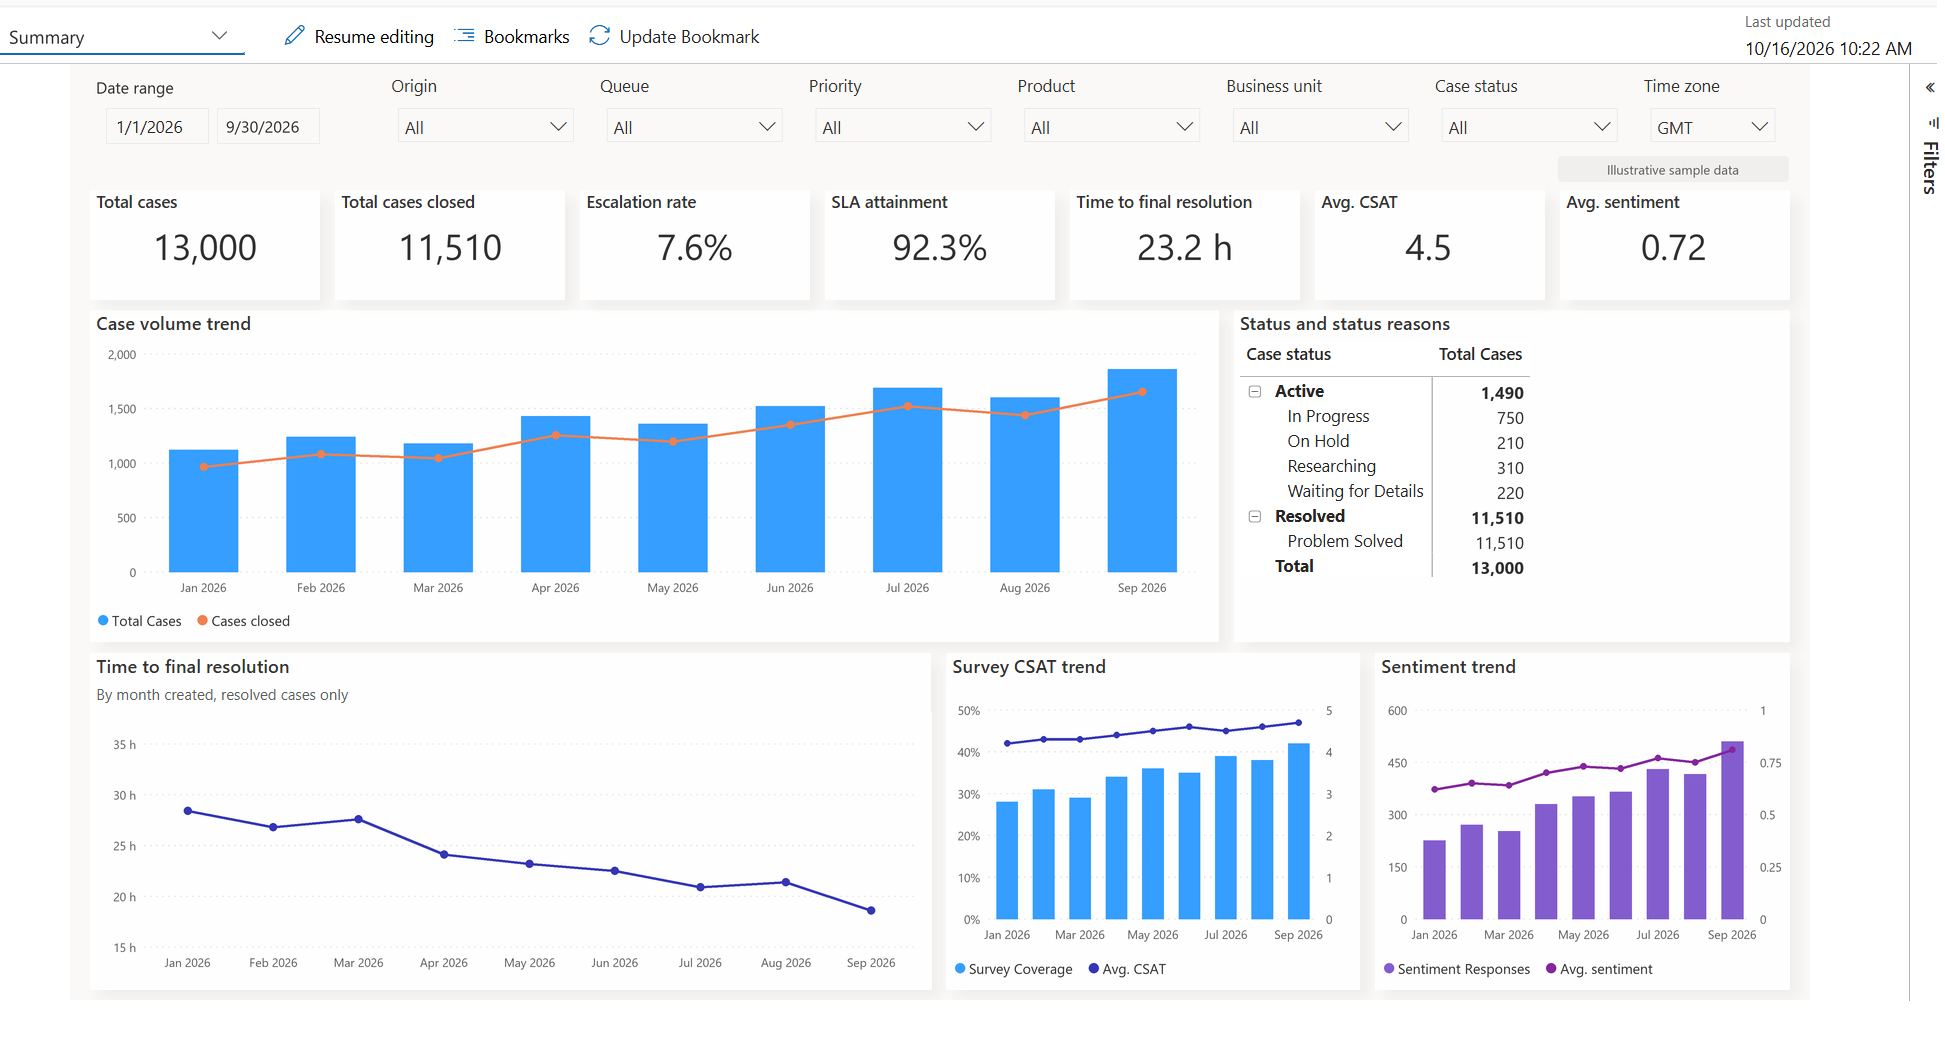
Summary KPIs
| KPI | Description |
|---|---|
| Total cases | Distinct cases created during the selected period, including cases that later reopen. |
| Total cases closed | Cases that reach a resolved or canceled state during the selected period. Review the resolved and canceled outcomes alongside the total. |
| Escalation rate | Percentage of cases escalated during the selected period. The KPI can also show the number of escalated cases. |
| SLA attainment | Percentage of eligible SLA KPI instances that meet their targets. |
| Time to resolution | Elapsed time from case creation to resolution, excluding cancellations. |
| Average CSAT | Average linked satisfaction score for the selected period, with the contributing response count. |
| Average sentiment | Average sentiment for the configured case-related source. Survey sentiment in the documented aggregate isn't the same as customer-message case sentiment. |
Summary visuals
- Case volume trend compares cases created and cases closed over time.
- Status and status reasons groups cases by status and status reason.
- Days to close and time to resolution compares elapsed time to final closure with elapsed time to the first resolved state.
- Survey CSAT trend compares average CSAT and survey response rate over time.
- Sentiment trend shows average sentiment and the number of analyzed interactions over time.
Volume & mix tab
Use the Volume & mix tab to review where cases originate and how workload is distributed.
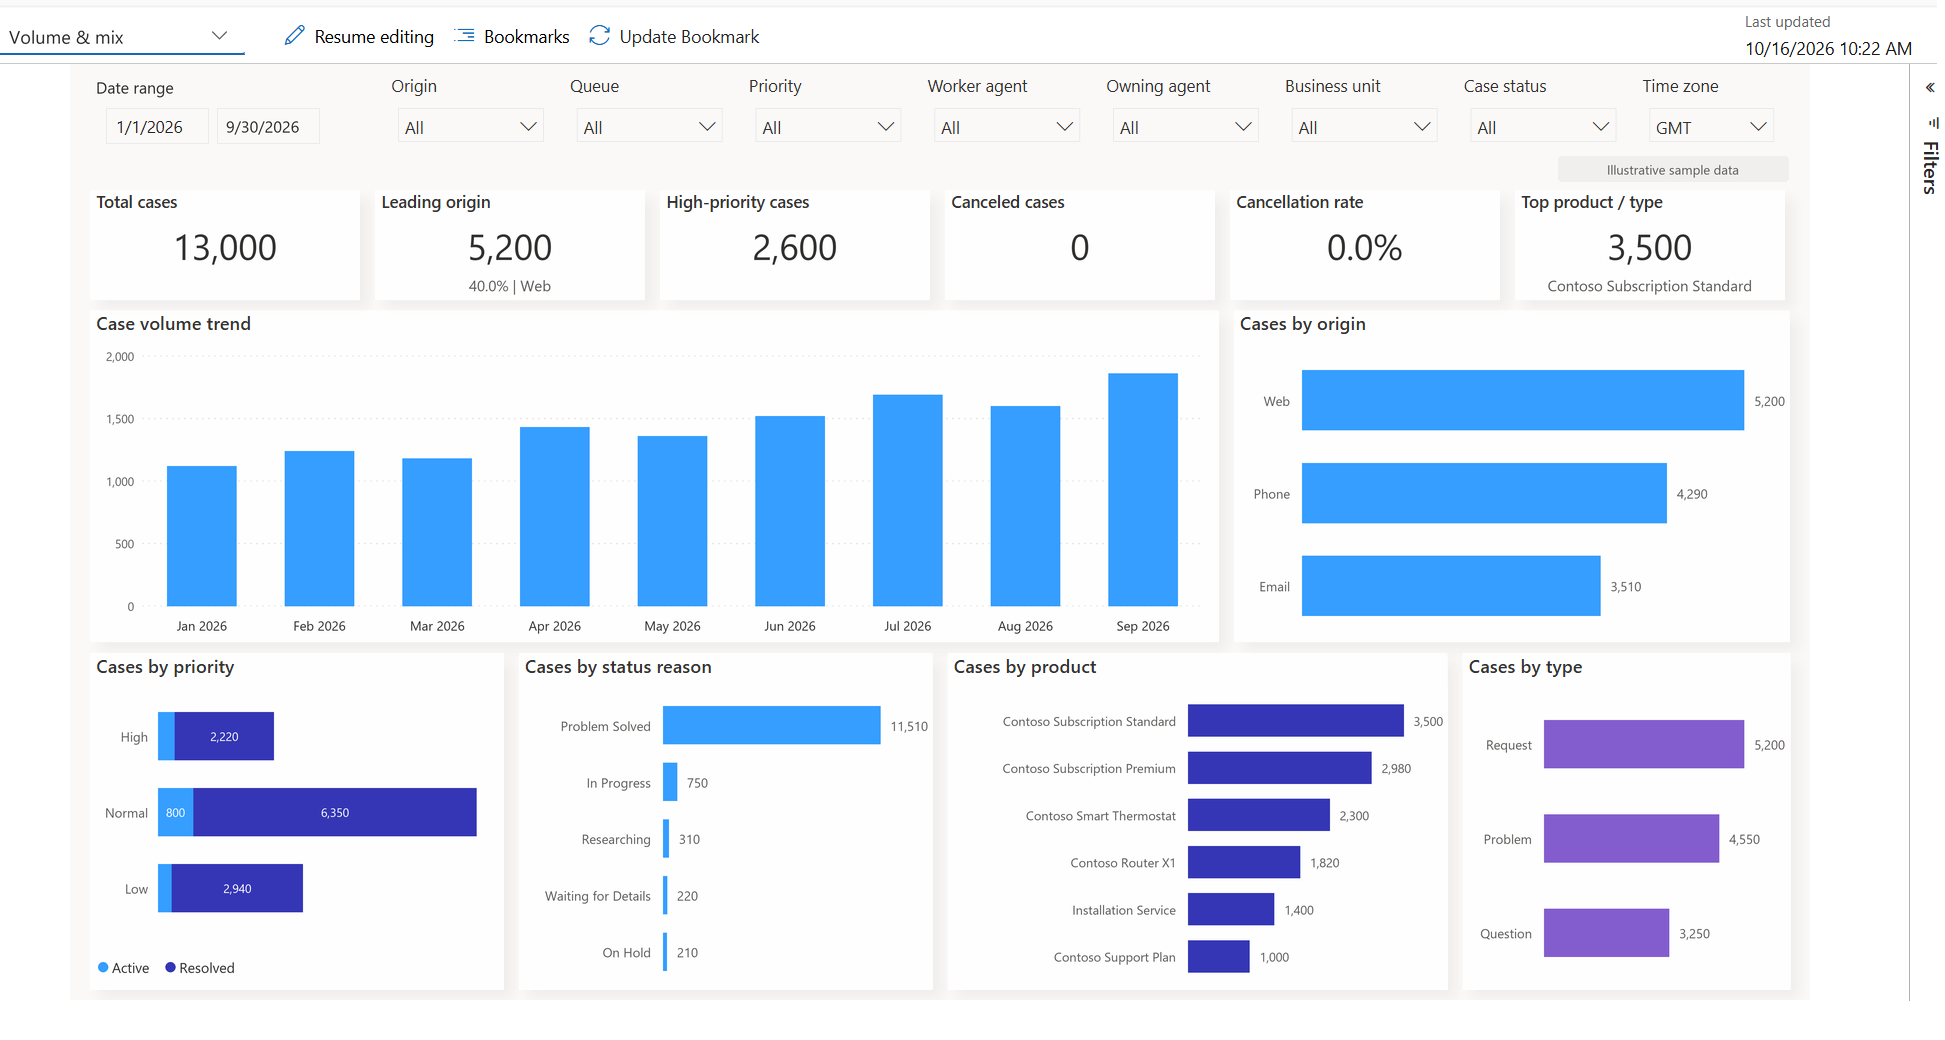
Volume and mix KPIs
| KPI | Description |
|---|---|
| Total cases | Distinct cases created during the selected period. |
| Leading origin | Case origin with the highest volume, with its case count and percentage of total volume. |
| High-priority cases | Number and percentage of cases marked as high priority. |
| Canceled cases | Number of cases canceled during the selected period. |
| Cancellation rate | Percentage of cases canceled during the selected period. |
| Top product or type | Product and case type with the highest case volume. |
Volume and mix visuals
- Case volume trend compares case volume in the current period with the prior period.
- Cases by origin compares current and prior-period volume for each case origin.
- Cases by priority shows cases by priority and status.
- Cases by status reason shows case volume for each status reason.
- Cases by product shows products associated with case demand.
- Cases by type groups cases by case type.
Response & SLA tab
Use the Response & SLA tab to monitor response performance and case outcomes against configured SLA targets.
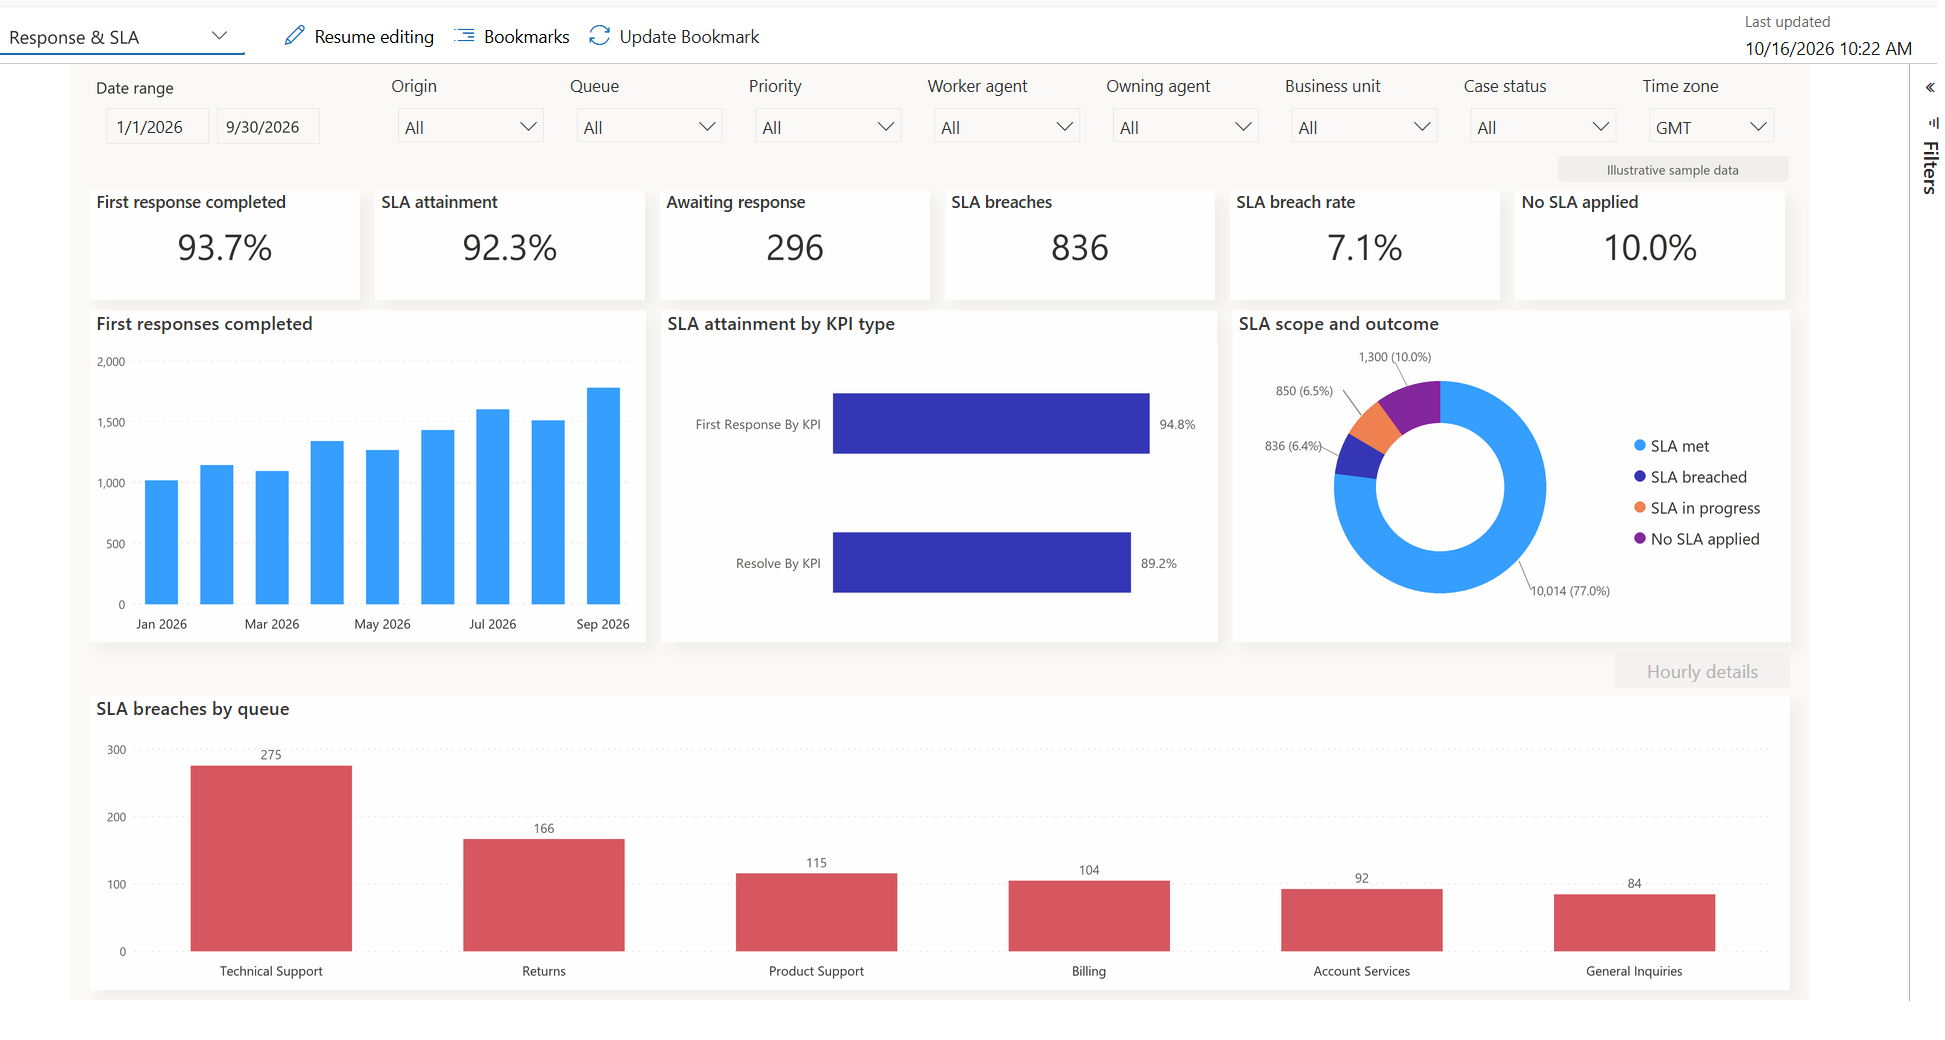
Response and SLA KPIs
| KPI | Description |
|---|---|
| First-response time completed | Percentage of cases with a first-response SLA instance that have a sent first response. |
| SLA attainment | Percentage of eligible SLA KPI instances that meet their targets. Where applicable, first-response and resolution targets are shown separately. |
| Awaiting response | Number of active cases without a first customer-facing response. The KPI can also show the age of the oldest case. |
| SLA breaches | Number of cases with at least one breached SLA KPI instance. |
| SLA breach rate | Percentage of SLA-scoped cases with at least one breach. |
| No SLA applied | The number of cases with no recorded SLA checks or only canceled checks. Missing SLA data can also cause cases to appear in this count. |
Response and SLA visuals
- First responses completed compares completed responses and average first-response time with the response target.
- SLA attainment by KPI type compares attainment for first-response, resolution, and other configured SLA KPI types.
- SLA scope and outcome groups cases by met, breached, in-progress, and out-of-scope outcomes.
- SLA breaches by queue shows queues with breached cases.
Quality tab
Use the Quality tab to investigate rework, handoffs, assignment gaps, and cases that might need attention.
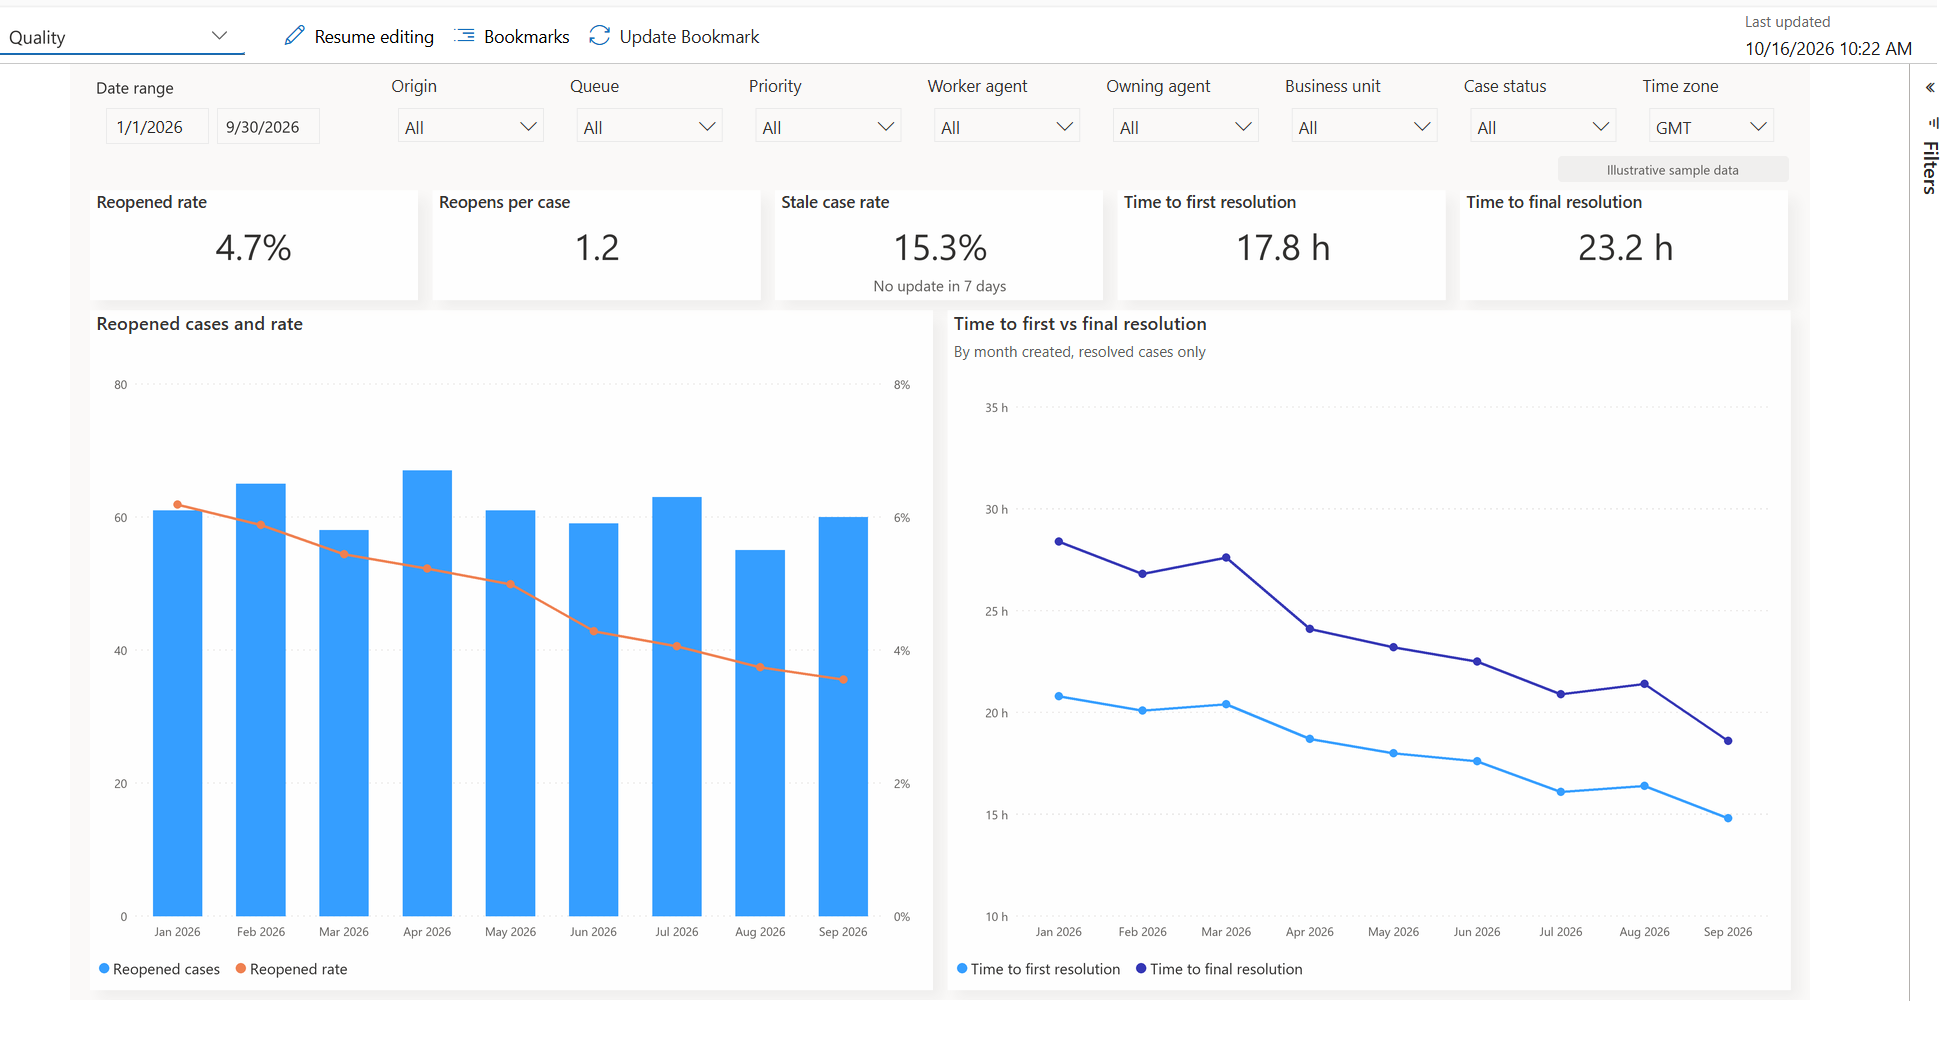
Quality KPIs
| KPI | Description |
|---|---|
| Reopened rate | Percentage of resolved cases that become active again at least once. |
| Reopens per case | Average number of resolved-to-active transitions for reopened cases. |
| Stale case rate | Percentage of active cases with no update during the defined stale period. |
| Time to first resolution | Average time from case creation to the first resolved state. |
| Time to final resolution | Average hours from case creation to its latest recorded resolution, including time spent reopened. |
Quality visuals
- Reopened cases and rate shows reopened case volume and rate against the target.
- Time to first close vs final close shows the additional elapsed time for reopened cases.
Ageing tab
Use the Ageing tab to review how many cases are active and how old they are.
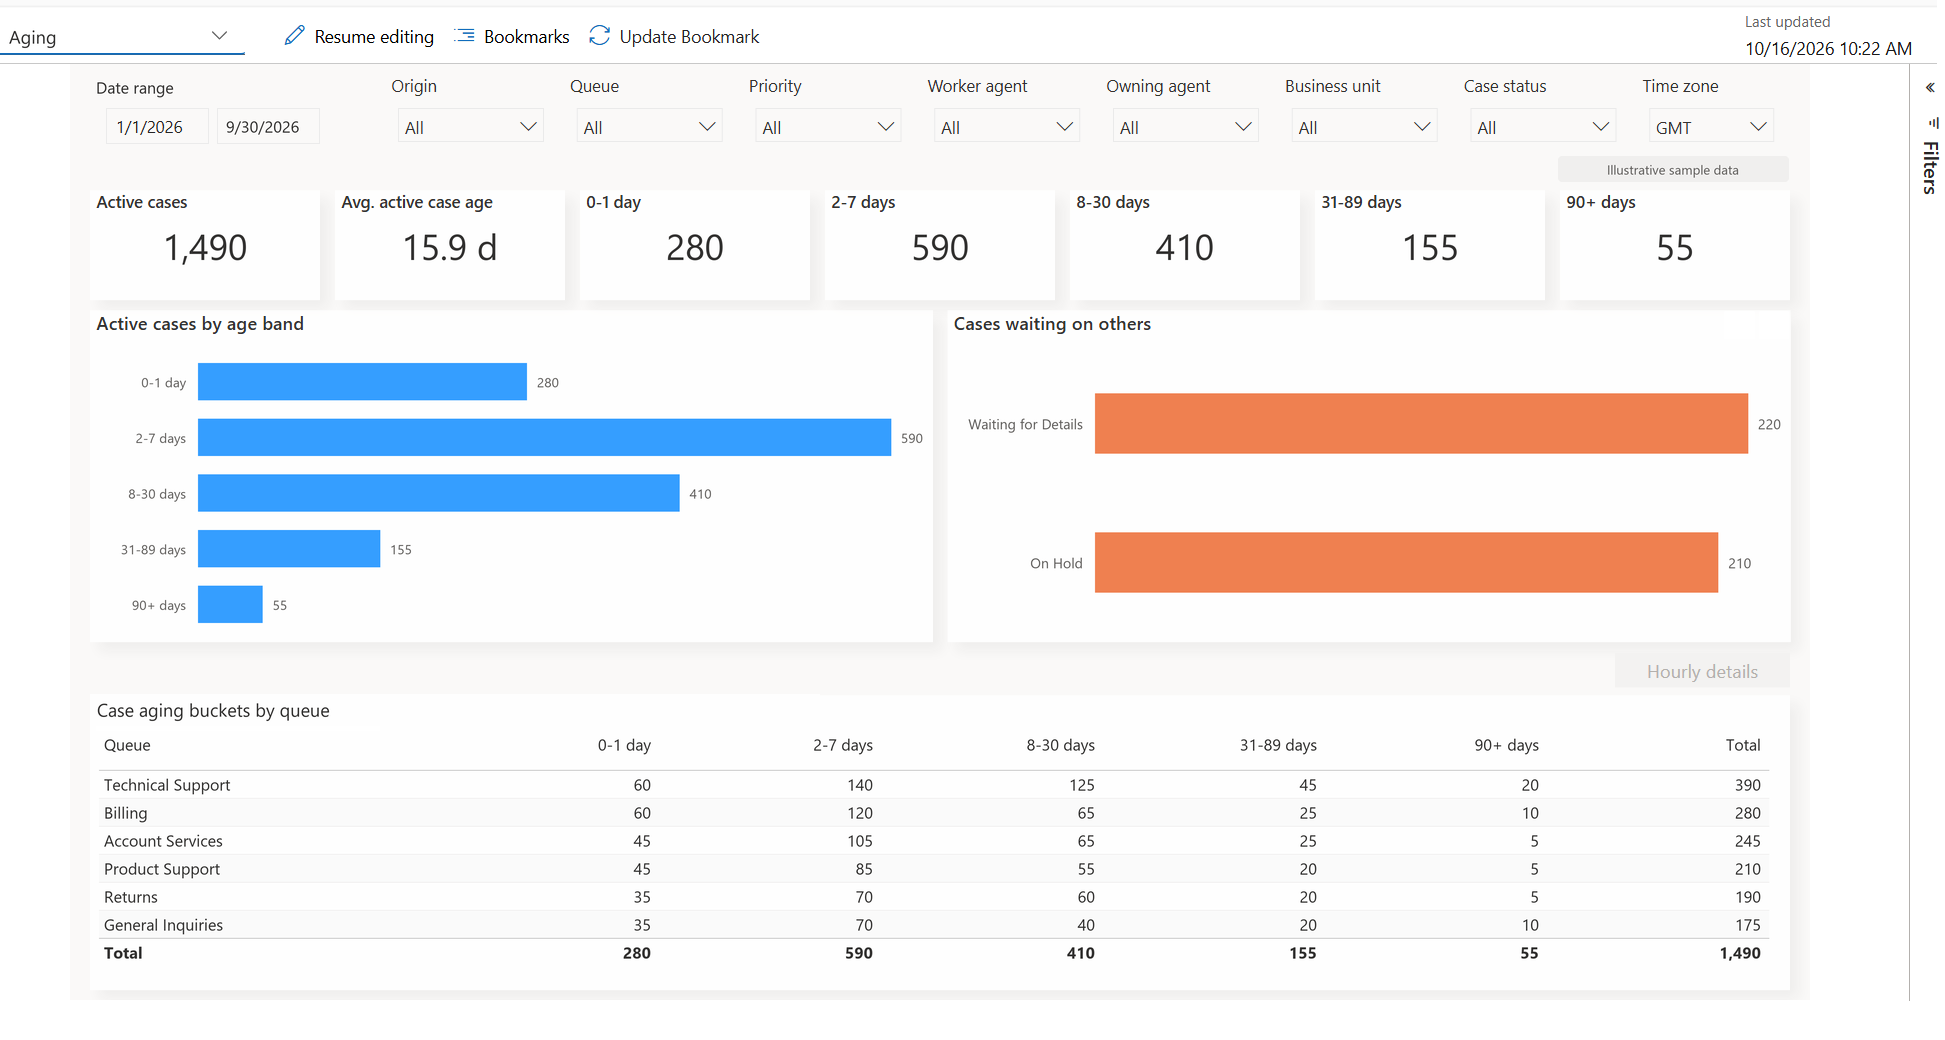
Ageing KPIs
| KPI | Description |
|---|---|
| Active cases | Number of cases active at the end of the selected period. |
| Average active case age | Average elapsed time since active cases were created. |
| 0–1 day | Number and percentage of active cases up to one day old. |
| 2–7 days | Number and percentage of active cases from two through seven days old. |
| 8–30 days | Number and percentage of active cases from eight through 30 days old. |
| 31–90 days | Number and percentage of active cases from 31 through 90 days old. |
| 90+ days | Number of active cases older than 90 days. The KPI can also show the age of the oldest case. |
Ageing visuals
- Active cases by age band shows the distribution of active backlog across age ranges.
- Cases waiting on others shows cases waiting for customers, partners, engineering teams, or vendors.
- Case ageing buckets by queue compares age bands, total backlog, and the oldest case for each queue.
Agent tab
Use the Agent tab to compare representative performance and workload.
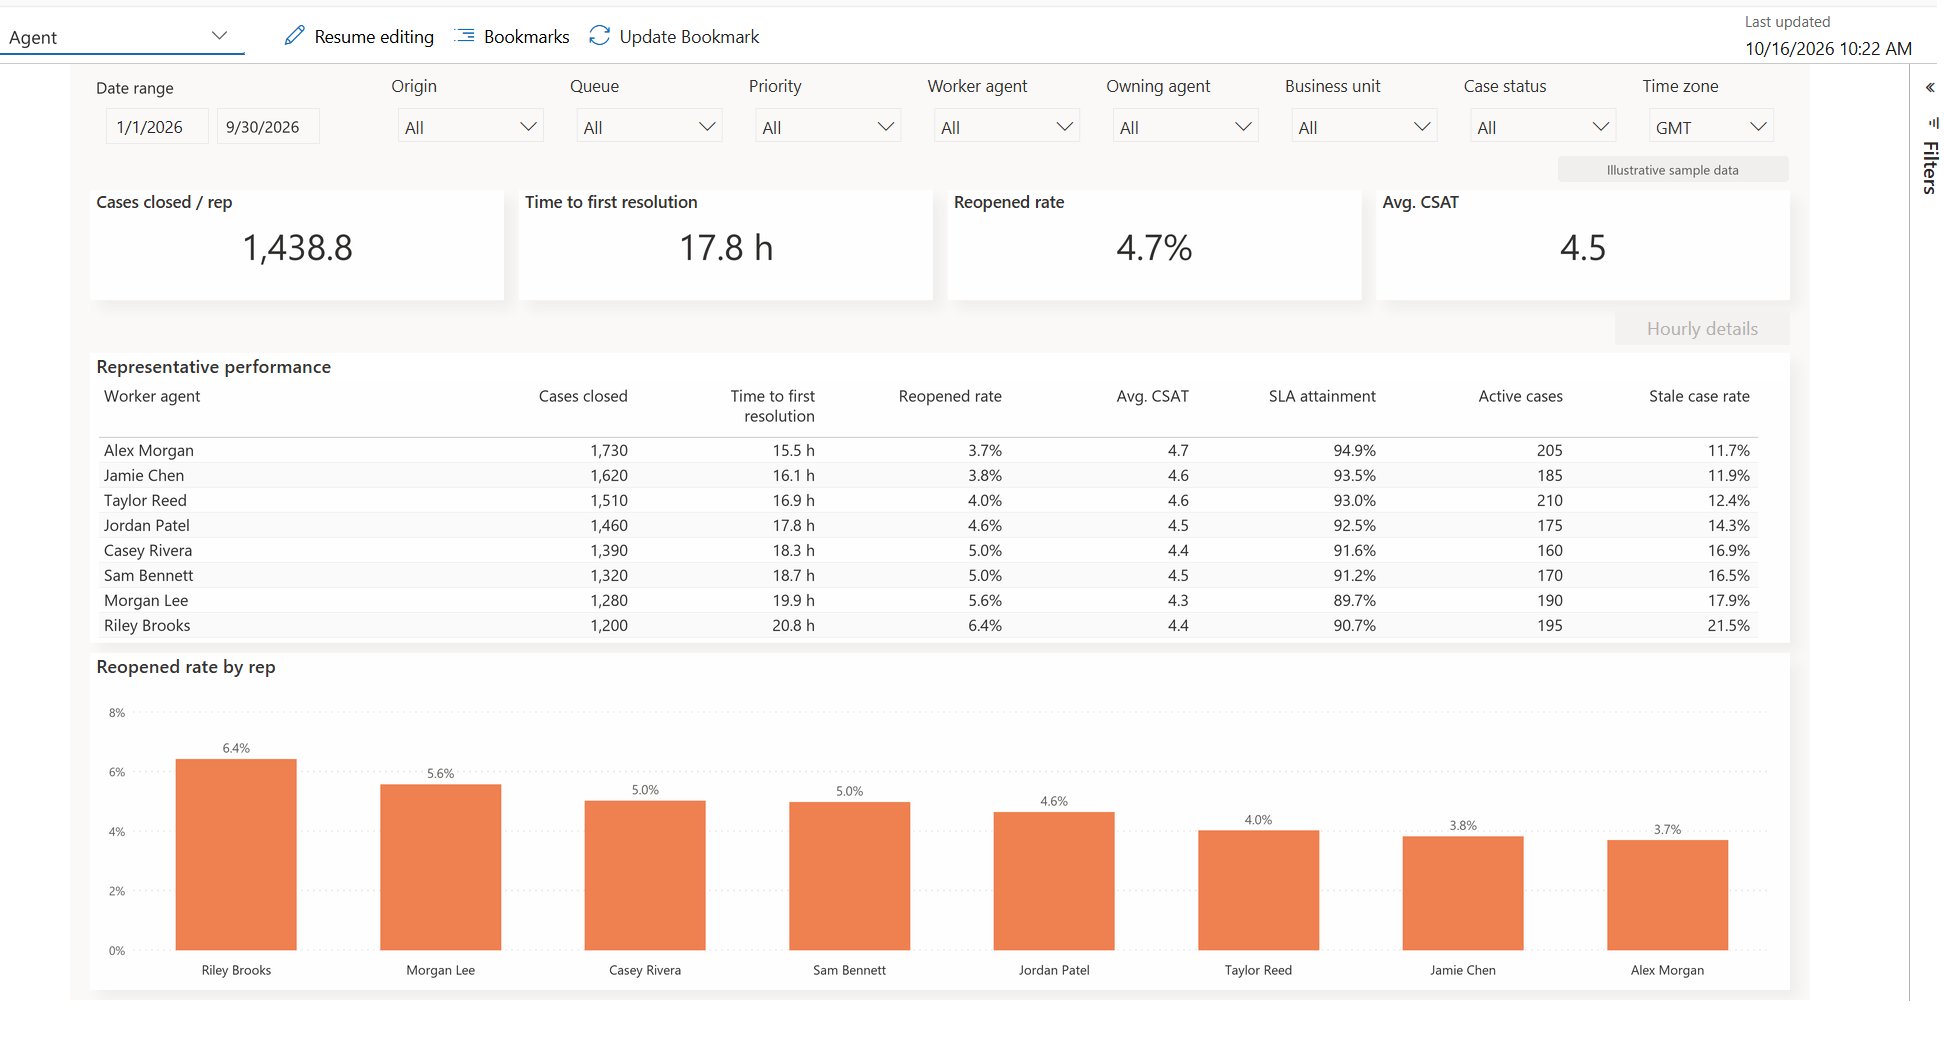
Agent KPIs
| KPI | Description |
|---|---|
| Cases closed per representative | Number of cases closed by each representative during the selected period. |
| Average time to resolve | Average time from case creation to the first resolved state. |
| Reopened rate | Percentage of resolved cases that become active again. |
| Average CSAT | Average linked customer satisfaction score for cases associated with representatives. |
Agent visuals
- Representative performance compares cases closed, first response, first contact resolution, resolution time, handle time, reopened rate, CSAT, SLA attainment, active cases, and stale cases.
- Reopened rate by representative compares each representative with the team average.
Queue tab
Use the Queue tab to compare workload and service outcomes across queues.
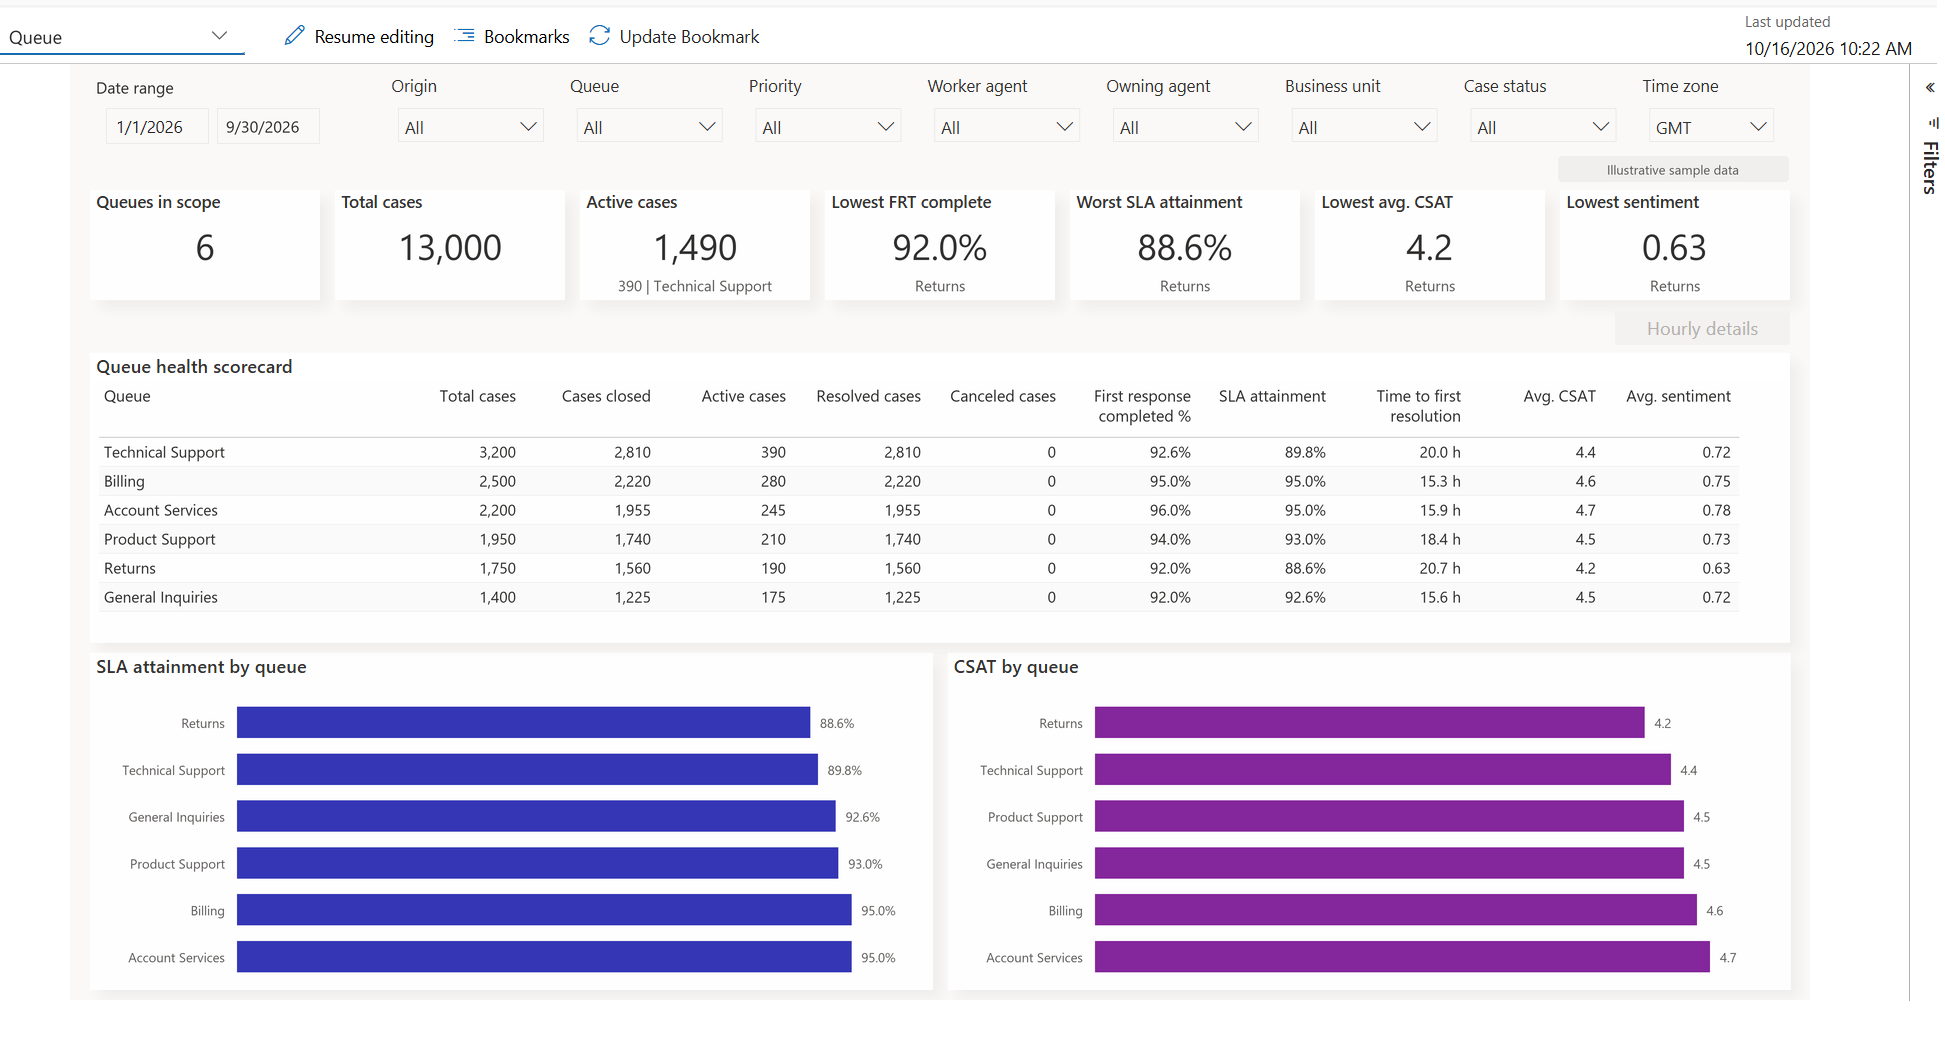
Queue KPIs
| KPI | Description |
|---|---|
| Queues in scope | Number of queues included in the current filter context. |
| Total cases | Number of distinct cases associated with the selected queues. Don't combine distinct-case measures with queue-segment volume. |
| Active cases | Number of active cases. The KPI can identify the queue with the largest active backlog. |
| Lowest first-response completion | Lowest first-response completion percentage among the selected queues. |
| Worst SLA attainment | Lowest SLA attainment percentage among the selected queues. |
| Lowest average CSAT | Lowest average customer satisfaction score among the selected queues. |
| Lowest sentiment | Lowest average sentiment among the selected queues. |
Queue visuals
- Queue health scorecard compares total, closed, active, resolved, and canceled cases; first-response performance; SLA attainment; resolution time; handle time; CSAT; and sentiment.
- SLA attainment by queue compares each queue with the SLA attainment target.
- CSAT by queue compares queue satisfaction scores with the organization average.
Review hourly case volume
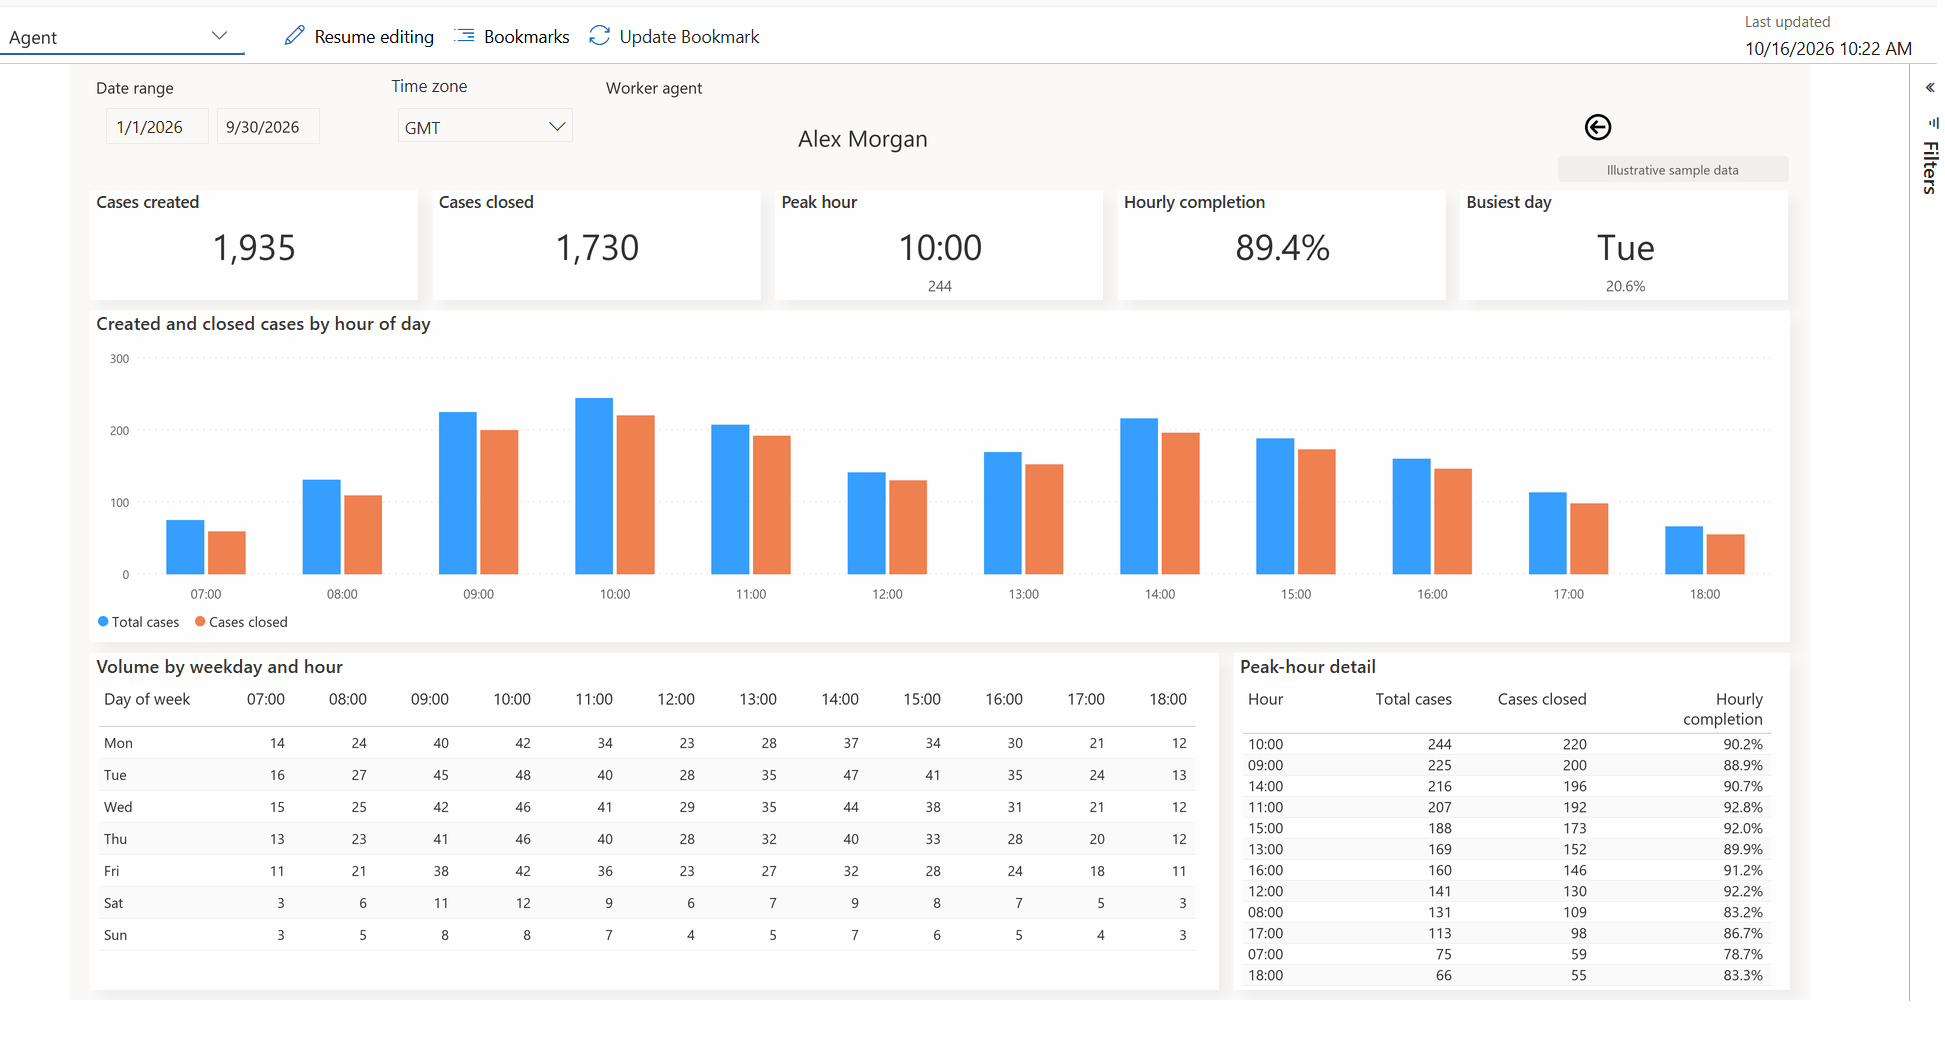
On the Agent and Queue tabs, select a representative or queue row to open the hourly case-volume view. The view groups data by hour of day across the selected date range. It doesn't necessarily show hourly history for one selected day.
Use hourly detail to compare arrival patterns with staffing coverage:
- Compare cases created and closed by hour.
- Identify the peak hour and busiest day.
- Review the hourly completion rate.
- Review average case handle time.
- Compare case volume by channel.
- Review volume concentration by weekday and hour.
- Inspect details for hours with the highest created-case volume.
The following example shows hourly case volume for a representative.
The following example shows hourly case volume for a queue.
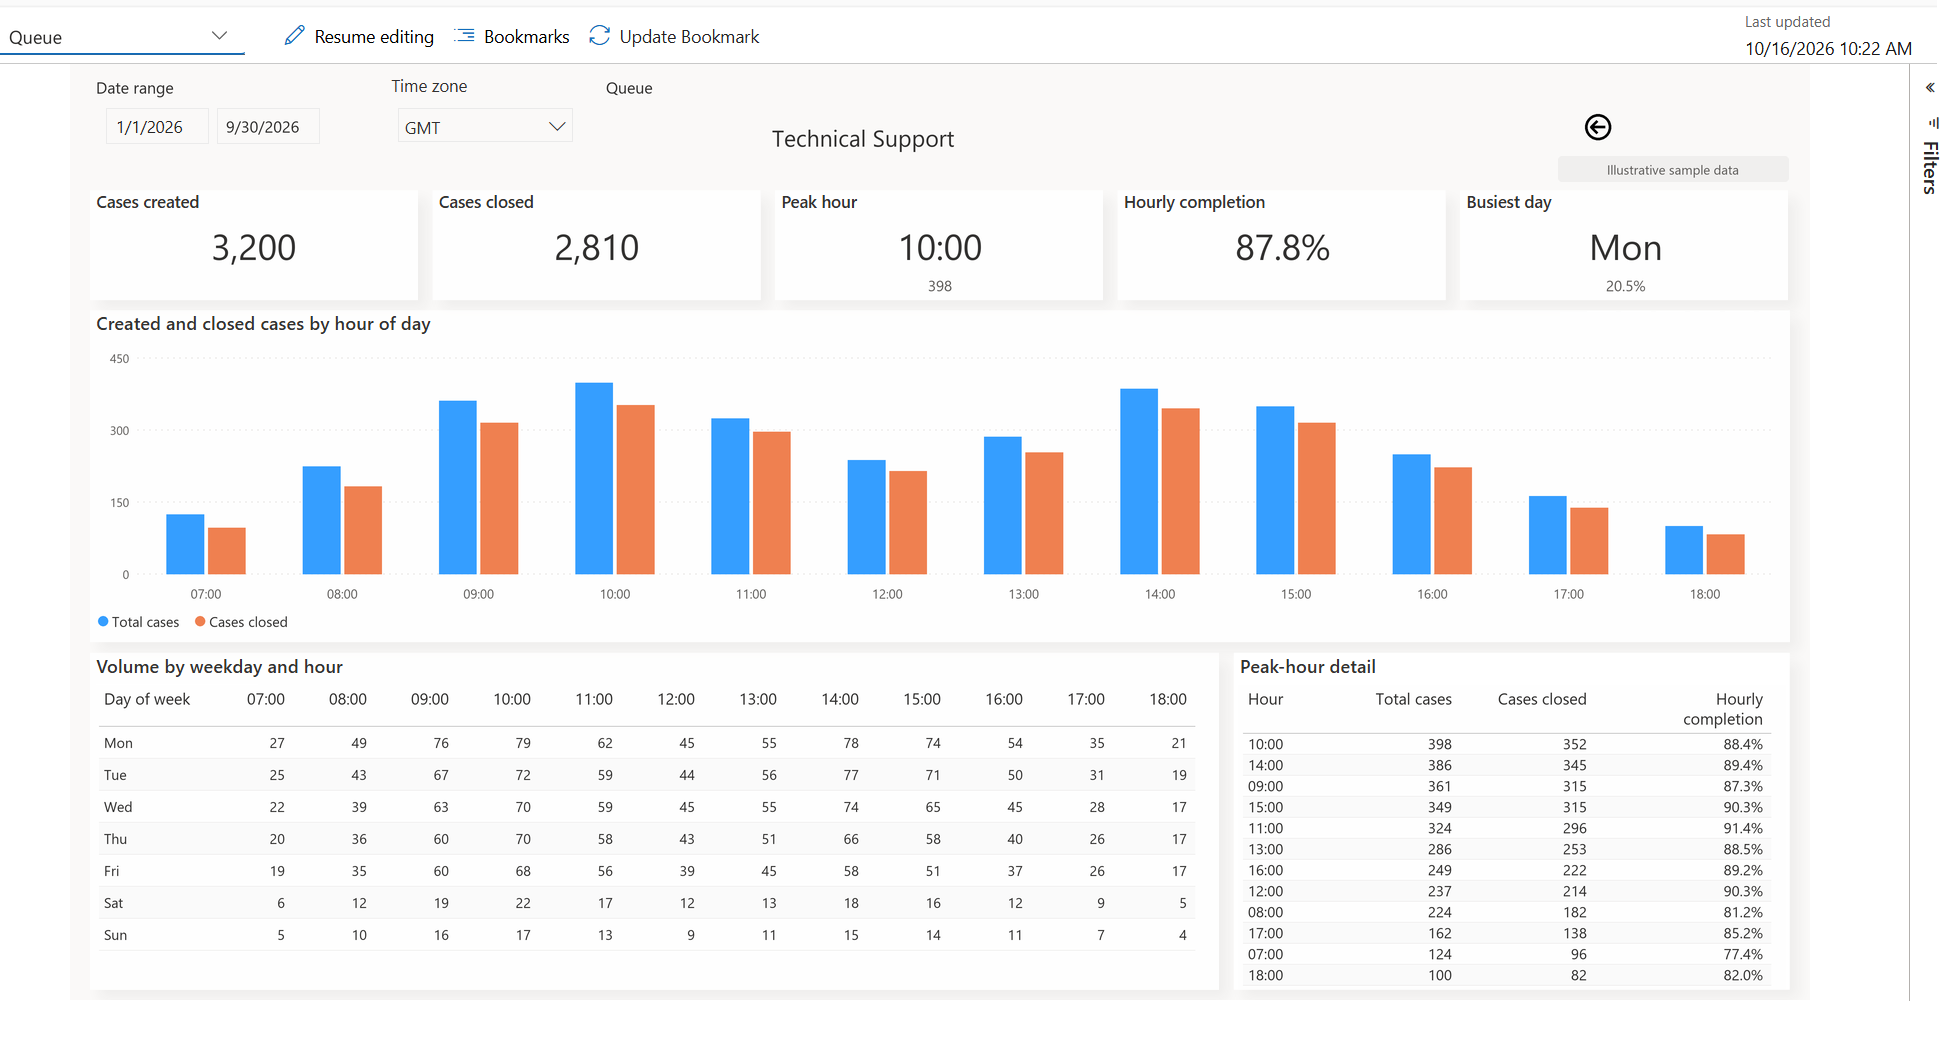
The drill-through view retains the source filters to show the same representative or queue population. Select Back to return to the originating tab.
Review individual cases
Select a supported data point or case number to open the Case details drill-through page. The page retains the source filters.
The details can include the case number and title, customer, priority, status, status reason, owner, queue, and channel. They can also include creation and closure timestamps, first-response and SLA outcomes, reopen count, and CSAT score.
Select the case record link to investigate an outcome. Missing scores remain blank, not zero.
Select Back to return to the report, or select Export to export supported cases in the current context.