Note
Access to this page requires authorization. You can try signing in or changing directories.
Access to this page requires authorization. You can try changing directories.
Applies to: Dynamics 365 Contact Center—standalone and Dynamics 365 Customer Service only
Tracking knowledge article analytics helps you assess the value your articles provide to your customers. When you know and understand when, where, and how many times an article was viewed, it helps you assess you how much your customers rely on the information that it contains. Such data is useful to create future content curation plans and can help you decide what content to deliver, how you deliver it, where you deploy it, and what style or structure you use to write it.
Analytics for knowledge articles in Customer Service Hub
You can track the various details of your article in Customer Service Hub. The Analytics and the Summary tab display the statistics that help you understand how helpful your article is in resolving customer queries.
Analytics tab
To view an article’s view counts and other related statistics, open the article you want to track, and then select the Analytics tab.
Views: Shows you the total number of times the article has been viewed. The View by day and location section shows the article views on a particular day.
To maintain uniformity among users who see the article views across different time zones, the views are calculated based on the Coordinated Universal Time (UTC) time zone, aggregated, and then displayed according to the user's local time zone. So, if you are in the UTC-3 time zone, you see the time and consequently the day as UTC-3. For example, 23rd Jun, 12:00 AM UTC time translates to 22nd Jun, 9:00 PM Brazil (UTC-3) time.
The total number of views remains constant. You can select the Day, Knowledge Article Views, and Location column headers to sort the data.
Feedback: Captures all the feedback and ratings on the knowledge articles and updates the articles accordingly. If your articles are published on a portal, customers and users can provide their feedback and also give ratings on an article. The Feedback sub grid shows all feedback received for the current knowledge article.
The Rating field calculates the average rating of the article based on the amount of feedback and number of ratings received.
Note
Rating and view count numbers are rollup fields that are not updated instantly. Learn more in Define rollup fields.
Cases: Shows a list of the cases that used this article. To view its details, double-click a case .
By reviewing cases that used your articles, you can gain valuable insights into the questions that customers are asking, and what avenues they tried before asking for help. This data can help you promote your knowledge articles better and provide more useful information to your customers and team members.
Summary tab
Use the Summary tab to view and edit basic details of the article. In the Summary tab, you can:
- View or edit Basic settings for the article. These include details like Language, Article Public Number, and more.
- View or edit Publish settings for the article.
- See the Timeline. Add notes or view what you missed.
- View related information about the article in the Related Information section. These include related versions, translations, categories, articles, and products.
Dashboards for knowledge articles in Customer Service Hub
Knowledge managers and authors can now monitor the status of knowledge articles using the two default dashboards available in Customer Service Hub.
Note
If these dashboards don’t offer what you need, you can create new interactive dashboards. More information: Configure interactive experience dashboards
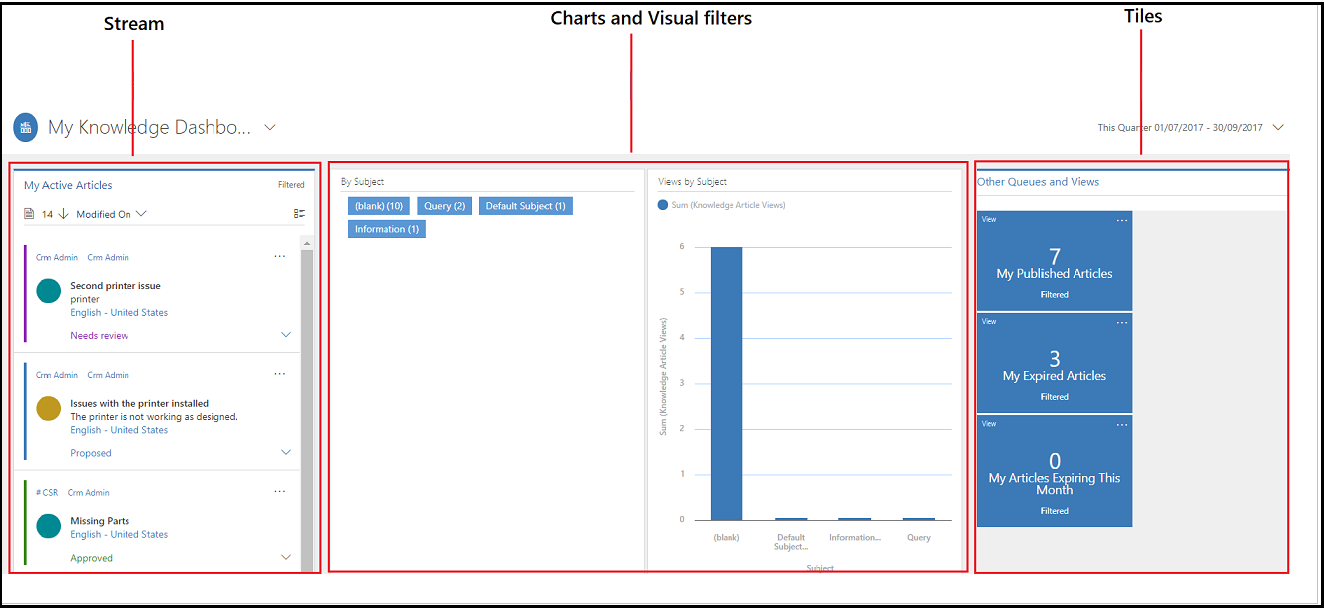
My Knowledge Dashboard
This dashboard is designed to give authors a visual snapshot of the number and status of knowledge articles they’re working on. It helps them quickly know things like articles expiring in the month and articles in review.

Streams show data from views or queues. In the My Knowledge dashboard, the stream shows the active articles assigned to the author.
Charts provide a count of relevant records in the streams, such as articles by status, articles by owner, or articles by subject. They also act as visual filters. You can drill down in a chart to see data that interests you the most.
Tiles give authors an aggregated view of data in the streams and help them monitor the volume of their knowledge articles.
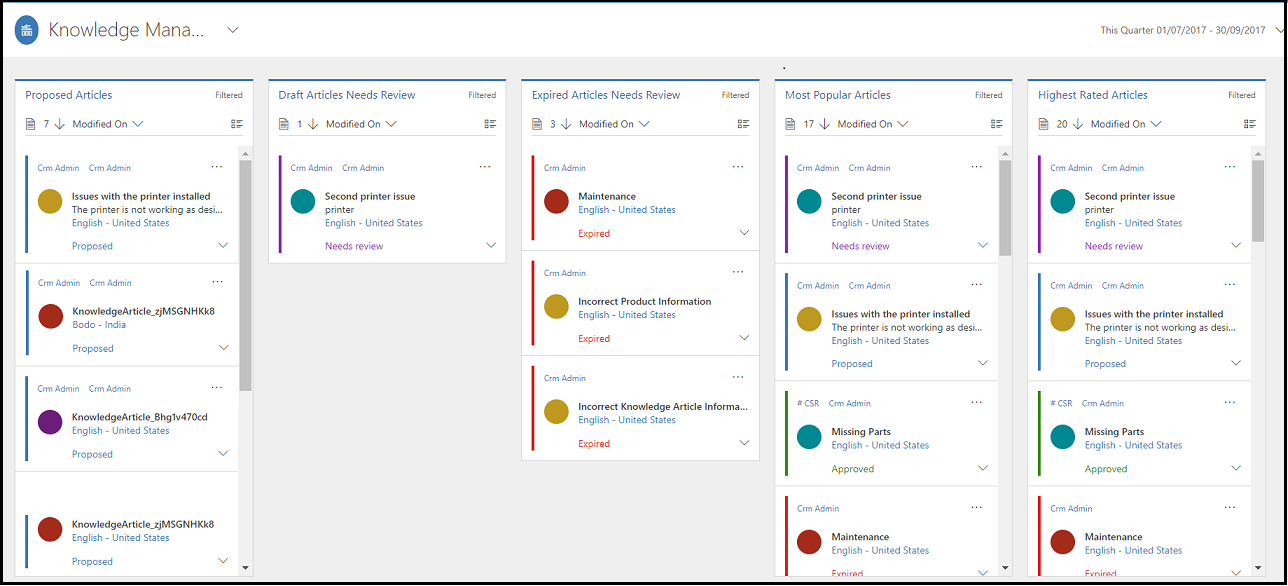
Knowledge Manager
This dashboard is designed specifically for knowledge managers. As a knowledge manager, you can quickly view the most popular articles, articles that need review, highest-rated articles, or articles that are about to expire, and take necessary actions on the articles from here.

More information: Use interactive dashboards to effectively manage service cases
Manage versions in alternate keys for knowledge article entity
If you're creating an alternate key for a Knowledge article entity, include the major or minor version in the key to maintain uniqueness. Also, if you're using translations, include the language code along with the version in the key to ensure a seamless translation experience. Learn more about alternate keys, in Define alternate keys for an entity.
Knowledge article analytics in Copilot Service workspace
The Knowledge analytics dashboard consists of the Article insights and Search term insights dashboards and is meant for knowledge authors and supervisors. Supervisors can use these insights to improve their knowledge management base. Learn more in Introduction to knowledge analytics.