Note
Access to this page requires authorization. You can try signing in or changing directories.
Access to this page requires authorization. You can try changing directories.
Applies to: Dynamics 365 Customer Service and Dynamics 365 Contact Center—standalone only
Note
Copilot Studio bot is renamed as Copilot agent (agent or AI agent). Human agent is now renamed as customer service representative (service representative or representative). You might come across references to the old and new terms while we update the product UI, documentation, and training content.
Note
Case information is applicable to Customer Service only.
This article describes how to navigate the forecast reports in Customer Service so that you can successfully meet the staffing demands of your organization.
Important
This feature is intended to help customer service managers or supervisors enhance their team's performance and improve customer satisfaction. This feature isn't intended for use in making, and shouldn't be used to make, decisions that affect the employment of an employee or group of employees, including compensation, rewards, seniority, or other rights or entitlements. Customers are solely responsible for using Dynamics 365 Customer Service, this feature, and any associated feature or service in compliance with all applicable laws, including laws that relate to accessing individual employee analytics and monitoring, recording, and storing communications with end users. Customers are also responsible to adequately notify end users that their communications with customer service representatives might be monitored, recorded, or stored and, as required by applicable laws. Customers are also responsible for obtaining consent from end users before they use the feature with them. Customers are also encouraged to have a mechanism in place to inform their customer service representatives that their communications with end users might be monitored, recorded, or stored.
Overview
Customer service supervisors need to to ensure that they have an adequate number of customer service representatives (service representatives or representatives) available to serve their customers. Overcapacity results in higher costs, while under capacity results in longer customer wait time, which negatively affects customer satisfaction.
As a supervisor, you can use the forecast reports to help plan the right level of staffing for your business that's based on the predicted volume of cases and conversations, along with the predicted service representative demand for conversations.
You can use the forecast reports for service representative, case, and conversation volumes in the following ways:
Forecast upcoming case and conversation volumes based on historical traffic and the number of service representatives needed to meet the forecasted conversation volume. For conversation volume forecasting, if your administrator configured AI agents for your conversational channels, the system excludes conversations that AI agents handle without having a service representative join the conversation. This function ensures that you can rely on the predicted conversation volumes for service representative staffing.
Visualize forecasted volumes and service representative demand on a daily basis, for a time range up to six months, depending on how many days of cases or conversations were created in the past. This forecast can be used to plan service representative resourcing and recruitment, to meet future demand.
Visualize forecast volumes and service representative demand on a 15-minute interval basis, for a time range up to six weeks, depending on how many days of cases or conversations were created in the past. This forecast can be used to schedule service representatives to meet the near-term demand.
Slice forecasted volumes and service representative demand by channel and queue.
View a rollup of actual and forecasted volume on an hourly, daily, weekly, monthly, and yearly basis. For the agent demand report, you can select the type of rollup from maximum, minimum, average, and sum.
Automatically detect seasonality from historical traffic with the settings option to import your holiday calendar. This function helps the forecasting model to accurately predict case or conversation volumes during special, seasonal events.
Learn more about how the forecast models work for this feature in How agent forecasting for conversation works and How case volume forecasting works.
Note
Be aware of the following functionality when using the Forecast report:
Forecasts might misstate volume estimates for many reasons, including unanticipated trends or business developments.
The Forecast report is currently available in certain geographical locations. Learn more in Supported regions and languages for analytics and insights.
Prerequisites
Before you can use the forecast reports, ensure that your administrator assigned a role to you that has Read privileges on the msdyn_dataanalyticsreport_forecast table. Learn more in Configure case volume forecasting and Configure agents for conversations forecasting.
View the forecast reports in Customer Service
Navigation
You can view the forecast reports in the Copilot Service workspace app. You can navigate to the Forecast dashboard as follows:
In the default view, go to the hamburger menu, and then select Forecast.
If the enhanced multisession workspace view is enabled, select Forecast on the site map.
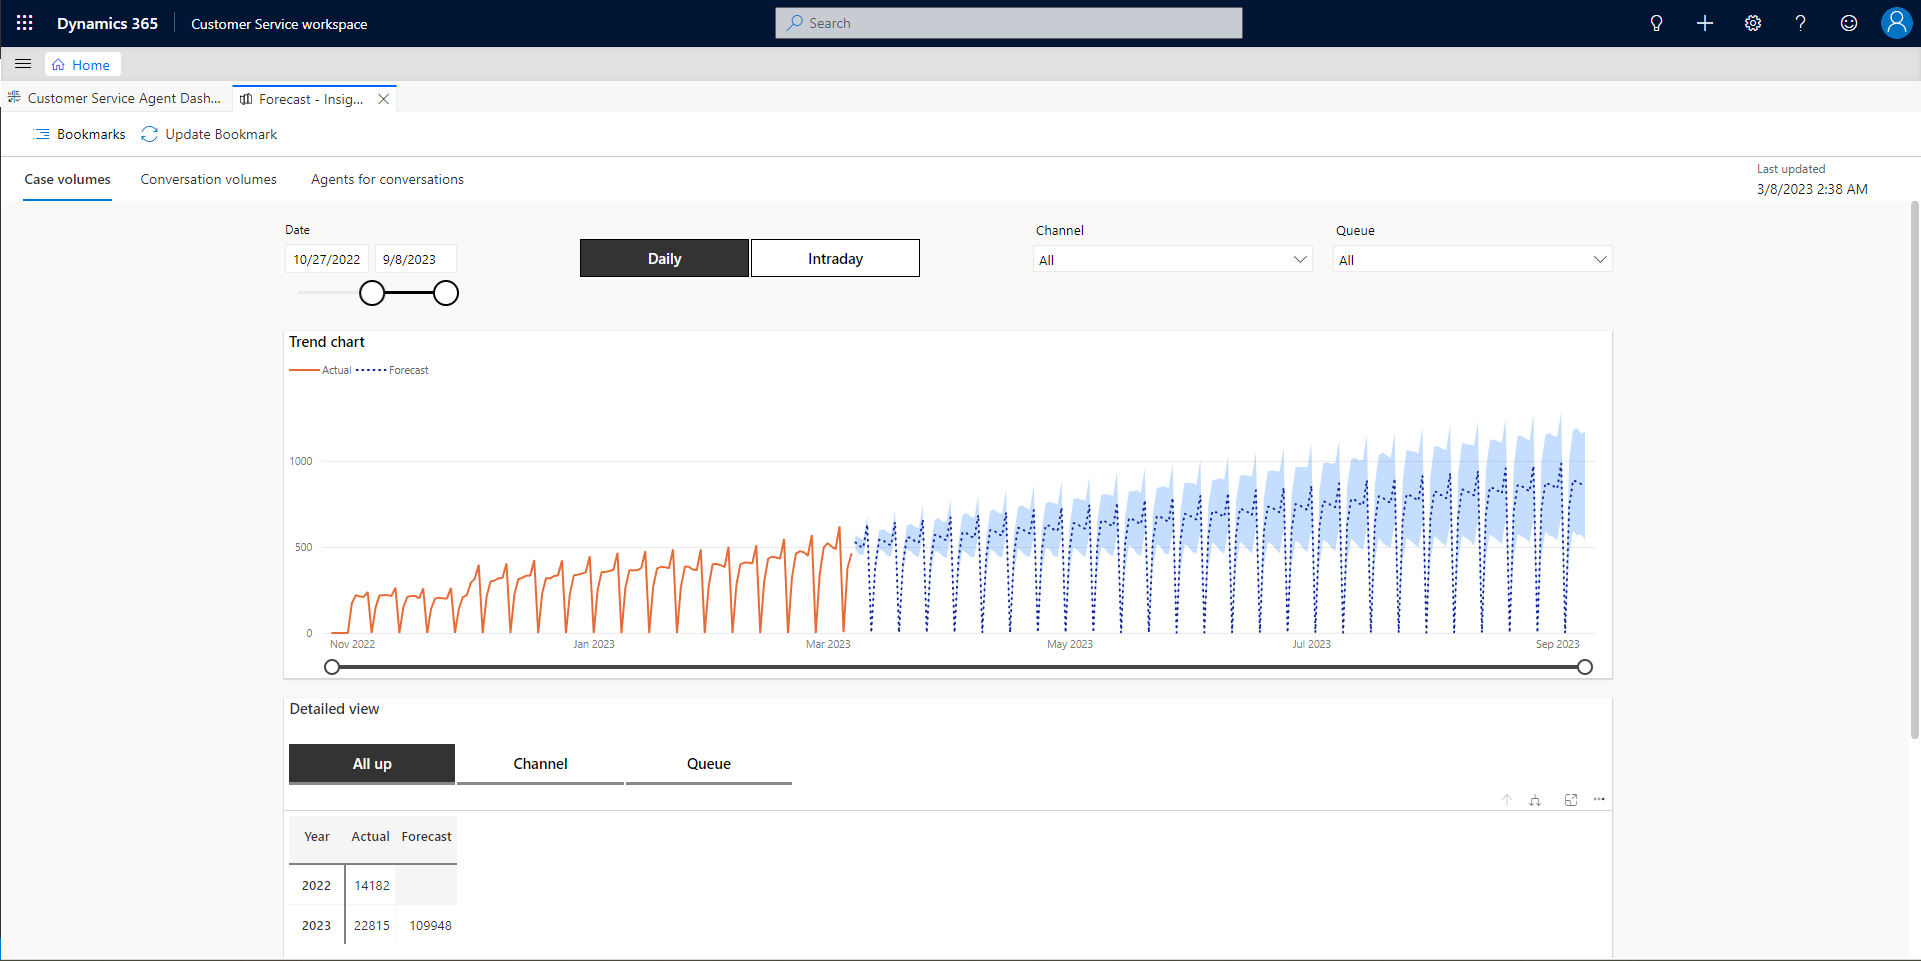
Switch report mode
The forecast reports support two modes:
Daily: This mode displays the actual and predicted case and conversation volumes and service representative demand per day, for a time range of up to six months, depending on how many days of cases or conversations were created in the past. This forecast can be used to plan service representative resourcing and recruitment to meet a future demand.
Intraday: This mode displays the actual and predicted case and conversation volumes and service representative demand in intervals of 15 minutes, for a time range of up to six weeks, depending on how many days of cases or conversations were created in the past. This forecast can be used to schedule service representatives to meet the near-term demand.
To change the report mode, switch the Daily or Intraday toggle button on the report, depending on which mode you want to view the report in.
Filters for case, conversation, and agents for conversations forecasting
The Case volumes, Conversation volumes, and Agents for conversations tabs of the forecast report display visual and numeric metrics for the filters you select. The difference between the tabs is based on the input data source. Case data is based on the case entity, whereas conversation data is based on the omnichannel conversations, such as live chat, digital messages, and the voice channel.
Report data is refreshed on a monthly basis. Your administrator can configure which day of the month the report is refreshed. Learn more in Configure case volume forecasting and Configure agents for conversations forecasting.
You can filter the data on each of the tabs by using any of the following options:
| Filter | Description |
|---|---|
| Duration | Input the date range or use the sliders to set the dates. |
| Channel | Select one or more channels for which you want data displayed. |
| Queue | Select one or more queues for which you want data displayed. |
Data visualization
The forecasting section on each tab of the report displays a visual trend from historical volumes from the past to the predicted volume in the future. The forecast is based on actual case, conversation, and service representative records created in the past.
The Confidence level for the forecasted data is displayed on the right-hand side in blue, indicating the level of confidence in the predicted volume. The narrowest part of the blue area indicates higher confidence. You can hover on the report to display the forecast based on data for specific dates.
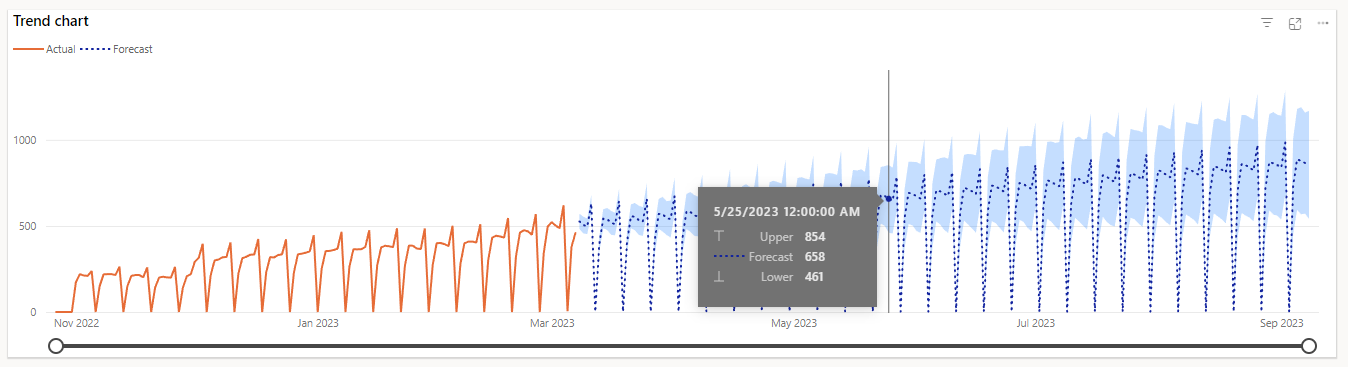
Hover on the future side (dash line) of the report to show a range that includes an upper and lower-bound confidence range, that indicates the amount of possible variance that could occur from the predicted volume number.
View volume forecasting by numbers
The number grid at the bottom of the report shows the actual and predicted number of cases, conversations, or service representative demand across different date and time hierarchies.
You can filter the data by selecting from the following options:
| Filter | Description |
|---|---|
| All up | Displays the actual and forecasted numbers across all channels and queues. You can use the drill up and down buttons to drill to specific levels in the hierarchy. |
| Channel | Displays the actual and forecasted numbers, sliced by each channel. You can use the drill up and down buttons to drill to specific levels in the hierarchy. |
| Queue | Displays the actual and forecasted numbers, sliced by each queue. You can use the drill up and down buttons to drill to specific levels in the hierarchy. |
Filter data by drilling up or down
You can drill into the report data table by using the up or down arrows at the top-right side of the number grid to display data by day, week, month, or year for Daily, and by minute, hour, day, week, month, or year for Intraday.
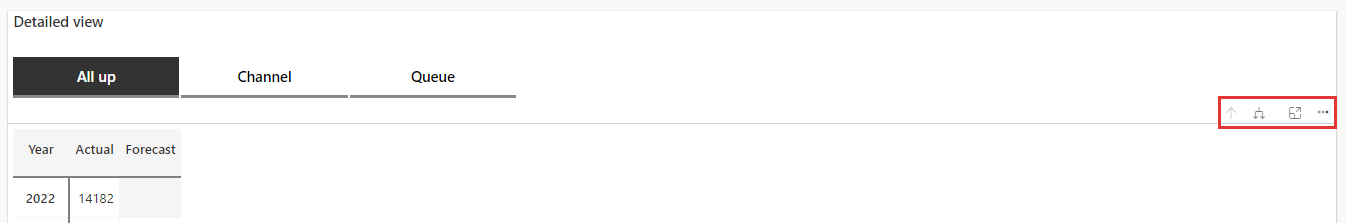
You can drill down the hierarchy by selecting the drill-down hierarchy button. Each time you select the drill-down button, the data drills down one level in the hierarchy. To drill up to the previous level, select the drill up button.
Select rollup mode (Agents for conversations report only)
The Agents for conversations report allows you to select the rollup method in the number grid. The selected method is used to roll up data at higher levels in the date and time hierarchy. The following rollup methods are available:
Average: This method averages the available data at a level in the date and time hierarchy to roll up to the next higher level in the hierarchy.
Maximum: This method picks the maximum from the available data at a level in the date and time hierarchy to roll up to the next higher level in the hierarchy. This method is the default rollup that's selected when you access the report for the first time.
Minimum: This method picks the minimum from the available data at a level in the date and time hierarchy to roll up to the next higher level in the hierarchy.
Sum: This method sums the available data at a level in the date and time hierarchy to roll up to the next higher level in the hierarchy.
Note
Average, Maximum, and Minimum rollup methods in the All up view work differently than the regular rollup using the same methods. In the regular rollup, the rollup method is applied to the aggregate data across channels and queues. However, in the Agents for conversations report, the data at a particular level in the date and time hierarchy is the sum of the applied rollup method to the data for each unique channel and queue combination at the immediate lower level in the hierarchy.
For example, the data at the Month level is calculated by summing up the selected rollup method to the data at the Week level for each unique combination of channel and queue.
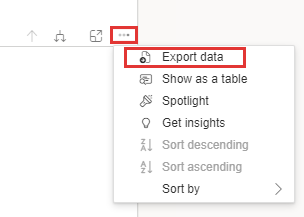
Export data
You can export the report data by selecting Export data on the command bar.
Related information
Configure case forecasting
Configure agent forecasting for conversation
Introduction to Customer Service Insights
Regional availability and Service limits for Customer Service
Manage report bookmarks