Note
Access to this page requires authorization. You can try signing in or changing directories.
Access to this page requires authorization. You can try changing directories.
Microsoft Power BI is a suite of business analytics tools that let you analyze data and share insights. By using Power BI tools, you can explore data and quickly create rich reports and dashboards. You and your colleagues can then use the reports interactively on many devices. The application uses Power BI for data exploration.
Data exploration through Power BI
There are various types of reporting.
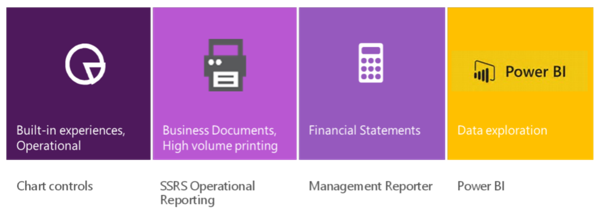
Chart controls are used to build embedded experiences that require visuals.
Microsoft SQL Server Reporting Services (SSRS) is an engine that is designed for pixel-perfect, formatted reports that often require printing. We use SSRS for document-style reports, such as invoices and purchase orders. Our investments in SSRS integration focus on document generation and printing scenarios.
For all non-document reports or reports that don’t have to be printed, we want to embrace Power BI.
In the past, we have used the terms self-service reports and ad-hoc reports to refer to Power BI. We will now use the term data exploration. This change in terminology reflects a subtle shift in paradigms. Self-service reports were reports that the users themselves created. (Alternatively, a power user created the reports and shared them with other people. These people then continued to adjust the reports according to their requirements.) Often, users had to change the shape of a chart, add a new column, change the grouping, or just create a new view of data. Although we might think of the results as reports, users are just trying to understand the data by exploring it, pivoting it around columns, and changing the shape of charts. Technologies of the past didn’t let users interactively explore large volumes of data. Therefore, users had to create "reports," or many views of the same data.
In Power BI, thanks to the in-memory database technologies in Microsoft SQL Server, a report is a just the starting point for interactive data exploration. Charts in a Power BI report invite users to click them, visuals change shape interactively, and data can easily be filtered. Users can easily adjust existing reports and create their own views of the data. The reports can be shared, and teams can collaborate over data.
Therefore, although you might use the term report to refer to Power BI artifacts, you should think about the larger scenario that is involved. Your users are exploring data! Power BI is the tool of choice when you must address data exploration and visualization requirements.
For a detailed discussion of reporting concepts, see Information access and reporting.
Ready-made Power BI content
You can use ready-made Power BI reports right away. Two types of Power BI content are available:
- Power BI content that is available in Microsoft Dynamics Lifecycle Service (LCS)
- Power BI content packs that are distributed in the PowerBI.com marketplace
Depending on your version, you can use one of both types of content.
Power BI content that is available in LCS
LCS is a service that can manage your environments. LCS is operated by Microsoft. Power BI reports are developed by using Entity store and are then distributed in LCS as implementation assets. In LCS, you will find not only content that is developed by Microsoft, but also content that is developed by independent software vendors (ISVs) and partners.
We will continue to release Power BI content that is based on Entity store. For information, see the Roadmap.
Power BI content packs that are distributed in the PowerBI.com marketplace
There are several Power BI content packs in the PowerBI.com marketplace. Although these content packs will continue to be supported until further notice, our future investments in content packs will be based on Entity store, and content will be released via LCS.
For more information about the content, see Power BI content.
Extending, creating, and distributing Power BI reports
You should use the ready-made Power BI content as a first step. You can modify ready-made reports or extend them by using capabilities that are built into PowerBI.com. In addition to modifying ready-made reports, you can extend them using Power BI authoring tools such as Power BI desktop. You can also create new reports. You can use several approaches to create new Power BI reports.
Creating high-volume, near-real-time "operational Power BI reports" by using Entity store
Entity store is an operational data store that is built specifically for Power BI integration. To create high-volume, near-real-time Power BI reports that use Entity store, a business analyst or a developer can use Power BI desktop, which is the authoring tool for Power BI reports. Like other artifacts that developers create, these reports must be distributed to your users via LCS.
Reports that are created by using Entity store take advantage of DirectQuery technology. This technology enables reports to be created over large volumes of data. Reports that are created by using DirectQuery technology don't cache data in the PowerBI.com service. Instead, data is always stored in application.
For an overview of Power BI integration with Entity store, see Power BI integration with Entity store.
If you're upgrading from Microsoft Dynamics AX 2012, you can upgrade cubes to aggregate measurements that use Entity store. You can then create Power BI reports by using Entity store. For more information, see Migrate upgraded AX 2012 R3 sales cubes to the entity store.
Creating Power BI reports by using Excel
In addition to using the Power BI desktop authoring tool, you can use "Power tools" that are incorporated into Excel to create visualizations. Your organization might have many users who already use Excel every day. For a quick "one-off" report, Excel might be the best option for these users.
There are several scenarios where you can use Excel:
- Export data from a page in Dynamics 365 into Excel. You can then use the Power View add-in that is built into Excel to visualize the data. The Excel workbook can be used as a stand-alone visualization. In addition, you can import the report into the PowerBI.com service.
- Use the Power Query extension in Excel to combine the data in another worksheet (or data that is imported from OData endpoints) with external data. You can visualize the resulting data by using Power View.
- Use the PowerPivot extension in Excel to ingest a larger amount of data into Excel.
Consider using Export to Excel functionality for ad-hoc "one-off" reports. If the reports will be shared with a group of users, you should consider using Entity store to create them.
Sharing and using reports in PowerBI.com
PowerBI.com is a service that is offered by Microsoft. It lets you create dashboards and reports, and also enables collaboration with a group of users. Regardless of how you create your reports, you can share reports with users by uploading them into the PowerBI.com service. (This process is also known as publishing.)
After your reports are uploaded, your users can view, adjust, and explore them either on the web (when they are connected to the Internet at home or in the office) or by using apps on a device.
For more information about Power BI concepts, see the Power BI documentation.
Pinning Power BI content to the client
PowerBI.com can be used on its own as a reporting and dashboard solution for your organization or business unit. However, users can also pin tiles and reports from their own PowerBI.com accounts to workspaces. Power BI content in Dynamics 365 provides contextual insights that are related to business operations.
You can pin two types of objects from PowerBI.com: tiles in PowerBI.com dashboards, and reports.
Before you can pin Power BI content, you must configure Power BI in your Dynamics 365 environment.
One-time configuration of PowerBI.com integration
Before you can pin tiles or reports, an administrator must configure integration with PowerBI.com in your environment. This configuration must be done only one time per environment. For instructions, see Configure Power BI integration for workspaces.
Pinning PowerBI.com tiles
Power BI tiles that are pinned to the Dynamics 365 client provide insightful visuals at a glance. They also let users open PowerBI.com for interactive analysis. For more information, see Configure Power BI integration for workspaces.
Pinning PowerBI.com reports to workspaces
As a power user, a business analyst, or a developer, you can use Power BI desktop to create reports that use Entity store. Not only are these reports rich and interactive, but your users can make changes without having to rely on another person.
Although the reports in PowerBI.com are powerful and interactive on their own, they can also be pinned into workspaces. Your users can pin reports to workspaces themselves. For more information about how to pin reports to workspaces, see Pin Power BI reports to workspaces.