Note
Access to this page requires authorization. You can try signing in or changing directories.
Access to this page requires authorization. You can try changing directories.
Applies to: Dynamics 365 Supply Chain Management
Demand forecasting is the process of predicting future demand for products and services to estimate revenue and drive strategic and operational business planning, among other activities. Demand forecasting is useful for businesses because it allows them to predict future sales demand and use that data to drive certain business decisions.
When organizations have greater certainty in their expected demand, they can minimize buffer inventory as a result, which reduces the amount of money that is tied up in on hand inventory. It can also help organizations avoid the cost of expediting procurement or production due to unexpected demand.
Another benefit of demand forecasting is that it can allow organizations to reduce order fulfillment lead times. In a make-to-order model, the procurement and/or production lead times constrain the fulfillment lead time. If organizations use a demand forecast to drive planning processes, they can order or make longer-lead-time items in advance, reducing the amount of time from sales order entry to customer delivery. Forecasting also allows organizations to look at their holistic demand over larger periods of time, which can be useful to drive global capacity planning and feed into strategic planning processes.
In industries such as retail, it's critical to have inventory on hand at the time an order is placed. When inventory isn't available, the customer buys it somewhere else rather than waiting for your organization to buy or make more. An accurate demand forecast can help prevent stock-out scenarios and allow organizations to gain the revenue that they would otherwise lose in a stockout.
Demand forecasting is a fluid process that is often implemented in later phases or iterations of larger projects. The demand forecasting process and solution design should be reviewed regularly to accommodate for the changing global supply chain.
Stakeholders
Many people in an organization must contribute to the decision-making process and design of the demand forecasting process in your Dynamics 365 project. The list includes but isn't limited to the following roles:
- Finance stakeholders – Examples: Chief Financial Officer (CFO), Controller, and Accounting manager
- Sales stakeholders – Examples: Vice President (VP) of sales, Sales Directors, and General Managers
- Operations stakeholders – Examples: Chief Operating Officer (COO), Warehouse managers, and Production managers
Demand forecasting process flow
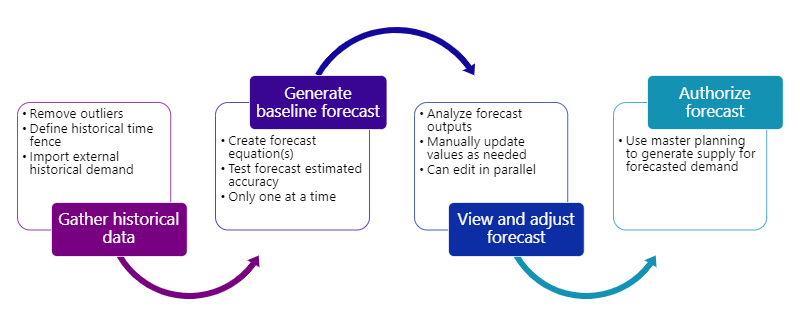
The first step of the demand forecasting process is to gather historical data. This might include importing external historical demand to supplement the demand data in Dynamics 365. The next step in the process is to generate the statistical baseline forecast with Azure Machine Learning, which will create the forecast model, and then test the Mean Absolute Percentage Error (MAPE) for the model.
Once the forecast is generated, it's reviewed in Dynamics 365 and users can update the recommended values as needed. When the forecasting values are approved, a user can authorize the forecast that publishes it to the system for use in planning and other operations. The following graphic shows the process flow described earlier in this article.
Configuring demand forecasting
There are various components that are used in the configuration of demand forecasting in Dynamics 365 applications. The following table shows the configurations available, and the sequence recommended for setting up the configurations. FO in the Product column indicates finance and operations apps, and CE indicates customer engagement apps. The Req? column indicates a Y for required and an N for not required. Use the links on the configuration component to learn more about how to configure that component.
| Seq | Configuration component | Req? | Product | Menu path |
|---|---|---|---|---|
| 1 | Demand forecasting parameters | Y | FO | Master planning > Setup > Demand forecasting > Demand forecasting parameters |
| 2 | Item allocation keys | Y | FO | Master planning > Setup > Demand forecasting > Item allocation keys |
| 3 | Forecast models | Y | FO | Master planning > Setup > Demand forecasting > Forecast models |
| 4 | Outlier removal | N | FO | Master planning > Setup > Demand forecasting > Outlier removal |
| 5 | Intercompany planning groups | N | FO | Master planning > Setup > Intercompany planning groups |
| 6 | Forecast plans | Y | FO | Master planning > Setup > Forecast plans |
| 7 | Master plans | Y | FO | Master planning > Setup > Master plans |
| 8 | Forecasting algorithm parameters | Y | FO | Master planning > Setup > Demand forecasting > Forecasting algorithm parameters |
| 9 | Period allocation categories | N | FO | Master planning > Setup > Demand forecasting > Period allocation categories |
Related information
Find definitions of terminology used in content for demand forecasting in the Glossary of terms in Dynamics 365 business processes article, including the following terms:
