Gain insights from your fundraising programs
The Program impact dashboard is part of Microsoft Cloud for Nonprofit. You can view, explore, and gain insights from snapshots of your programs, program revenue and budgets, donations aligned to programs, and impact generated from your programs.
Note
Until January 1, 2024, you need a Power BI premium license to use the French language data set.
The dashboard is built on the Nonprofit Common Data Model. It has four tabs:
- Impact Delivered
- Program Summary
- Program Monitoring
- Program Impact
This article provides a summary of each tab and the measures for each.
Impact Delivered
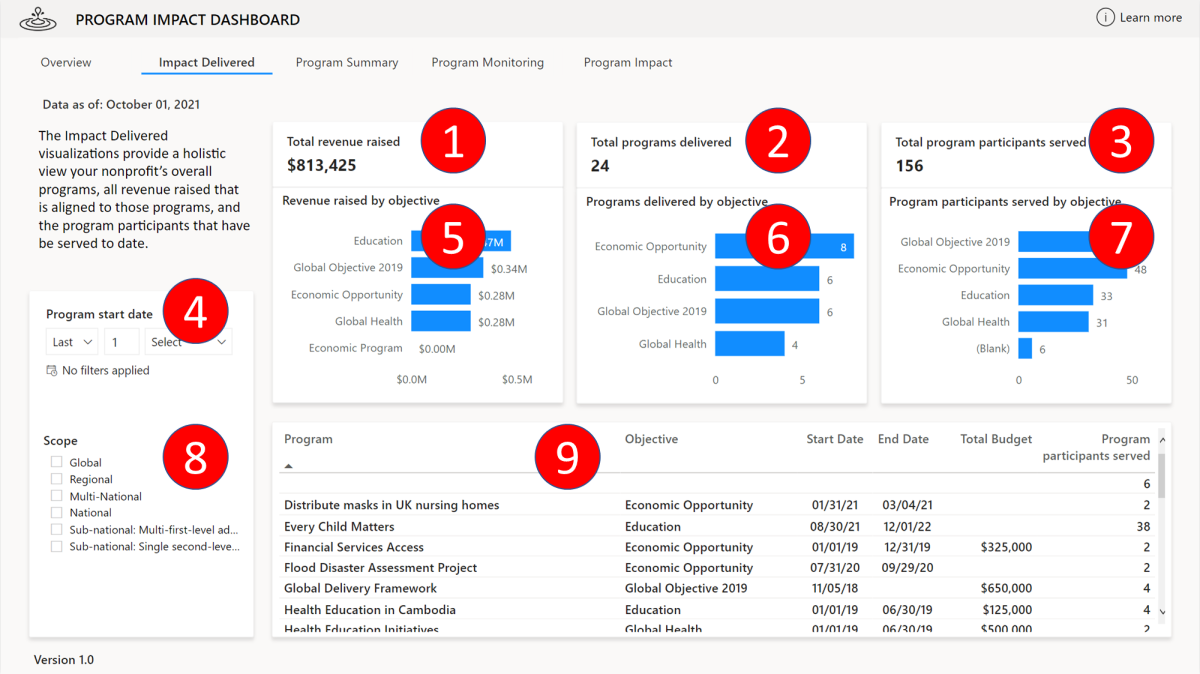
The Impact Delivered tab provides a holistic view of your nonprofit’s overall programs, all revenue raised that's aligned to those programs, and the program participants that have been served to date. Many nonprofits use this view to update their leadership team, board, or internal staff. It's also a starting point when preparing annual impact reports or program updates.

| # | Area | Nonprofit CDM mapping |
|---|---|---|
| 1 | Total revenue raised | Designated Credit Amount = msnfp_designationcredit > msnfp_amount |
| 2 | Total program delivered | Program = Total of msnfp_deliveryframework > msnfp_deliveryframeworkid |
| 3 | Total program participants served | Program participants = Unique Count of msnfp_benefitrecipients > msnfp_benefitrecepientid |
| 4 | Program start date | Start Date = msnfp_deliveryframework > msnfp_startdate |
| 5 | Revenue raised by objective | Designation Credit Amount = msnfp_designationcredit > msnpf_amount AND Start Date = msnfp_objective > msnfp_startdate |
| 6 | Program delivered by objective | Program = msnfp_deliveryframework > msnfp_deliveryframeworkid AND Name = msnfp_objective > msnfp_name |
| 7 | Program participants served by objective | Program participant = msnfp_benefitrecipients > msnfp_benefitrecepientid AND Name = msnfp_objective > msnfp_name |
| 8 | Scope | Scope = deliveryframework > msnfp_scope |
| 9 | Program/Objective table | Program = msfnp_deliveryframework > msnfp_name, msnfp_startdate, msnfp_end date Name = msnfp_objective > msnfp_name Total Budget = msnfp_budget > msnfp_totalbudget Program Participant = Unique count of msnfp_benefitrecipient > msnfp_benefitrecipientid |
Program Summary
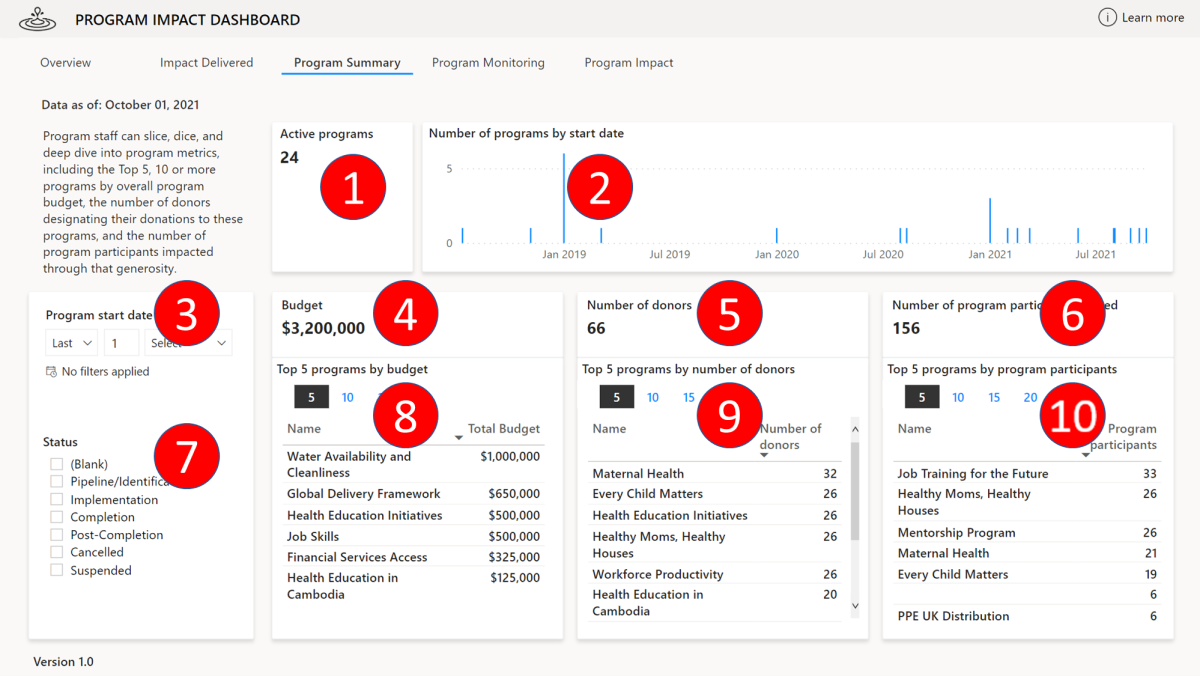
The Program Summary tab allows program staff to dive deep into program metrics, including the top programs by overall program budget, the number of donors assigning their donations to these programs, and the number of program participants impacted through that generosity.

| # | Area | Nonprofit CDM mapping |
|---|---|---|
| 1 | Active programs | Programs = Total of msnfp_deliveryframework > msnfp_deliveryframeworkid |
| 2 | Number of programs by start date | Program = msnfp_deliveryframework > msnfp_deliveryframeworkid, Start Date = msnfp_deliveryframework > msnfp_startdate |
| 3 | Date | Start Date = msnfp_deliveryframework > msnfp_startdate |
| 4 | Budget | Budget = msnfp_budget > msnfp_totalbudget |
| 5 | Number of donors | Unique count msnfp_designationcredit > contact ID WHERE (msnfp_primaryconstituenttype = Primary Constituent Type) = « Donor » |
| 6 | Number of program participants served | Program participants = Unique count of msnfp_benefitrecipient > msnfp_benefitrecipientid |
| 7 | Status | Status = msnfp_deliveryframework > msnfp_status |
| 8 | Top 5 programs by Budget | Total Budget = msnfp_budgets > msnfp_totalbudget WHERE msnfp_totalbudget = Total Budget <= SELECTED VALUE (5,10,15,20) |
| 9 | Top 5 programs by number of donors | Name = msnfp_deliveryframeworks> msnfp_name Number of donors = Unique count of msnfp_ designatedcredit > Contactid WHERE (msnfp_primaryconstituenttype = Primary Constituent Type) = « Donor » <= SELECTED VALUE (5,10,15,20) |
| 10 | Top 5 programs by program participant | Name = msnfp_deliveryframeworks > msnfp_name Program Participant = Unique count of msnfp_benefitrecipients > msnfp_benefitrecipientid WHERE msnfp_benefitrecipientid = Benefit Recipient <= SELECTED VALUE (5,10,15,20) |
Program Monitoring
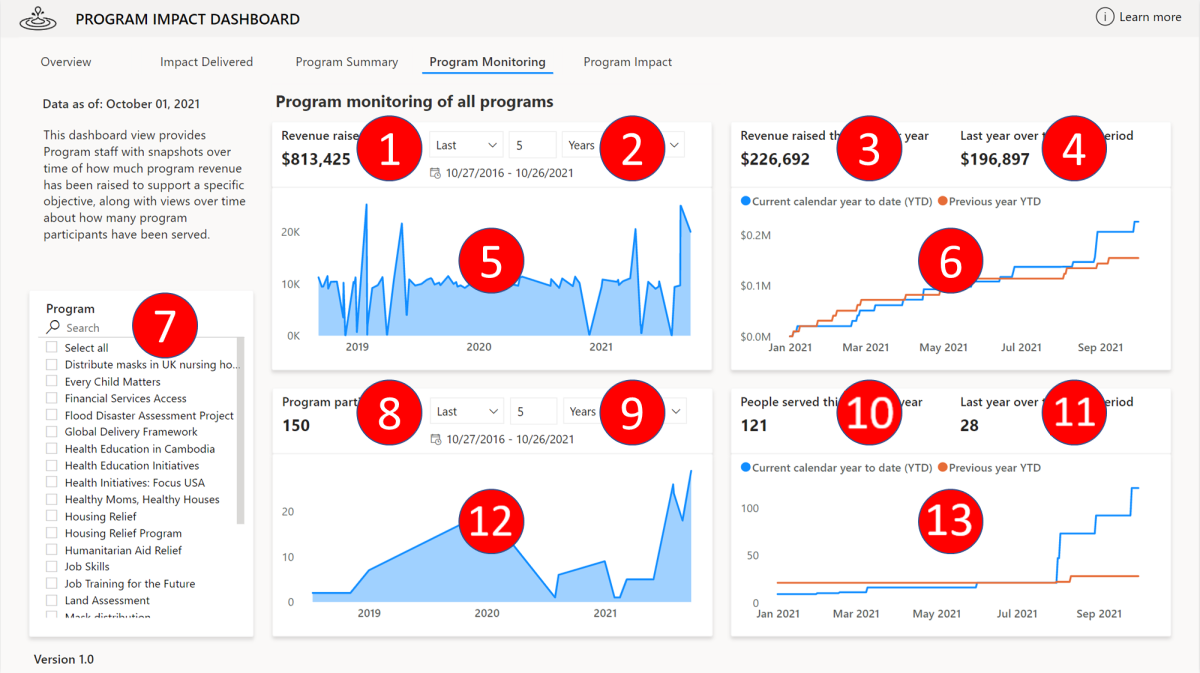
The Program Monitoring tab provides program staff with snapshots of how much program revenue has been raised to support a specific goal, and views over time about how many program participants have been served. For program officers and managers, monitoring their program’s performance on a yearly, monthly, or daily basis is critical for understanding how on-the-frontline operations and execution are progressing.

| # | Area | Nonprofit CDM mapping |
|---|---|---|
| 1 | Revenue raised | Revenue = Total of msnfp_designatedcredits > msnpf_Transaction.amount |
| 2 | Time filter | Date = msnfp_designatedcredits > Transaction.bookdate |
| 3 | Revenue raised this calendar year | msnfp_designatedcredits > msnfp_Transaction.amount, msnfp_Transaction.bookdate WHERE bookdate equals current year |
| 4 | Last year over the same period | msnfp_designatedcredits > Transaction.amount, Transaction.bookdate WHERE bookdate equals previous year |
| 5 | Revenue raised over time graph | Total Budget = msnfp_budget > msnfp_totalbudget Program Start Date = msnfp_deliveryframework > msnfp_startdate |
| 6 | Revenue raised year over year graph | msnfp_designatedcredits > msnfp_transaction.amount, msnfp_transaction.bookdate |
| 7 | Program | Name = msnfp_deliveryframework > msnfp_name |
| 8 | Program Participants | Program participants = Unique count of msnfp_benefitrecipient > msnfp_benefitrecipientid |
| 9 | Time filter | Program Start Date = msnfp_deliveryframework > msnfp_startdate |
| 10 | People served this calendar year | Program participants = Unique count of msnfp_benefitrecipient > msnfp_benefitrecipientid Program Start Date = msnfp_deliveryframework > msnfp_startdate WHERE msnfp_startdate equals current year |
| 11 | Last year over the same period | Program participants = Unique count of msnfp_benefitrecipient > msnfp_benefitrecipientid Program Start Date = msnfp_deliveryframework > msnfp_startdate WHERE msnfp_startdate equals previous year |
| 12 | Program participants served over time graph | Program participants = Unique count of msnfp_benefitrecipient > msnfp_benefitrecipientid Program Start Date = msnfp_deliveryframework > msnfp_startdate |
| 13 | Program participants served year over year graph | Program participants = Unique count of msnfp_benefitrecipient > msnfp_benefitrecipientid Program Start Date = msnfp_deliveryframework > msnfp_startdate |
Program Impact
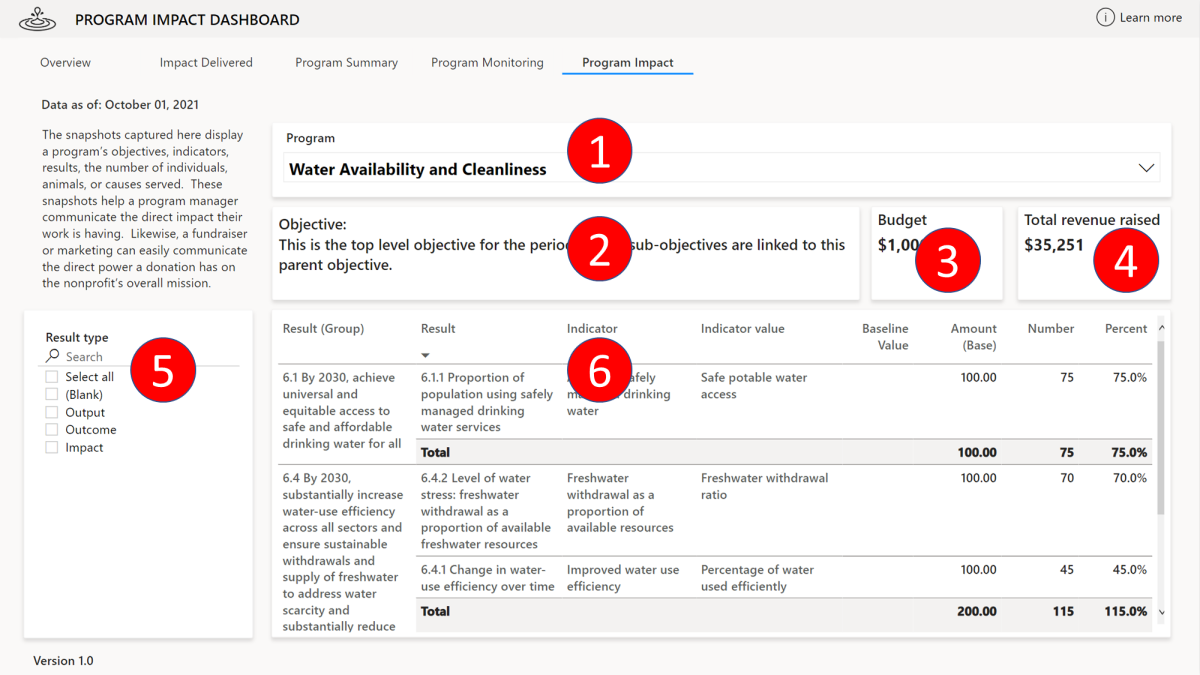
The Program Impact tab displays a program’s objectives, indicators, results, the number of individuals, animals, or causes served. This view helps program managers communicate the direct impact their work is having. Likewise, a fundraiser or marketing can easily communicate the direct power a donation has on the nonprofit’s overall mission.

| # | Area | Nonprofit CDM mapping |
|---|---|---|
| 1 | Program | Name = msnfp_deliveryframework > msnfp_name |
| 2 | Objective | Description = msnfp_objective > msnfp_description |
| 3 | Budget | Budget = msnfp_budgets > msnfp_totalbudget |
| 4 | Total revenue raised | Revenue = Sum of msnfp_designatedcredits > msnfp_transaction.amount |
| 5 | Result type | Result Type = msnfp_results > msnfp_resulttype |
| 6 | Result table | Result (Group) = msnfp_results (PARENT) > msnfp_name Result = msnfp_results (NONPARENT) > msnfp_name Indicator = msnfp_indicators > msnfp_name msnfp_indicatorvalues > Name = msnfp_name, Baseline Value = msnfp_baselinevalue, Amount (Base) = msnfp_amount_base, Number = msnfp_number, Percentage = msnfp_percentage |
For more information about the Nonprofit Common Data Model, go to Nonprofit Accelerator on GitHub.
For more information about Power BI, go to Power BI documentation.