Leaderboard report for customer journeys and email marketing
Note
Dynamics 365 Marketing and Dynamics 365 Customer Insights are now Customer Insights - Journeys and Customer Insights - Data. For more information, see Dynamics 365 Customer Insights FAQs
New Customer Insights - Journeys customers receive real-time journeys features only. For more information, see Default real-time journeys installation.
Important
This article only applies to outbound marketing.
The leaderboard report for customer journeys and email marketing identifies your most effective journeys and messages. Use the following links to download a template for running the report on your own organization and a sample report filled with sample data.
| Download report template | Download sample report |
|---|---|
Note
You can find the full list of marketing analytics downloads in the marketing analytics reporting gallery.
In addition to the common report pages and a report home page, this analytics report includes the following pages:
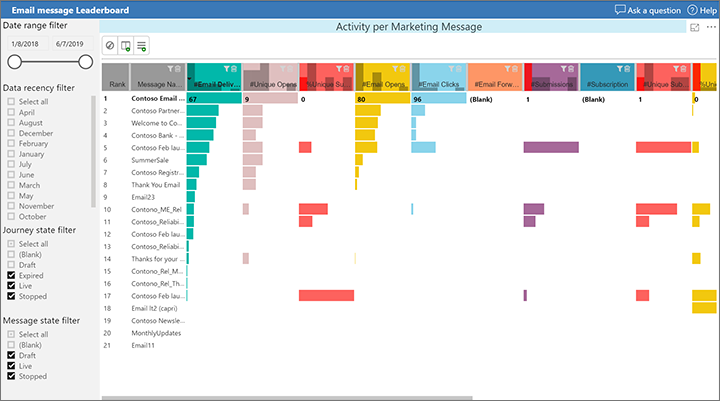
- A detailed leaderboard of email marketing activities
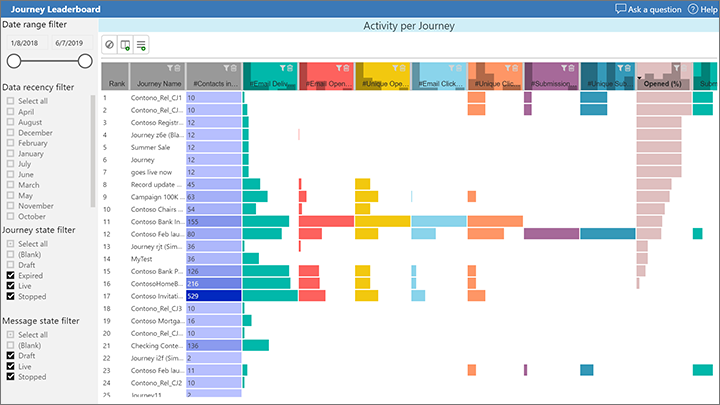
- A detailed leaderboard of customer journeys
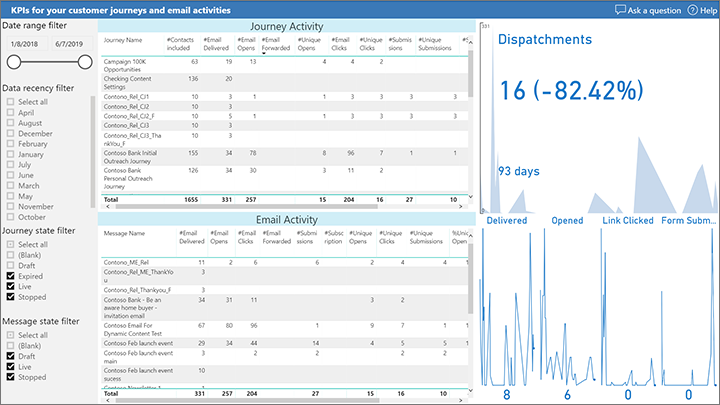
- A leaderboard of KPIs, with timelines
Leaderboard of email marketing activities
The detailed email marketing leaderboard lets you compare and rank your marketing messages based on the following KPIs:
- Total emails delivered
- Total email opens, unique opens, and open rate
- Total link clicks, unique clicks, and click rate
- Total form submissions, unique submissions, and submission rate
- Total subscriptions, unique subscriptions, and submission rate
Use the data range, message status, and journey status columns to filter the messages. The interactions can also be filtered by age.
Users can configure the leaderboard chart control, rearrange columns, and sort the list by any selected KPI as needed.

Leaderboard of customer journeys
KPIs related to email marketing are aggregated across all marketing messages that are part of a journey. The report compares and ranks your journeys based on the following KPIs:
- Number of contacts processed by the journey
- Total emails delivered
- Total email opens, unique opens, and open rate
- Total link clicks, unique clicks, and click rate
- Total form submissions, unique submissions, and submission rate
- Total subscriptions, unique subscriptions, and subscription rate
Use the data range and status slicers to filter the journeys. The interactions can also be filtered by age.
Users can configure the leaderboard chart control, rearrange columns, and sort the list by any selected KPI as needed.

Leaderboard of KPIs with timelines
This report lists all the KPIs, marketing messages, and journeys selected by the sliders. In addition, you can look at the individual interaction timelines that lie behind the KPIs. Try filtering the various journeys and messages, or slicing and dicing to compare your marketing activities by various criteria.

Happy analytics reporting with Dynamics 365 Customer Insights - Journeys!