Note
Access to this page requires authorization. You can try signing in or changing directories.
Access to this page requires authorization. You can try changing directories.
Applies To: Project Operations Integrated with ERP, Project Operations Core
Overview
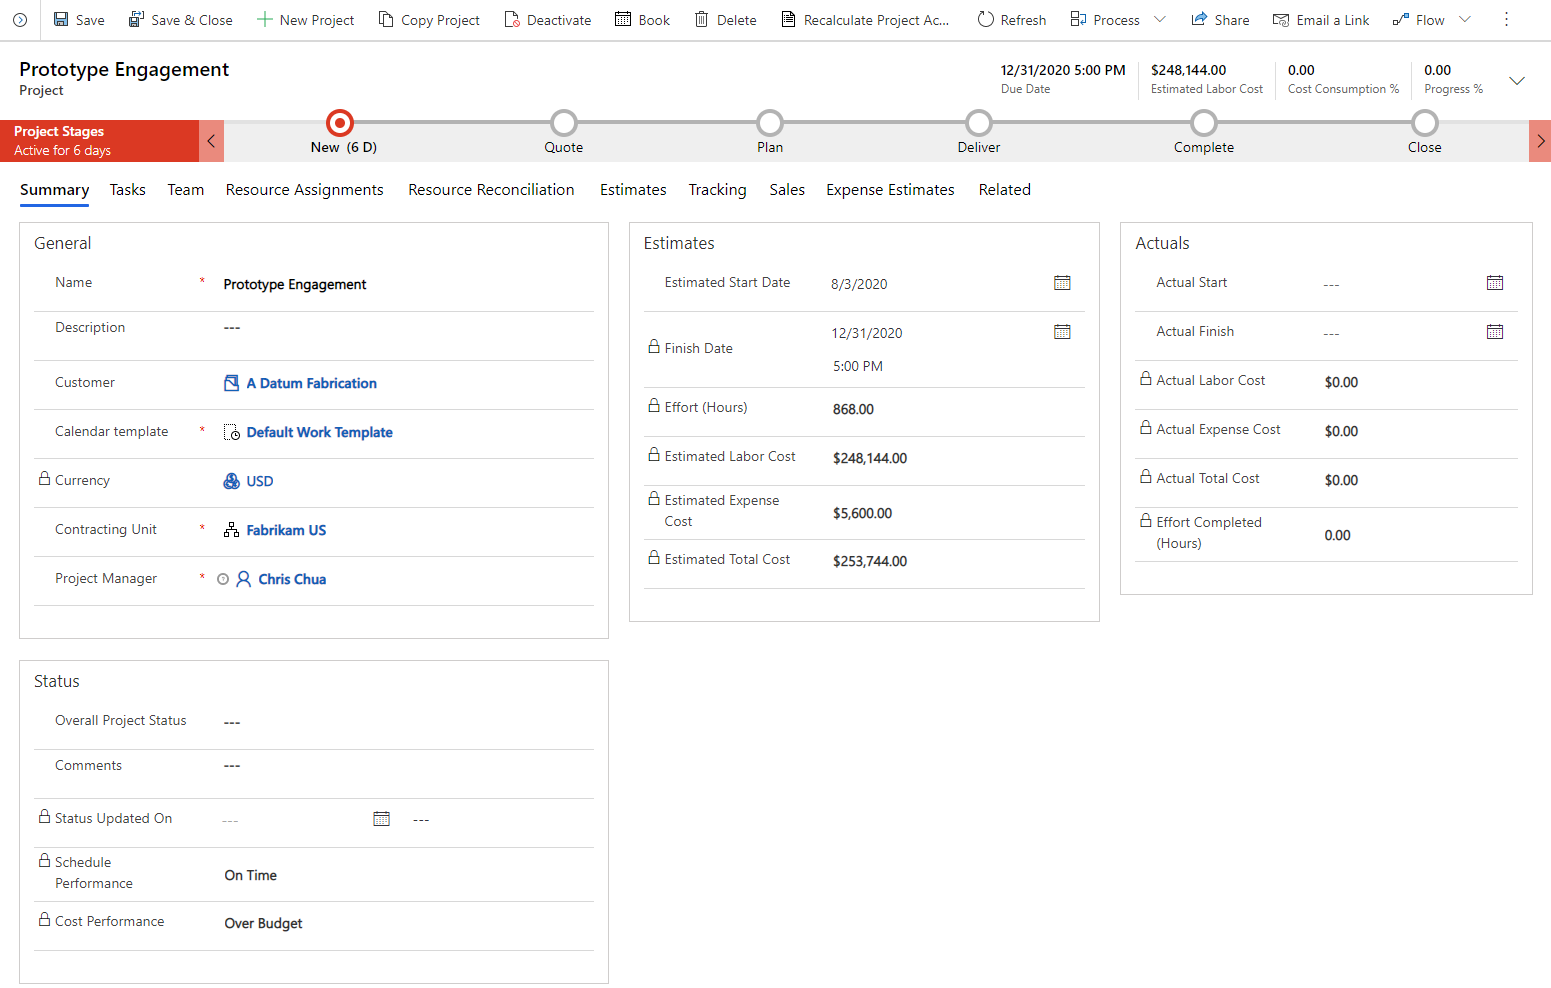
The main project form is separated into several tabs. Each tab represents a different level of detail within the project.
Summary: Provides a description of the project and aggregates both the planned and actual project performance.
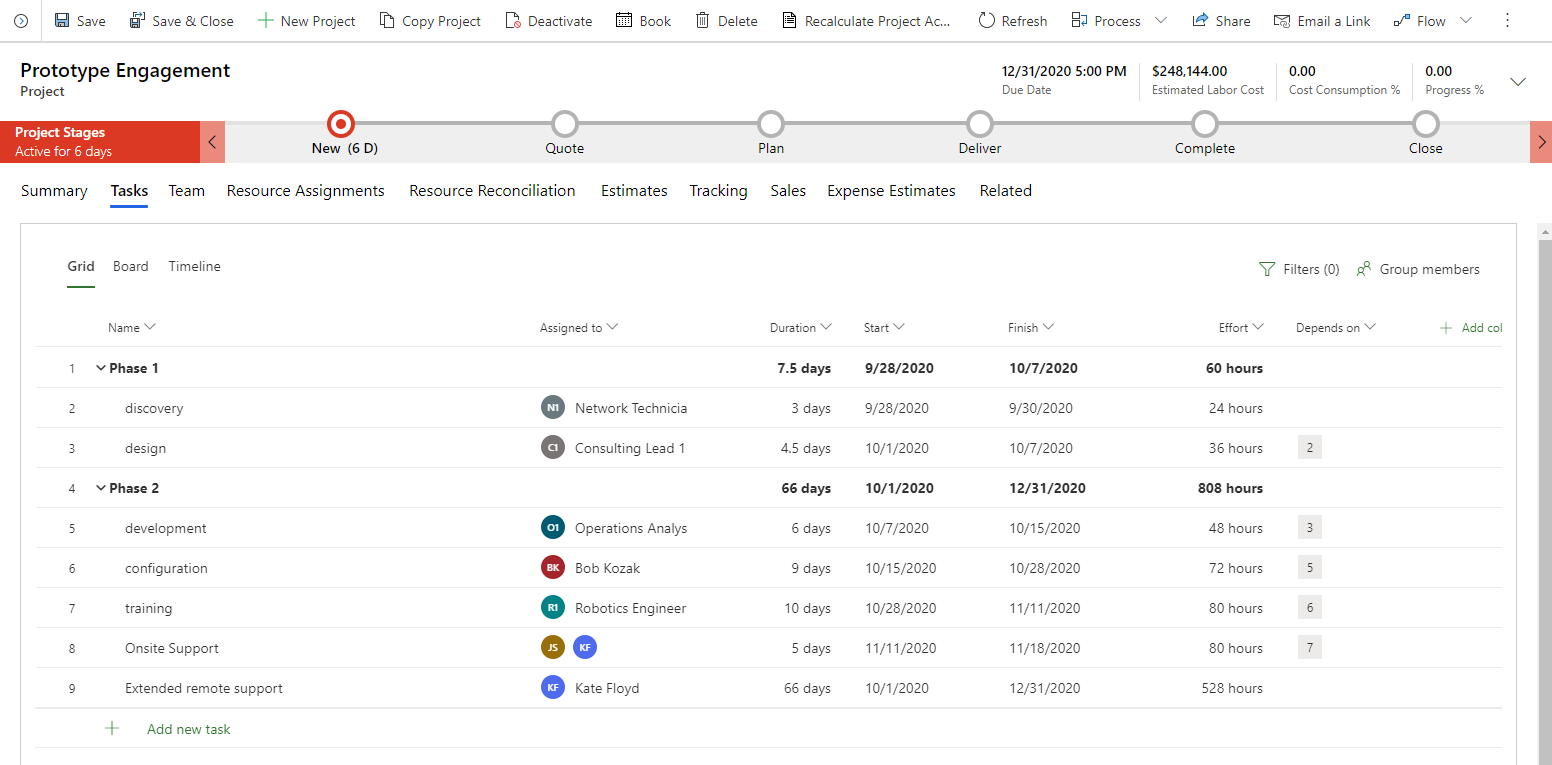
Tasks: Provides the details regarding the work breakdown structure represented by a grid view, board view, and a gantt.
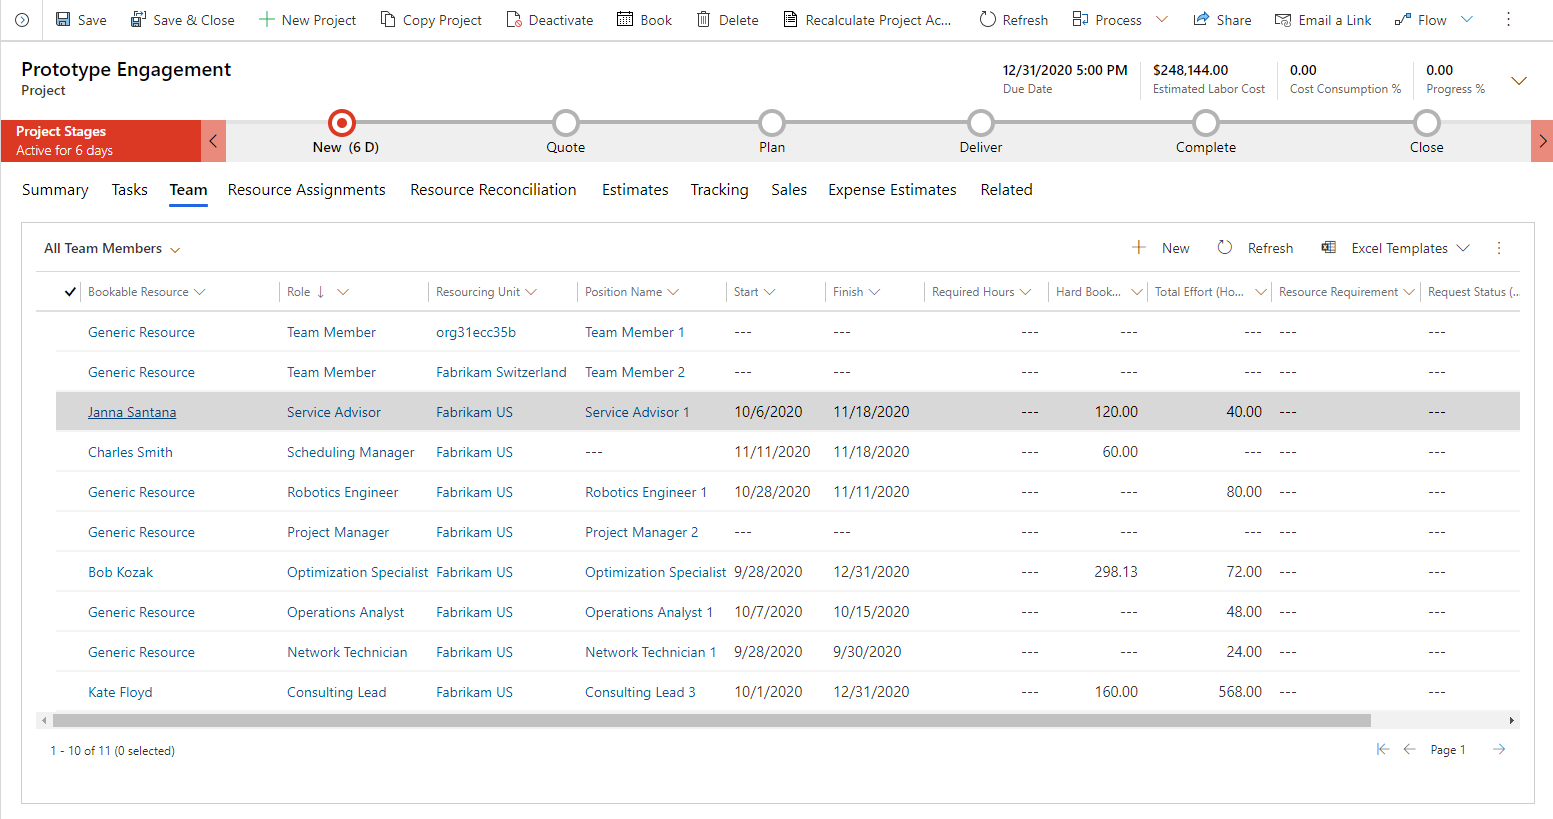
Team: Provides details regarding the project participants. The assigned effort of each team member is also summarized in this view.
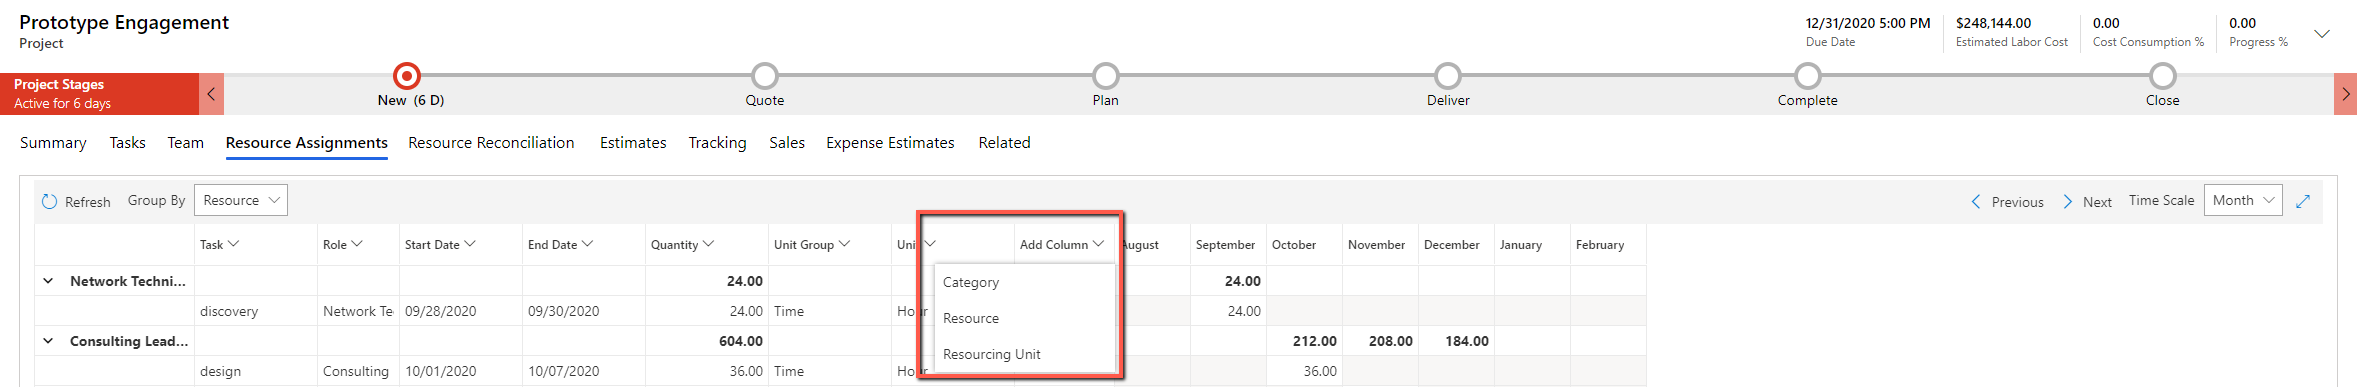
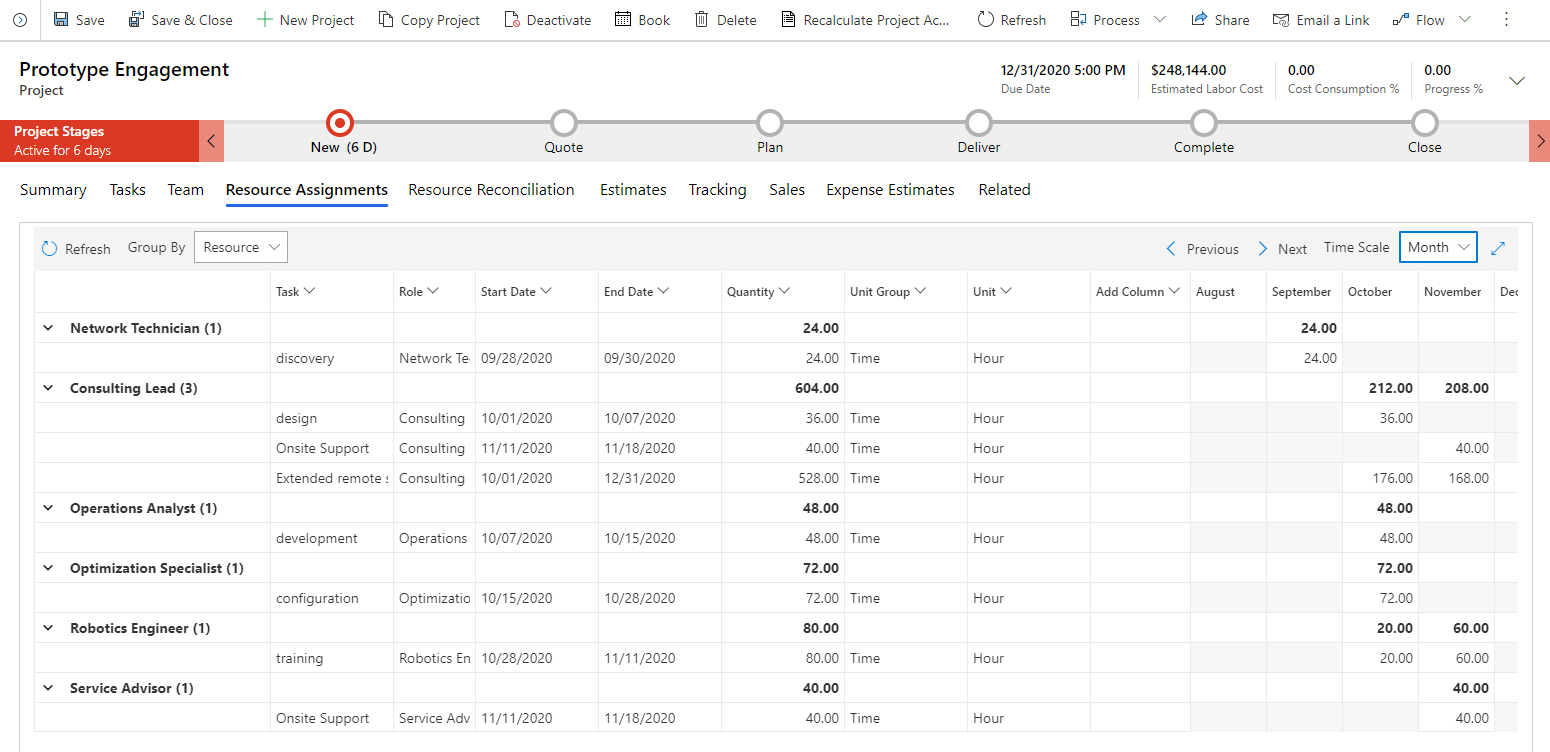
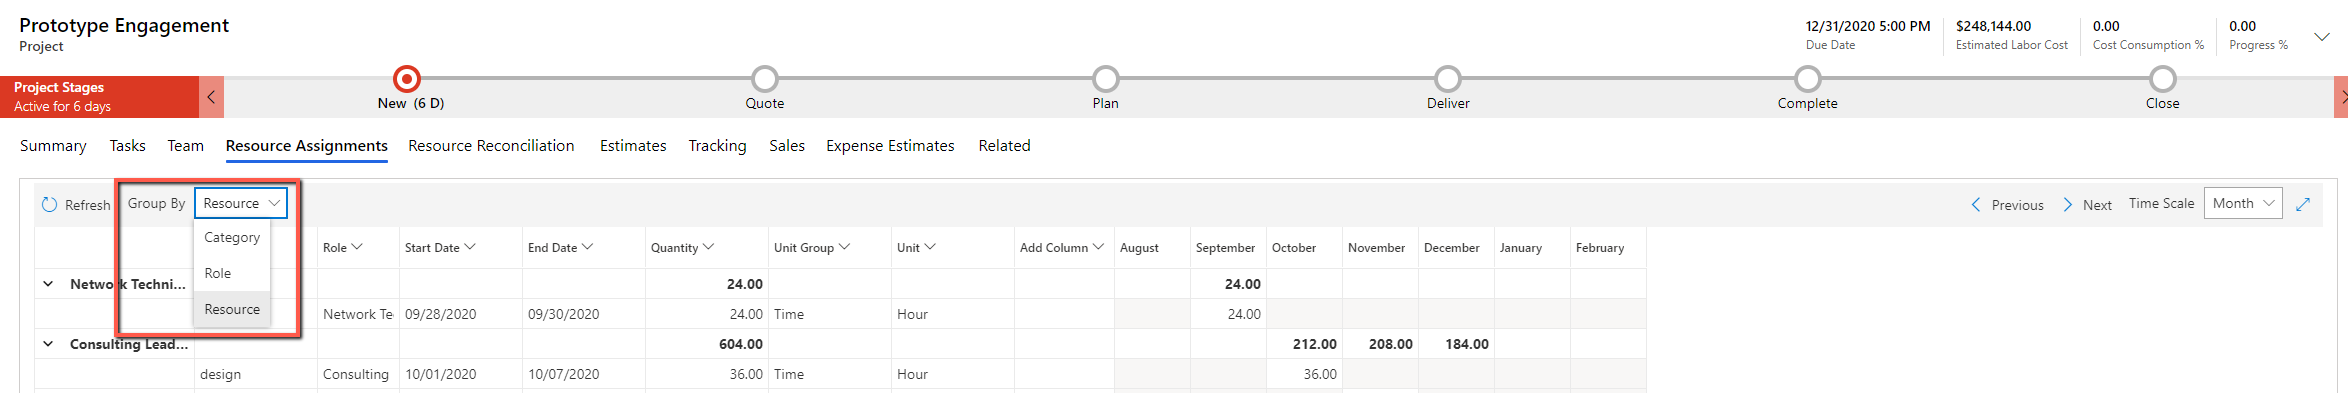
Resource assignments: Provides a time-phased view of the effort for each resource on a project.
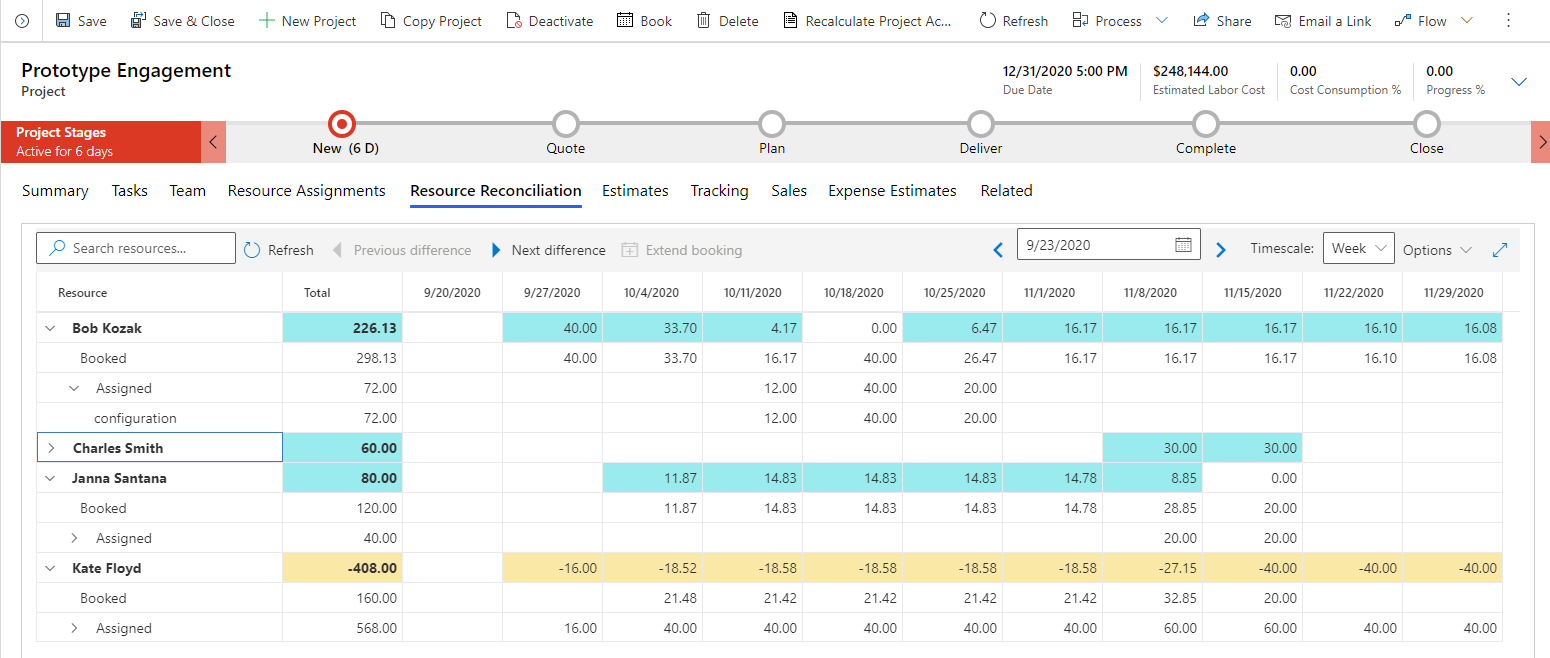
Resource reconciliation: Provides a time-phased view of the differences between the assignments of each named resource and their bookings.
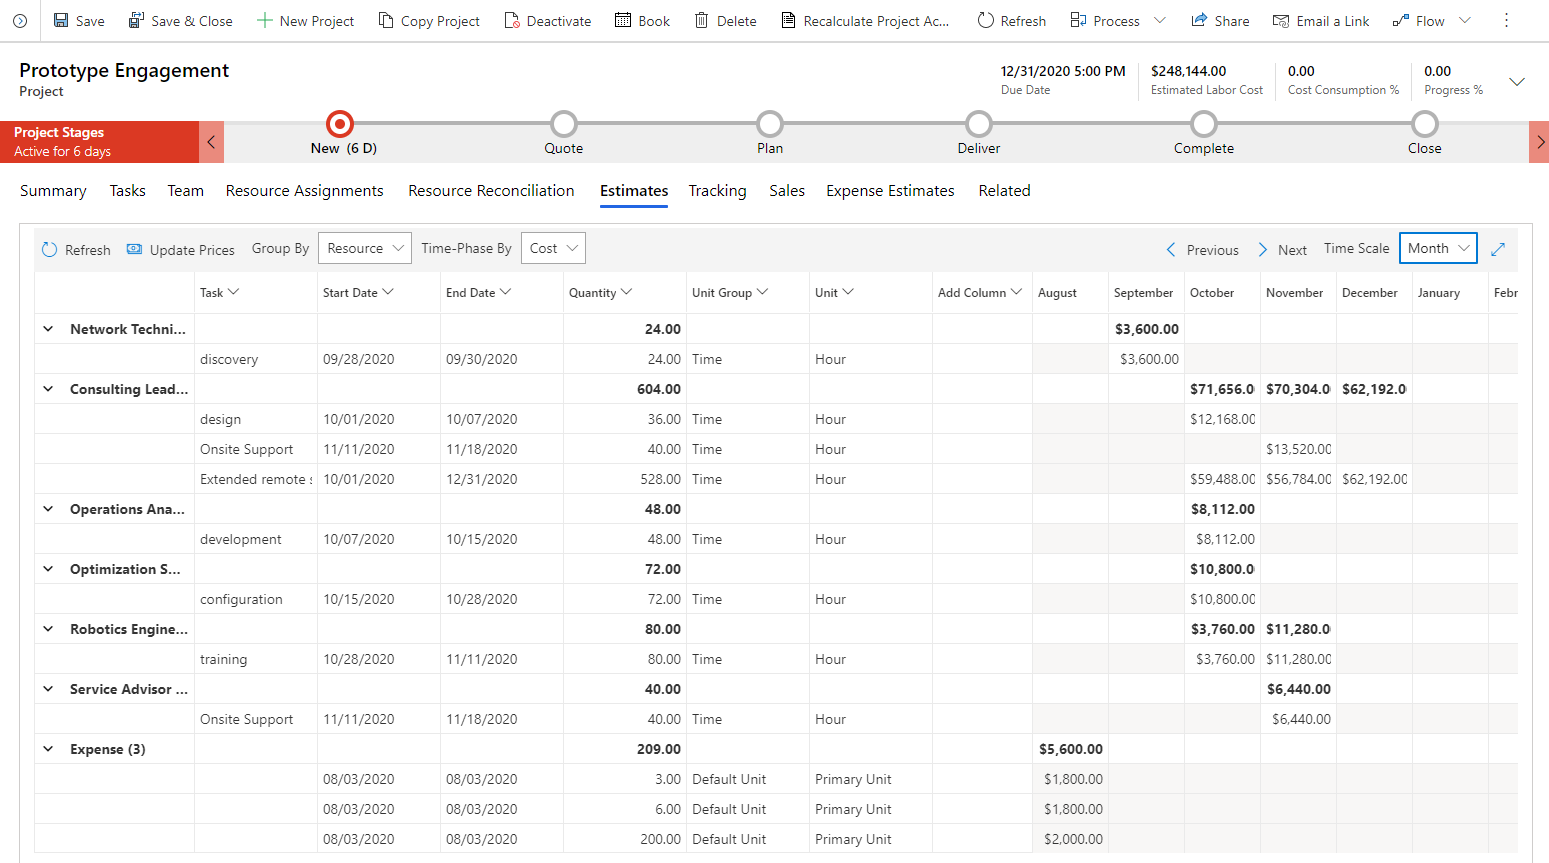
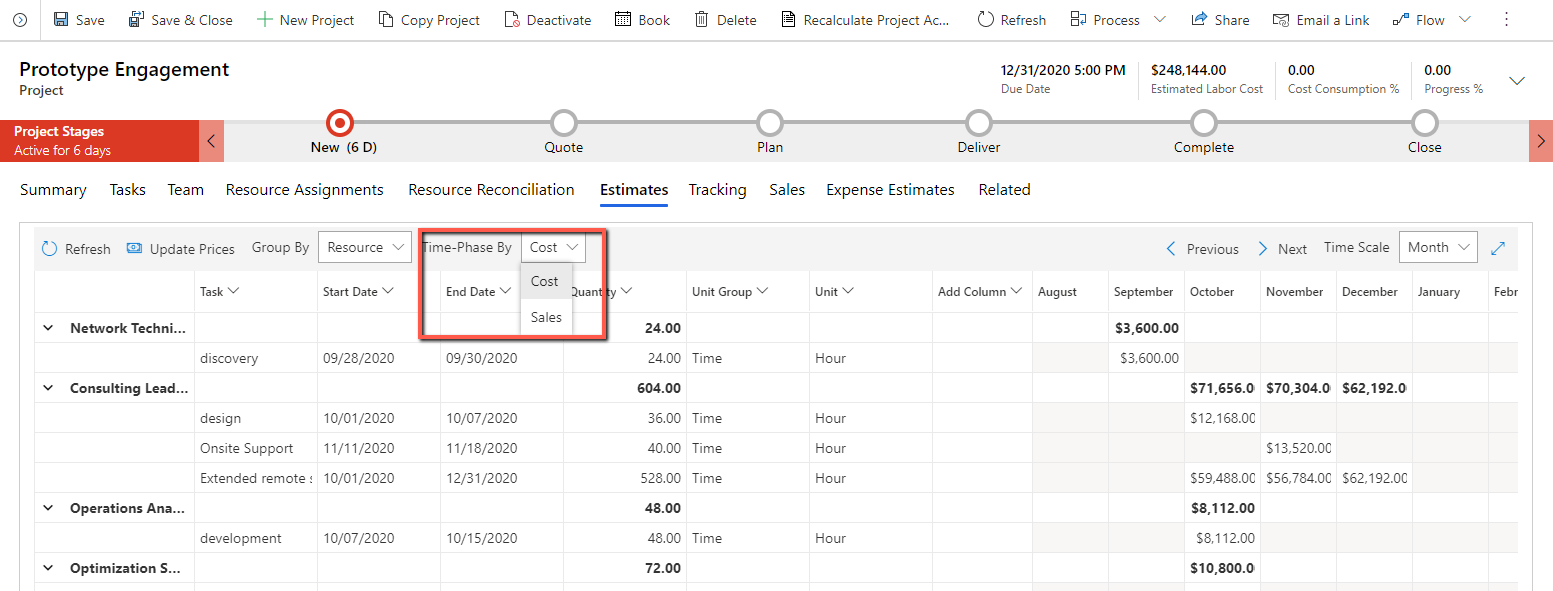
Estimates: Provides a time-phased view of the cost and sales estimates of a project.
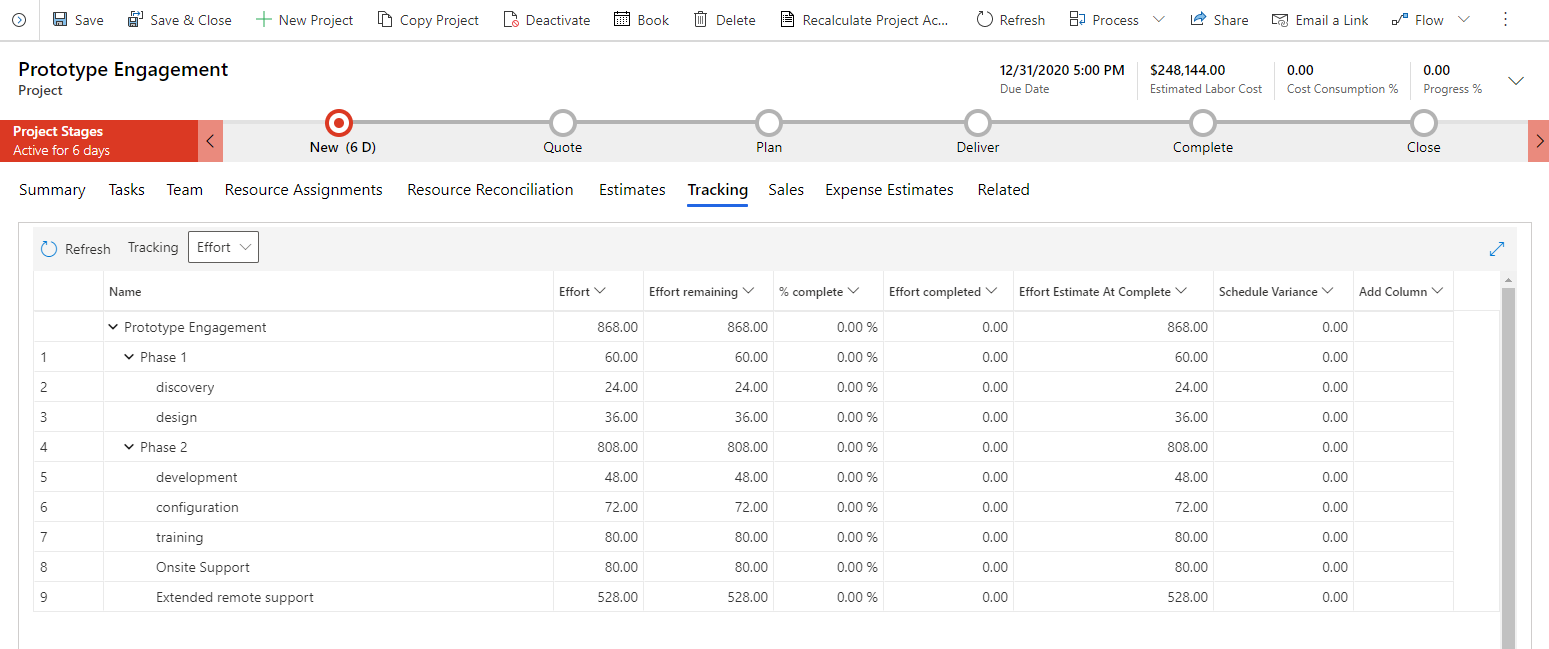
Tracking: Provides a view that shows the progress of tasks in the work breakdown structure for effort, cost, and sales.
Sales: Provides deep links to quotes and contracts associated with the project.
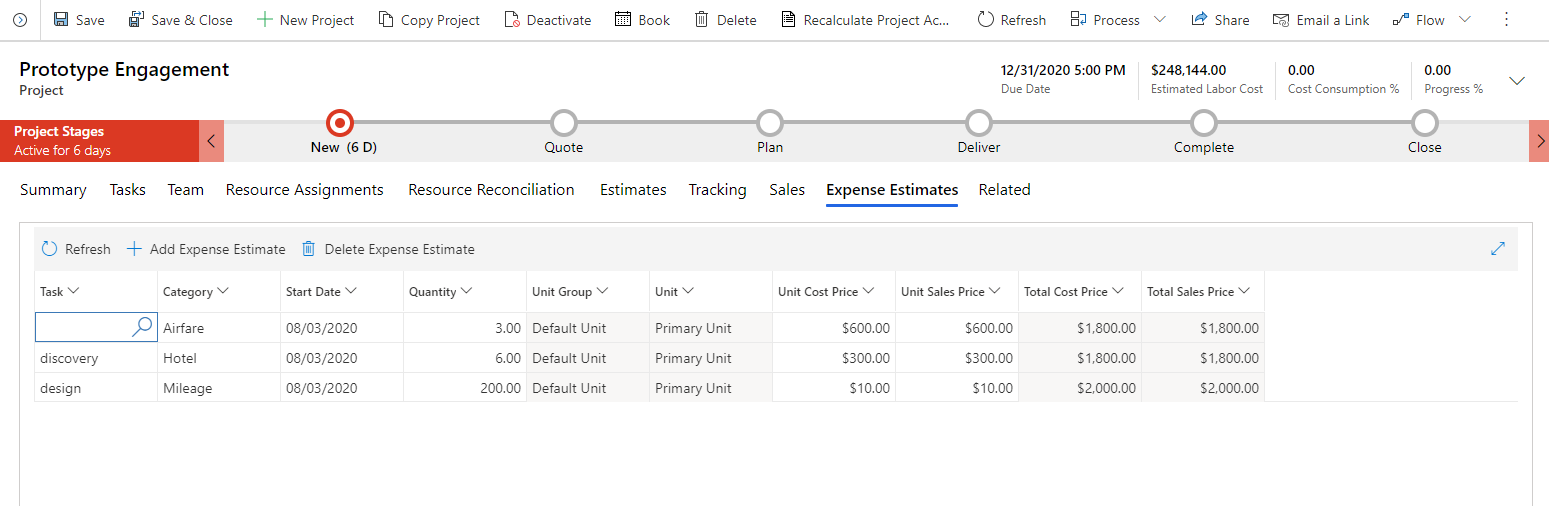
Expense Estimates: Provides a grid that defines project expenses based upon organizational expense categories.
Grid controls
The follow is a brief overview of the typical controls found on the various project planning tabs.
Refresh
Refresh: Retrieves the latest data from the server if any changes occurred after the grid was loaded.
Group by
Group by: Updates the grouping of the rows in the grid to reflect either resources, roles, or categories based on the user's needs.
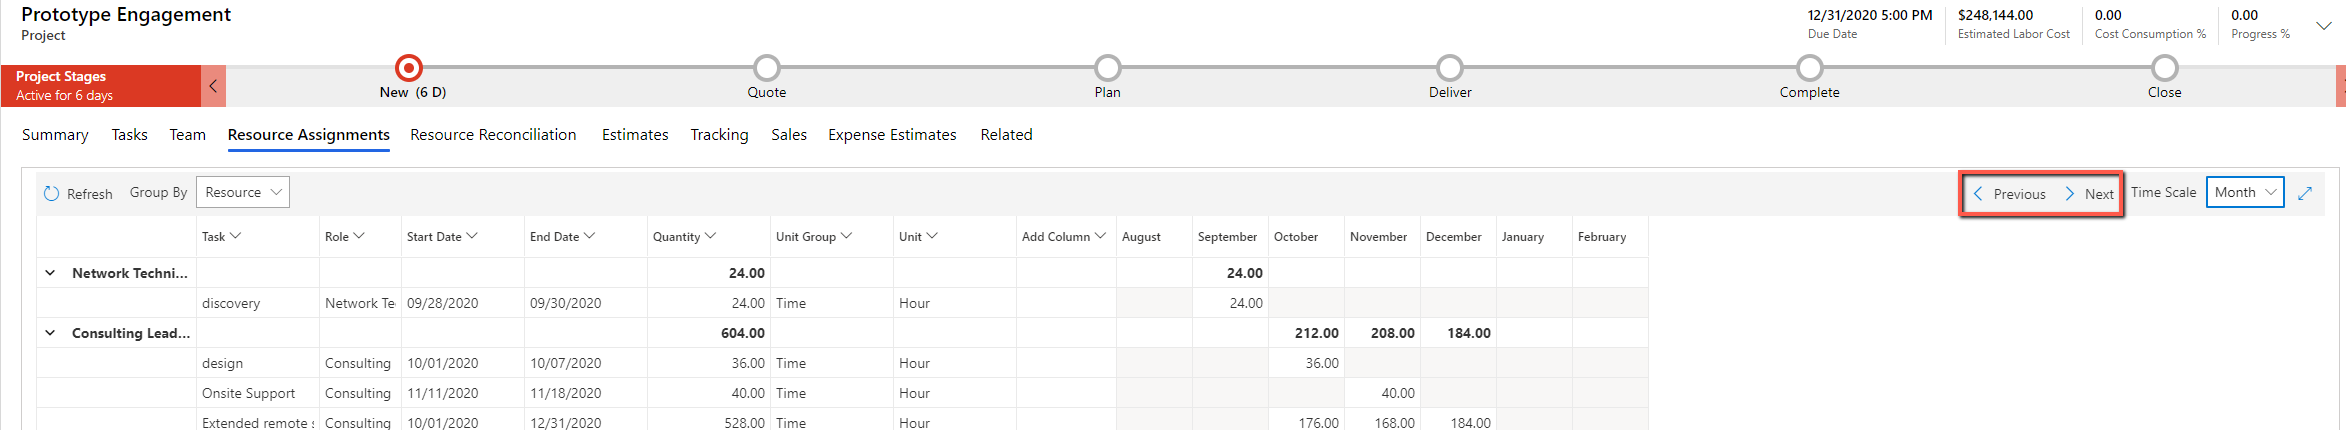
Previous/Next
Previous/Next: Update the visible time periods on the time-phased grids.
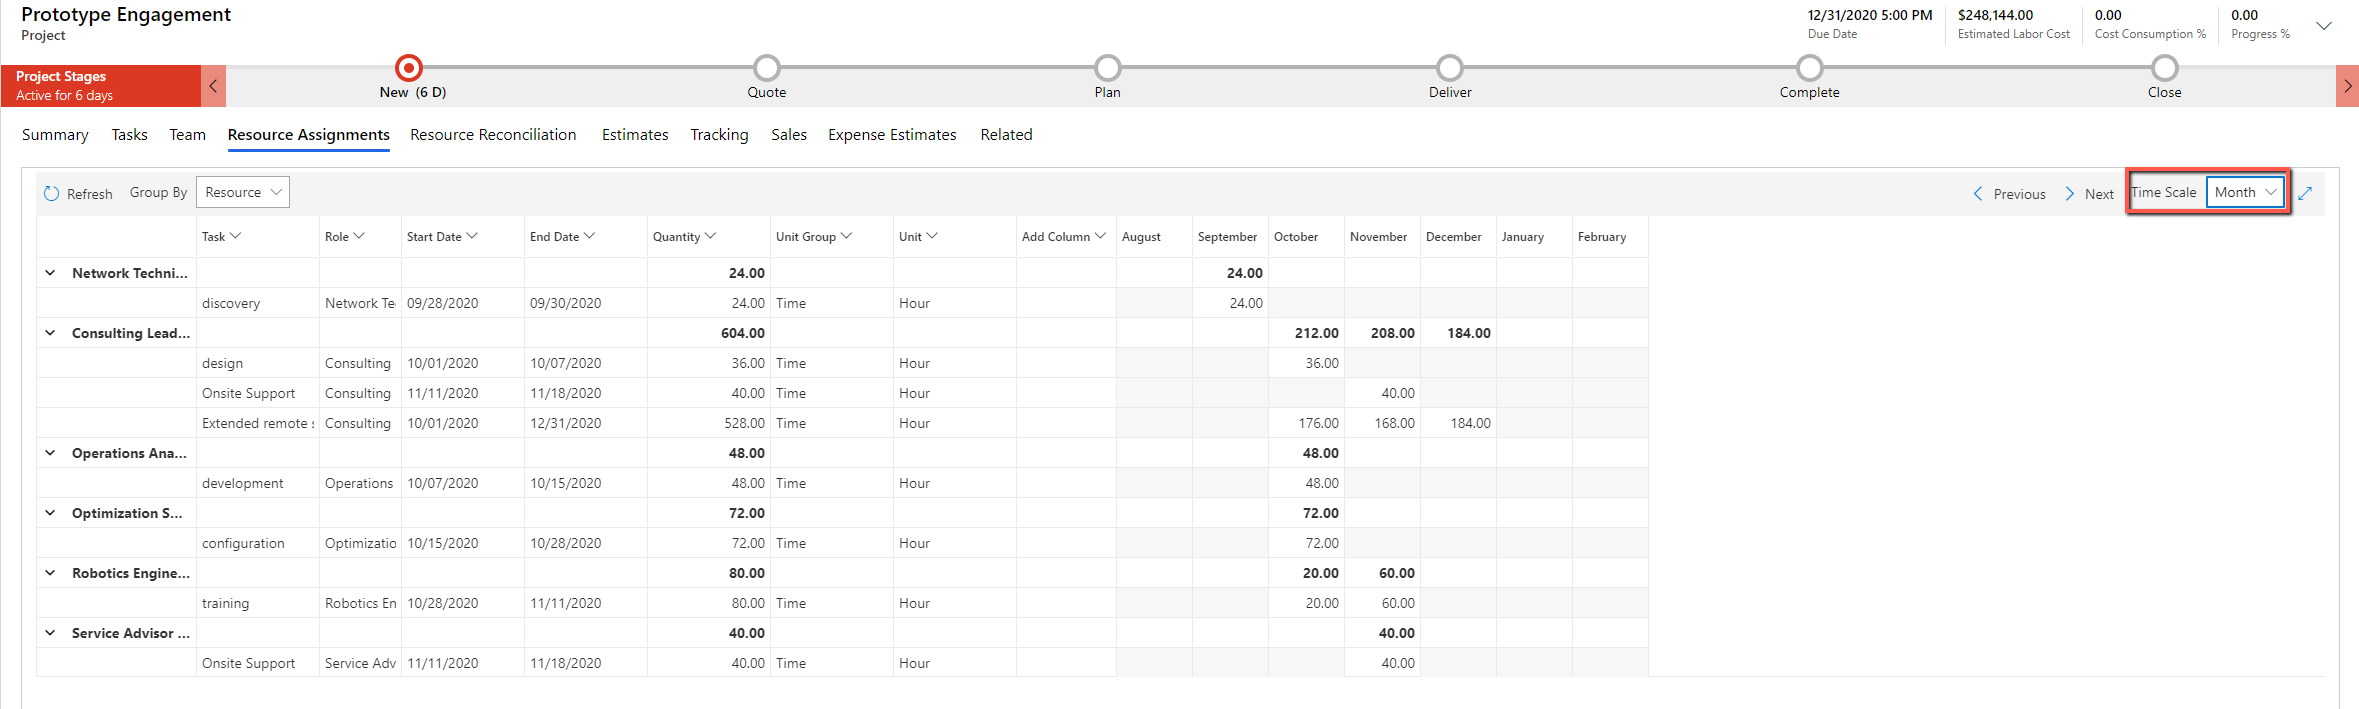
Timescale
Timescale: Change the aggregation of the time-phased data between days, weeks, months, and years.
Expand
Expand: Render the visible grid to full screen providing more ability to see additional roles.

Time-phase by
Time-phase by: Update the grouping of the rows in the grid to reflect cost estimates for sales estimates. This control also applies to the estimate script and the tracking grid.
Add column
Add column: Allows the user to define the visible columns in the grid. Only out-of-the-box columns can be added to the grids in the Project Planning form.