Note
Access to this page requires authorization. You can try signing in or changing directories.
Access to this page requires authorization. You can try changing directories.
Important
This content is archived and is not being updated. For the latest documentation, go to What's new and planned for Dynamics 365 Business Central. For the latest release plans, go to Dynamics 365, Power Platform, and Cloud for Industry release plans.
| Enabled for | Public preview | General availability |
|---|---|---|
| Admins, makers, marketers, or analysts, automatically |  Mar 1, 2023
 |
 Apr 1, 2023
 |
Business value
Developers often experience reduced responsiveness and delayed results when using static code analysis tools (AL cops) to find diagnostic issues. This can be annoying and affect their productivity, as they cannot react faster on the issues detected in the code. With this release we have improved the performance of the code analyzer framework, and added a setting to allow the developer to specifically choose the scope, which is analyzed. In addition, we've added some troubleshooting insights to allow understanding bad performing rules, allowing turn-off of these for improved performance and logging bugs for them on AL GitHub.
Feature details
When you edit a project with code analysis enabled, the default behavior is that code analysis will run in the background. This means that every change will trigger a recalculation of the code analysis diagnostics. The analysis may run in the scope of the currently active file or the entire open project. By default, the scope is determined by the size of the workspace. For smaller projects, analysis will be performed on the entire active project and its dependent projects. When a larger workspace is detected, it will by default perform analysis only on the active file. This ensures that the analysis can run interactively regardless of the size of the project. The downside is that code analysis diagnostics won't be displayed for files, which aren't open in the editor.
The scope of the code analysis can be overridden through the backgroundCodeAnalysis setting. Its default value is File, which corresponds to the behavior just described. The Project value forces analysis to be performed on the entire project, with a significant performance penalty. For this reason, it's advised only for high-performance machines. The None option turns off background analysis entirely, so that it will only run during a full build.
It's possible to override the scope for a user or a specific workspace by using the appropriate settings file and not specifying the scope explicitly on the project settings.
Troubleshooting long-running code analysis rules
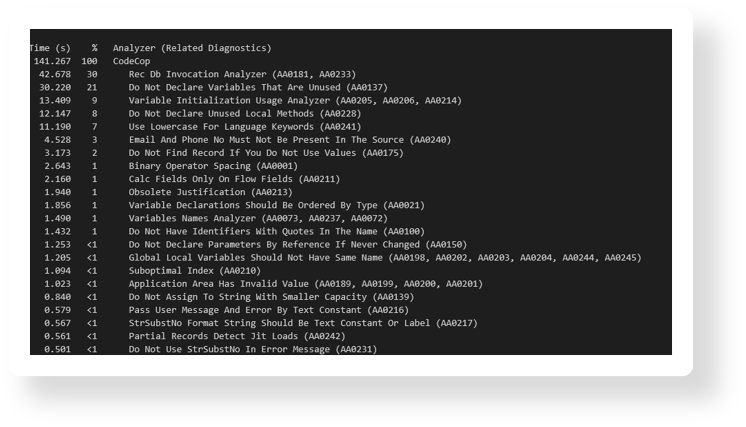
In addition to controlling the scope, it's possible to get statistics for the runtime of individual code analysis rules, with the intent of switching them off selectively if they're long-running on a specific project. Switching it off can be useful in the case where the default code analysis scope isn't performant enough or when it's a requirement to run code analysis for an entire project. By enabling the setting outputAnalyzerStatistics, a detailed overview of the runtime of each analysis rule and its corresponding diagnostics will be printed to the output. The output will be similar to the snippet shown in this section, where the total time and percentage of time spent by each rule is displayed in the appropriate column.

Tell us what you think
Help us improve Dynamics 365 Business Central by discussing ideas, providing suggestions, and giving feedback. Use the forum at https://aka.ms/bcideas.
Thank you for your idea
Thank you for submitting this idea. We listened to your idea, along with comments and votes, to help us decide what to add to our product roadmap.