View analytics for Copilot's impact on your business
Important
This content is archived and is not being updated. For the latest documentation, go to Welcome to Dynamics 365 Customer Service. For the latest release plans, go to Dynamics 365, Power Platform, and Cloud for Industry release plans.
| Enabled for | Public preview | Early access | General availability |
|---|---|---|---|
| Users by admins, makers, or analysts |  Jun 16, 2023
 |
- |  Oct 20, 2023
 |
Business value
Copilot in Customer Service uses generative AI to create an impact across various tasks such as completing customer conversations, triaging and closing cases, and drafting and sending email. The copilot report in historical analytics helps users understand the impact Copilot helps create across these various modalities.
Feature details
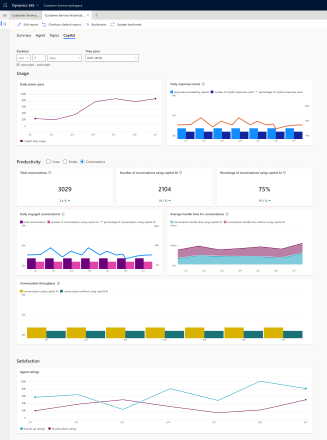
The copilot report in Customer Service historical analytics empowers supervisors and customer service managers to identify the impact that Copilot helps create across their entire customer service operation. With Copilot, customer service agents are able to complete various tasks related to conversations, cases, and email more easily.
The copilot report contains the following key metrics:
- Daily active users: Displays the number of unique users who used any of the copilot features in the last day.
- Percentage of copilot responses used: Displays the number of responses that Copilot generated across all copilot features, and the percentage of those that were actually consumed by the agents.
- Agent ratings: Users are allowed to provide a thumbs-up or thumbs-down on Copilot when they use any of its features. The trend of the aggregated data provides an understanding of user satisfaction.
The following metrics display two values that indicate when Copilot is and isn't used:
- Average handle time for conversations: Displays the impact on the average handle time metric of conversations.
- Average days to close for cases: Also known as case resolution time.
- Average email response time: Displays the time taken to draft and send an email.
These measurements help demystify for a customer service manager how their agents are interacting with the copilot capabilities and how they help improve their business.

Geographic areas
This feature will be released into the following Microsoft Azure geographic areas:
- Germany
- Switzerland
- United Arab Emirates
- United States
- Europe
- Asia Pacific
- United Kingdom
- Australia
- Brazil
- Canada
- India
- Japan
- France
See also
Analyze the impact of AI-enhanced customer service with Copilot analytics (blog)