Note
Access to this page requires authorization. You can try signing in or changing directories.
Access to this page requires authorization. You can try changing directories.
Important
This content is archived and is not being updated. For the latest documentation, go to What's new or changed in Business Central. For the latest release plans, go to Dynamics 365, Power Platform, and Cloud for Industry release plans.
| Enabled for | Public preview | General availability |
|---|---|---|
| Users, automatically |  Oct 1, 2024
 |
 Oct 1, 2024
 |
Business value
Three releases ago we launched the in-client profiler, a very powerful tool for investigating performance issues across extensions. Since then, profiling has become essential to identify application performance problems for customers, partners, and support, and it's the main performance troubleshooting tool for partners.
However, due to its current nature of being an interactive capture, acquiring a performance profile requires well-defined repro steps and collaboration across stakeholders.
To make it easier and faster for customers, consultants, pro developers, partners, and Microsoft support to capture a profile, and thereby lower manual collaboration and time-to-mitigate, this release adds the additional support for capturing performance profiles automatically and noninteractively in the background, based on well-defined schedule rules triggering capture. Captured profile details can then be analyzed afterward.
Feature details
In addition to the existing interactive way of capturing a performance profile—by starting the profile, performing repro steps in the client, stopping the profiler, and then analyzing the results—a new rule-based scheduling mode for capturing profiles in the background is added.
With this, a customer admin, consultant, support person, or developer can set up a specific scheduled rule—for example, to profile as a given user and session type for a given duration. Once the rule is defined and enabled, the server will trigger a profile each time the rule is met. At the end of the duration, profiling will stop, and the results can be inspected to see if there are any performance issues, including intermittent or long-running ones.
To create a new profile rule schedule, open the Profiler Schedules page. This lists the defined schedules, and the additional schedule details. From here, you can create a new schedule.

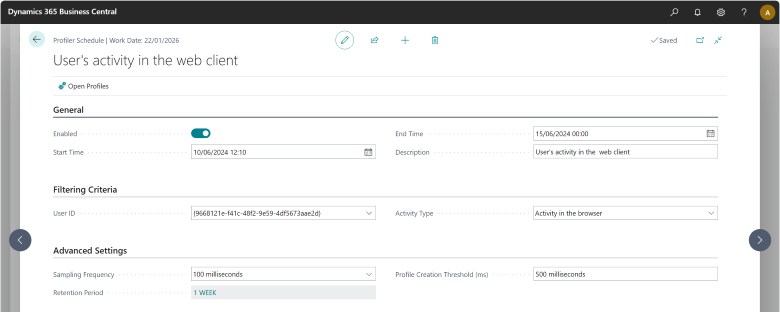
When creating a new profile capture schedule, you can define a number of rules and settings:
- Enabled: Allows you to enable or disable the defined schedule.
- Start and End Time: Sets the duration for when the schedule is active and can trigger profile captures.
- Description: Add your own description of the profile schedule.
- User ID: Choose whether the scheduling only captures profiles for a specific user.
- Activity Type: Select the kind of activity that will trigger capturing profiles. It can be background tasks, or activity in the browser (such as opening a page).
- Sampling frequency: Choose the sampling frequency used when capturing profiles. You can select the same options as in the existing interactive in-client performance profiler, or AL profiler in Visual Studio Code.
- Profile creation threshold: Specify the minimum duration of the profile for it to be saved.
- Retention period: Specify how long captured profiles for this schedule should be kept.
The following example shows how you can set up a schedule for capturing profiles for a specific user's browser activity for a 5-day period.

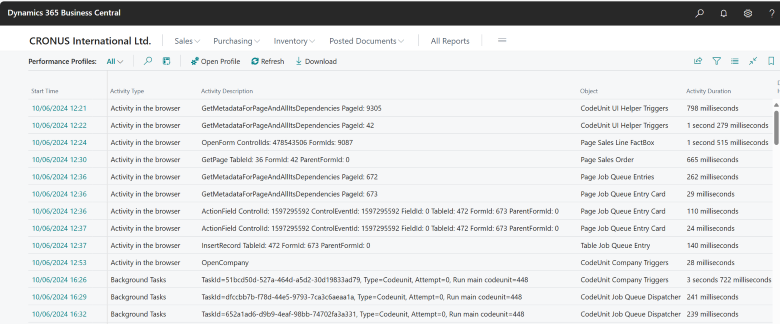
Once profile schedules have been defined, enabled, and run, you can view all the captured profiles in the Performance Profiles list page, and open a selected profile for detailed analysis, similar to what's known from the in-client performance profiler.

Tell us what you think
Help us improve Dynamics 365 Business Central by discussing ideas, providing suggestions, and giving feedback. Use the forum at https://aka.ms/bcideas.