Note
Access to this page requires authorization. You can try signing in or changing directories.
Access to this page requires authorization. You can try changing directories.
Use predictive forecasting to analyze the revenue outcome by providing forecast projections based on your data.
Understand the prediction column and details in a forecast
Predictive forecasting helps sellers and managers improve their forecast accuracy by providing forecast projections based on data. To achieve this, predictive forecasting uses AI-driven models that look at historical data and the open sales pipeline to predict future revenue outcome.
The Prediction column shows the predicted revenue for each seller and manager. Predictions are based on the Status field of an opportunity. To optimize the accuracy of the predictions, ensure the Forecast Category values are kept in sync with the Status field. For the out-of-the-box forecast category, a workflow ensures that when an opportunity is closed as Won or Lost, the forecast category is updated with the proper value.
Note
If sufficient data isn't available for predictive forecasting, an error message is displayed and the Prediction column is left empty.
Prerequisites
Review the following prerequisite before you start using predictive forecasting:
Ensure that predictive opportunity scoring is enabled and at least one model is configured. To learn more, see Configure predictive opportunity scoring.
Ensure that the predictive forecasting feature is enabled and a forecast is configured accordingly. To learn more, see About premium forecasting.
Prediction column
Open a forecast that includes a Prediction column. To learn more, see View a forecast.
The following screen shows an example of a Prediction column.

When you hover over the information icon on the column header, the last recalculation date of the prediction is shown. Predictions are recalculated after every seven days; you can't trigger a manual recalculation.
Prediction details
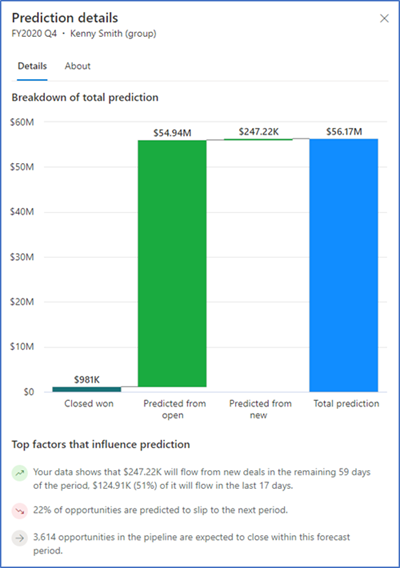
Select a value in the prediction column to display the Prediction details pane.

The graph in the Prediction details pane consists of the following values:
Closed won: Total actual revenue of opportunities that have been closed as won during the current forecast period.
Predicted from open: Total estimated revenue from open opportunities that are predicted to close during the current forecasting period and are contributing to the prediction.
Predicted from new: Total estimated revenue from new opportunities that are predicted to close during the current forecasting period and are contributing to the prediction.
Total prediction: Total predicted amount for the current forecasting period.
The top factors that influence the prediction are displayed below the graph. These factors help you to understand the key points of the graph. As many as five of these factors will appear.
Note
In order for Prediction details to be displayed, an administrator or forecast manager must enable prediction factors.
The top prediction factors are categorized into three types:
- A green icon with an upward-trending arrow (
 ) represents a positive influencing factor.
 - A red icon with a downward-trending arrow (
 ) represents a negative influencing factor.
 - A gray icon with a horizontal arrow (
 ) represents a neutral influencing factor.
The following image shows an example of a Top factors that influence prediction section.

| Icon | Influencing factor |
|---|---|
| The top positive influencing factor is that $247.22K will flow from new deals in the remaining 59 days of the period, and $124.91K (51%) of it will flow in the last 17 days. | |
| The negative influencing factor is that 22% of opportunities are predicted to slip to the next period. | |
| The neutral influencing factor is that 3,614 opportunities in the pipeline are expected to close within this forecast period. |
Can't find the feature in your app?
There are a few possibilities:
- You don't have the necessary license to use this feature. Check out the comparison table and the licensing guide to see which features are available with your license.
- You don't have the necessary security role to use this feature.
- To configure or setup a feature, you need to have the Administration and customization roles
- To use sales-related features, you need to have the Primary sales roles
- Some tasks require specific Functional roles.
- Your administrator hasn't turned on the feature.
- Your organization is using a custom app. Check with your administrator for exact steps. The steps described in this article are specific to the out-of-the-box Sales Hub and Sales Professional apps.