Note
Access to this page requires authorization. You can try signing in or changing directories.
Access to this page requires authorization. You can try changing directories.
Knowing how accurate a predictive scoring model is helps you decide whether the model is ready for use or needs to be fine-tuned for higher accuracy. It also helps you convince your leadership team and sellers to adopt the model for improved business outcomes.
The metrics described in this article apply to both opportunity scoring and lead scoring.
Factors that influence accuracy
A predictive scoring model calculates the likelihood that an opportunity or a lead will result in a sale. The accuracy of the model depends on the following factors:
- The quality and amount of the data available for training the model
- The business process flow and filters that you select
- The stages and attributes you select, if the model uses per stage modeling
The model is trained using 80% of the closed opportunities or leads in the training dataset. It's validated using the remaining 20% as a test dataset, which consists of the most recent records. The model's accuracy is calculated using the validated test dataset based on parameters such as true positives, false positives, and so on.
View accuracy and performance metrics
Go to Change area in the lower-left corner of the Sales Hub app, and select Sales Insights settings.
On the site map under Predictive models, select Opportunity scoring or Lead scoring.
In the Select model list, select a model.
Select the Performance tab.
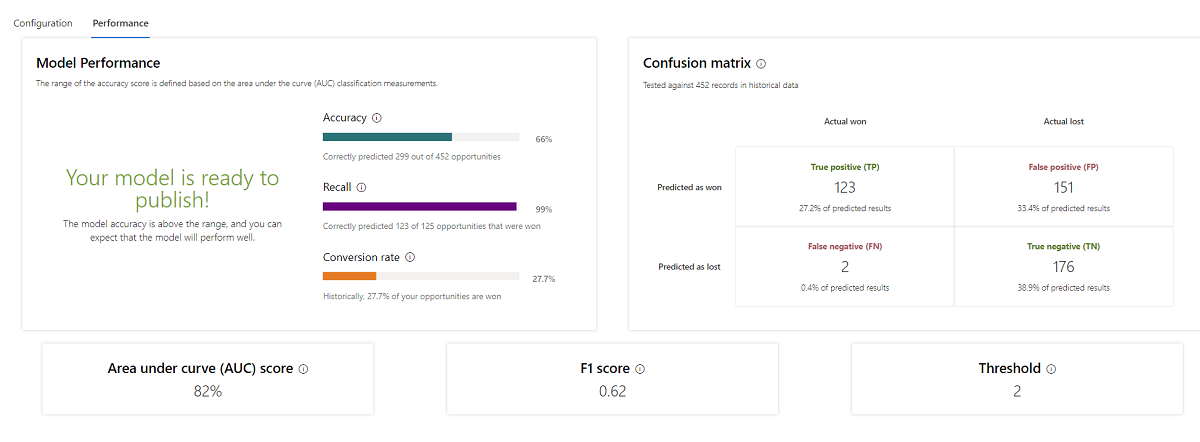
The Performance tab displays the following metrics. If you don't see any metrics in the Performance tab, edit and retrain an opportunity scoring model.
Model Performance: Specifies whether the model is ready to publish based on the following parameters:
Accuracy: How often the model made correct predictions, either positive or negative. This metric is most useful when the dataset is balanced, and the cost of false positives and false negatives is the same. The accuracy score is calculated using the following formula:
Accuracy = (TP + TN) / (Total number of opportunities or leads scored) *100
Recall: How often the model predicted a positive outcome correctly compared to the actual positives. A low recall score means the model is predicting fewer true positives. The recall score is calculated using the following formula:
Recall = TP / (TP + FN) *100
Conversion rate: The percentage of opportunities or leads that were qualified or won per historical data, or the likelihood that an opportunity or lead will convert. The model uses this value to determine how an attribute will influence the predictive score. The conversion rate is calculated using the following formula:
Conversion rate = (TP + FN) / (Total number of opportunities or leads scored) *100
Confusion matrix: How well your model predicted the outcomes when it was tested against historical data. The matrix displays the number of true positives, true negatives, false positives, and false negatives.
Metric Predicted Actual True positive (TP) Yes Yes True negative (TN) No No False positive (FP) Yes No False negative (FN) No Yes Area under the curve: The area under the curve (AUC) score of the model. The AUC score determines the probability that a model will rank a randomly chosen positive instance (a won opportunity or a qualified lead) higher than a randomly chosen negative one (a lost opportunity or a disqualified lead). A model with a higher AUC is better at predicting true positives and true negatives.
F1 score: The F1 score calculated based on the model's precision and recall scores. The F1 score determines the quality of the model even when the data is unbalanced.
Threshold: The threshold at which the lead or opportunity is considered qualified or won. For example, if the threshold is 45, opportunities with a score greater than 45 will be predicted as won. The threshold is selected to optimize the F1 score.
Example: Model performance metrics
Let's look at the prediction results for a sample dataset of 1,000 opportunities:
| Data | Number of opportunities |
|---|---|
| True positive | 650 |
| False positive | 200 |
| True negative | 100 |
| False negative | 50 |
The model predicted 850 (TP + FP) opportunities would be won; however, only 650 (TP) opportunities were actually won. Similarly, the model predicted 150 (TN + FN) opportunities would be lost, but only 100 (TN) opportunities were actually lost.
The following table shows the metrics for the data.
| Metric | Score |
|---|---|
| Accuracy | (650 + 100) / 1,000 = 75% |
| Recall | 650 / (650 + 50) = 92% |
| Conversion rate | (650 + 50) / 1,000 = 70% |
Improve model performance
If your model isn't ready to publish or isn't performing well, try the following steps to improve its scores.
- Review the attributes it uses.
- View attribute insights to understand their influence on the model's overall prediction.
- Ignore empty values for attributes that have a higher percentage of empty values and may be contributing to false positives or false negatives.
- Include intelligent fields to help a lead scoring model distinguish between factors that improve or harm the score.
- Use per stage modeling in an opportunity scoring model to choose attributes to apply to each business process stage.
- Refine the filter criteria, time period for training data, or other model configurations. For example, if you've chosen two years as the time period for training data and there are too many test or incorrect records during that period, choose a shorter time period, such as six months or one year, when the quality of your data is better.
Can't find the feature in your app?
There are a few possibilities:
- You don't have the necessary license to use this feature. Check out the comparison table and the licensing guide to see which features are available with your license.
- You don't have the necessary security role to use this feature.
- To configure or setup a feature, you need to have the Administration and customization roles
- To use sales-related features, you need to have the Primary sales roles
- Some tasks require specific Functional roles.
- Your administrator hasn't turned on the feature.
- Your organization is using a custom app. Check with your administrator for exact steps. The steps described in this article are specific to the out-of-the-box Sales Hub and Sales Professional apps.
Related information
Prioritize leads through scores
Configure predictive lead scoring
Configure predictive opportunity scoring