Getting visibility into the underlying opportunities that are contributing to the forecast values helps the sales team to focus on specific opportunities and take action.
License and role requirements
Requirement type
You must have
License
Dynamics 365 Sales Premium or Dynamics 365 Sales Enterprise More information: Dynamics 365 Sales pricing
Security roles
Any primary sales role, such as salesperson or sales manager More information: Primary sales roles
View underlying opportunities
To understand which opportunities are affecting forecast values, select one of the following options:
Select a row to show all opportunities, regardless of forecast category.
Select a cell to show only the opportunities that match the roll-up column value.
Note
Underlying opportunities won't be displayed for Quota and simple column types, because no opportunities contribute to calculating their values; you manually upload these values through an Excel workbook.
The opportunities you see in the table depend on the role assigned to you in the hierarchy that was used to configure the forecast.
For example, Alyce Durham is a manager and Nicolas Frizzell reports to Alyce. Nicolas can see only their own underlying opportunities, while Alyce can their own and Nicolas's underlying opportunities.
You can view and edit underlying opportunities in two ways:
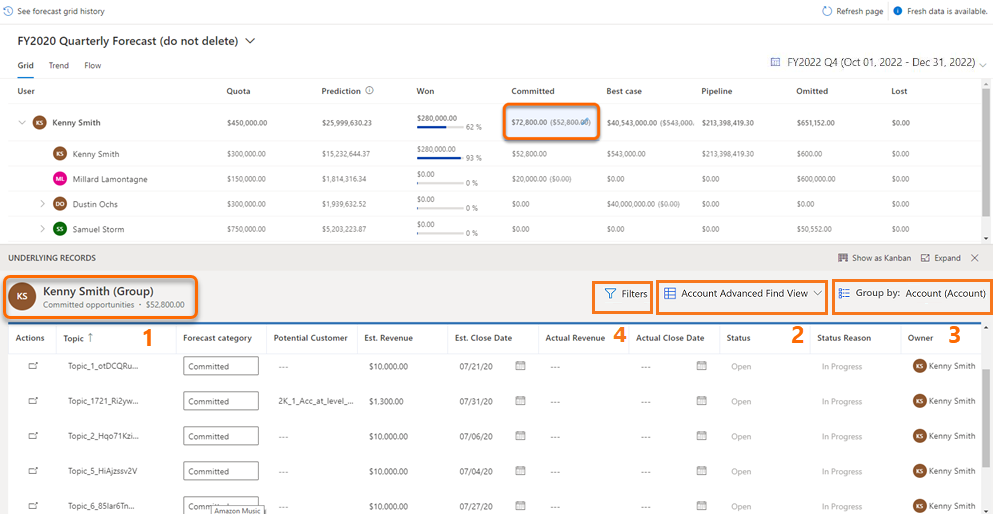
With the enhanced grid, you can view and edit related entity records also. The following screen is an example of the enhanced grid view of underlying records:
General information: You can identify the owning user or team of the underlying records. Also, you can see the category of the underlying records—such as won, committed, or pipeline along with the total value of the category.
Note
Though you can update the forecast category of an opportunity in the grid, the options Won and Lost are disabled and can't be selected. These options are automatically updated when an opportunity is closed as won or lost; hence they shouldn't be updated manually. More information: Close opportunities as won or lost.
View selector: You can change the view of these records. By default, the view that was selected when the forecast was configured is displayed.
Group by: You can group the underlying opportunity records by using a related entity such as, account. For more information on how to use the Group by option with or without a filter, go to Filter the underlying opportunities of a forecast.
Filter: You can filter the underlying opportunities to view specific set of opportunities that you want to analyze or work on. For more information on how to use filters, go to Filter the underlying opportunities of a forecast.
Filter the underlying opportunities of a forecast
When you select a row in the forecast grid, you see the underlying opportunities that contribute to that row in the forecast. You can group and filter these opportunities to efficiently manage them and take necessary actions to finalize deals that matter the most.
To filter the underlying opportunities
Open a forecast, and select a row.
The underlying opportunities that contribute to the selected row are displayed.
(Optional) In the Group by field, select the entity (such as, account) that you want to use for grouping opportunities.
Select the View underlying rollup records (the plus sign (+)) next to a group.
The opportunities associated with that account are displayed. For more information on how filters work when the underlying records are grouped, go to Example: Grouping and filtering the underlying opportunities.
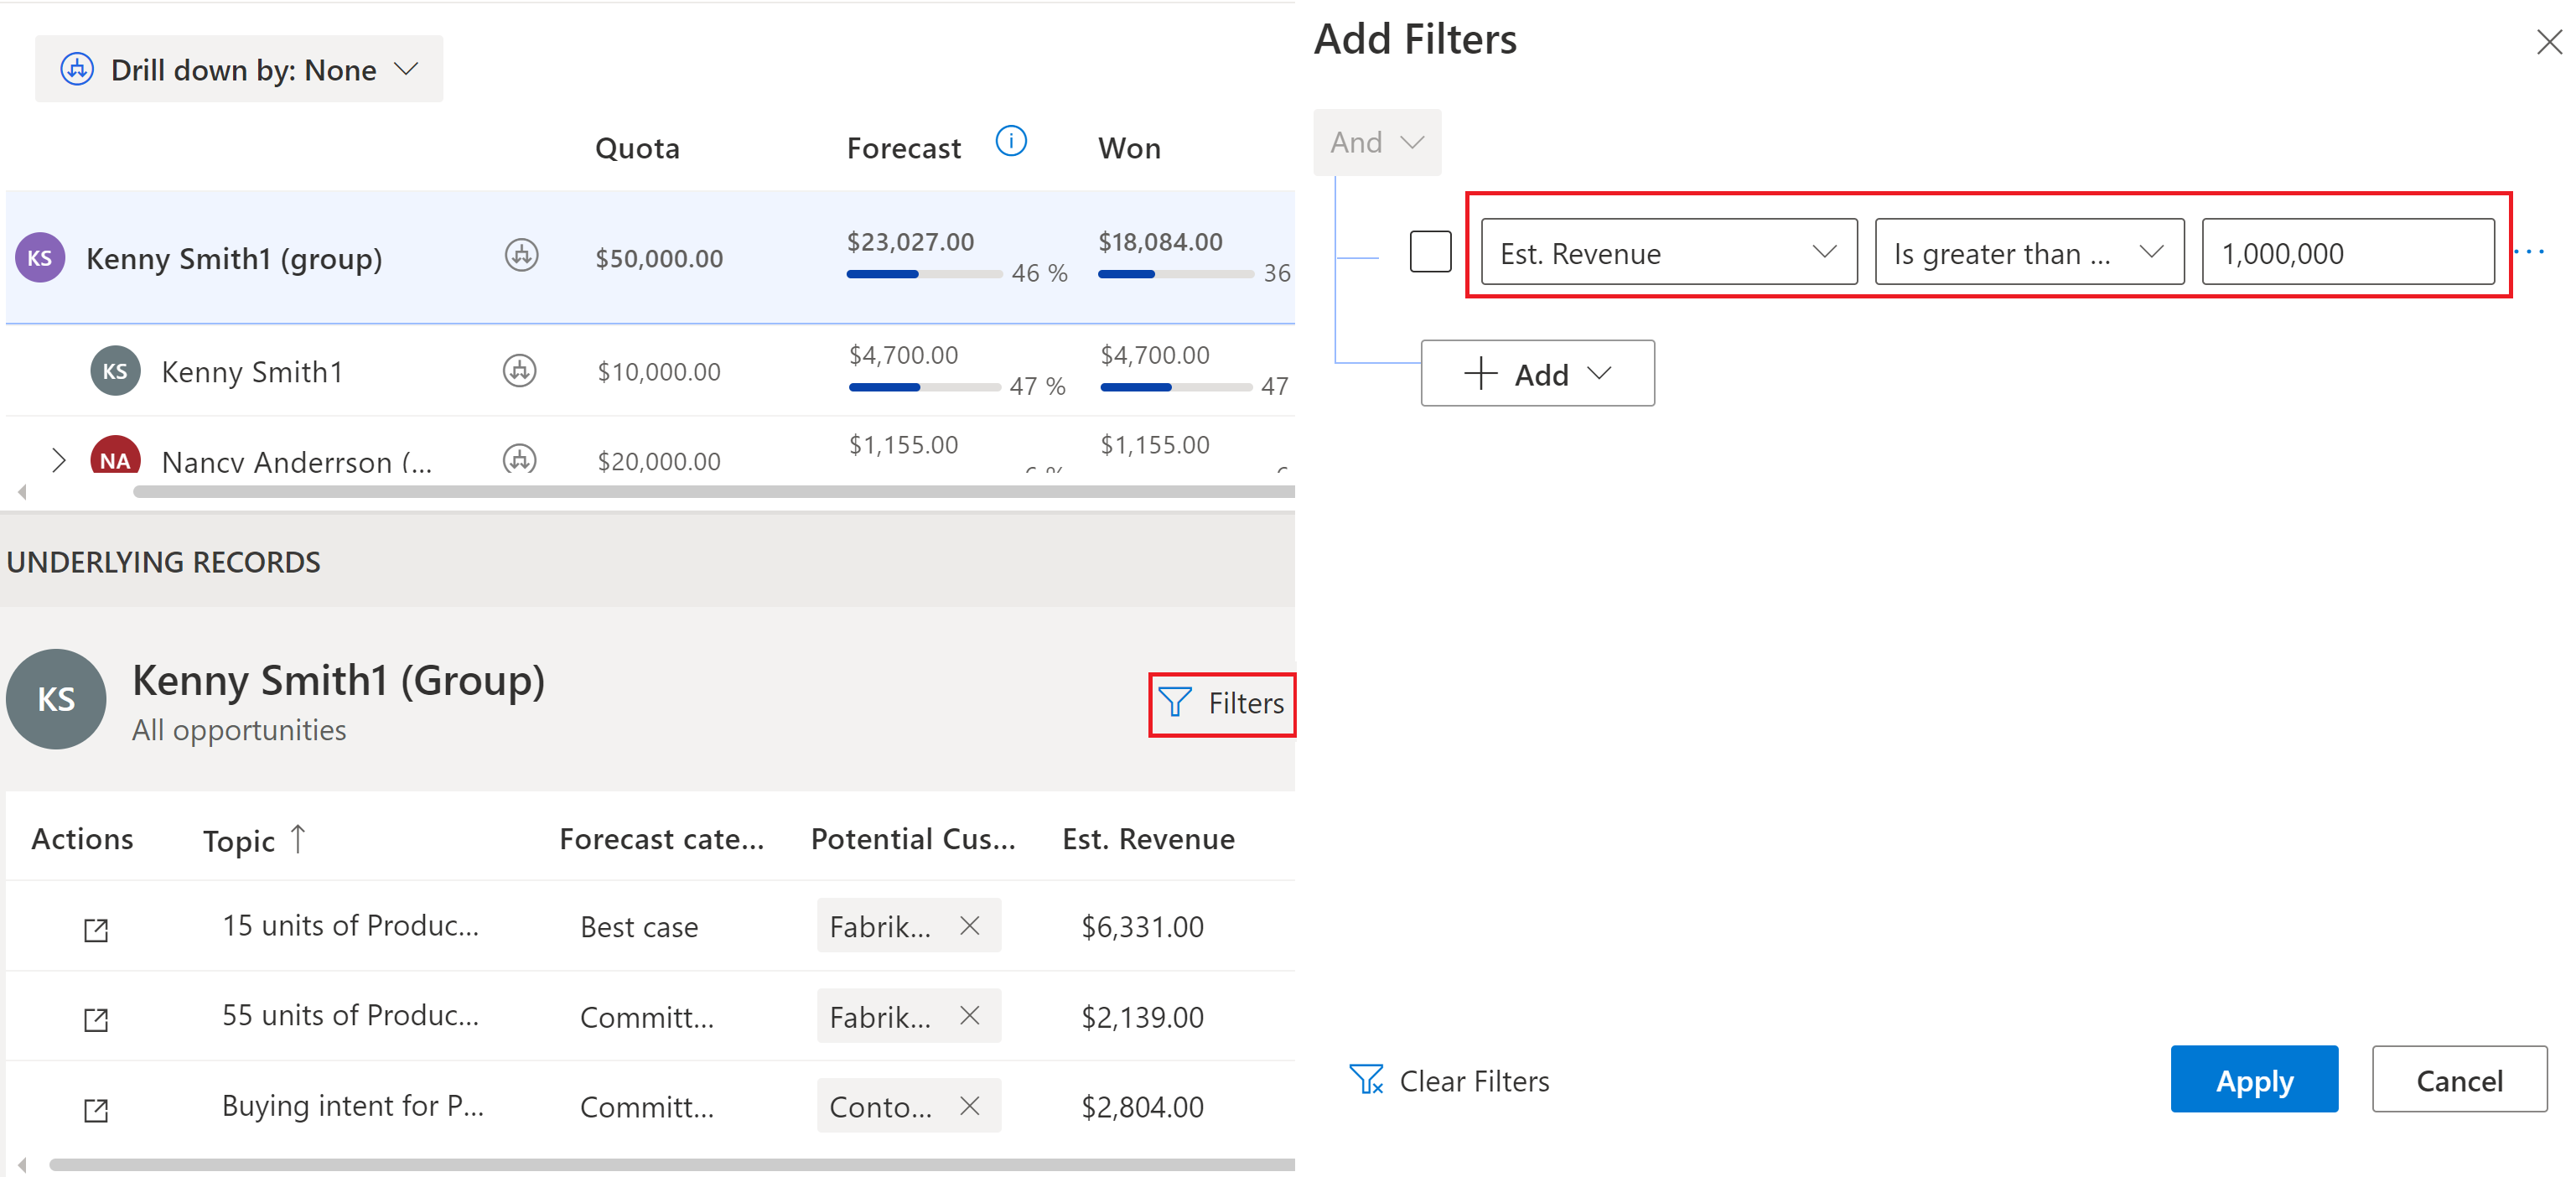
Select Filters, and add the filter conditions.
If Group by is set to None, you can directly apply the filters on the underlying opportunities as shown in the following screenshot. The opportunities filter will persist across the recurrences in the same forecast until you clear the filter manually.
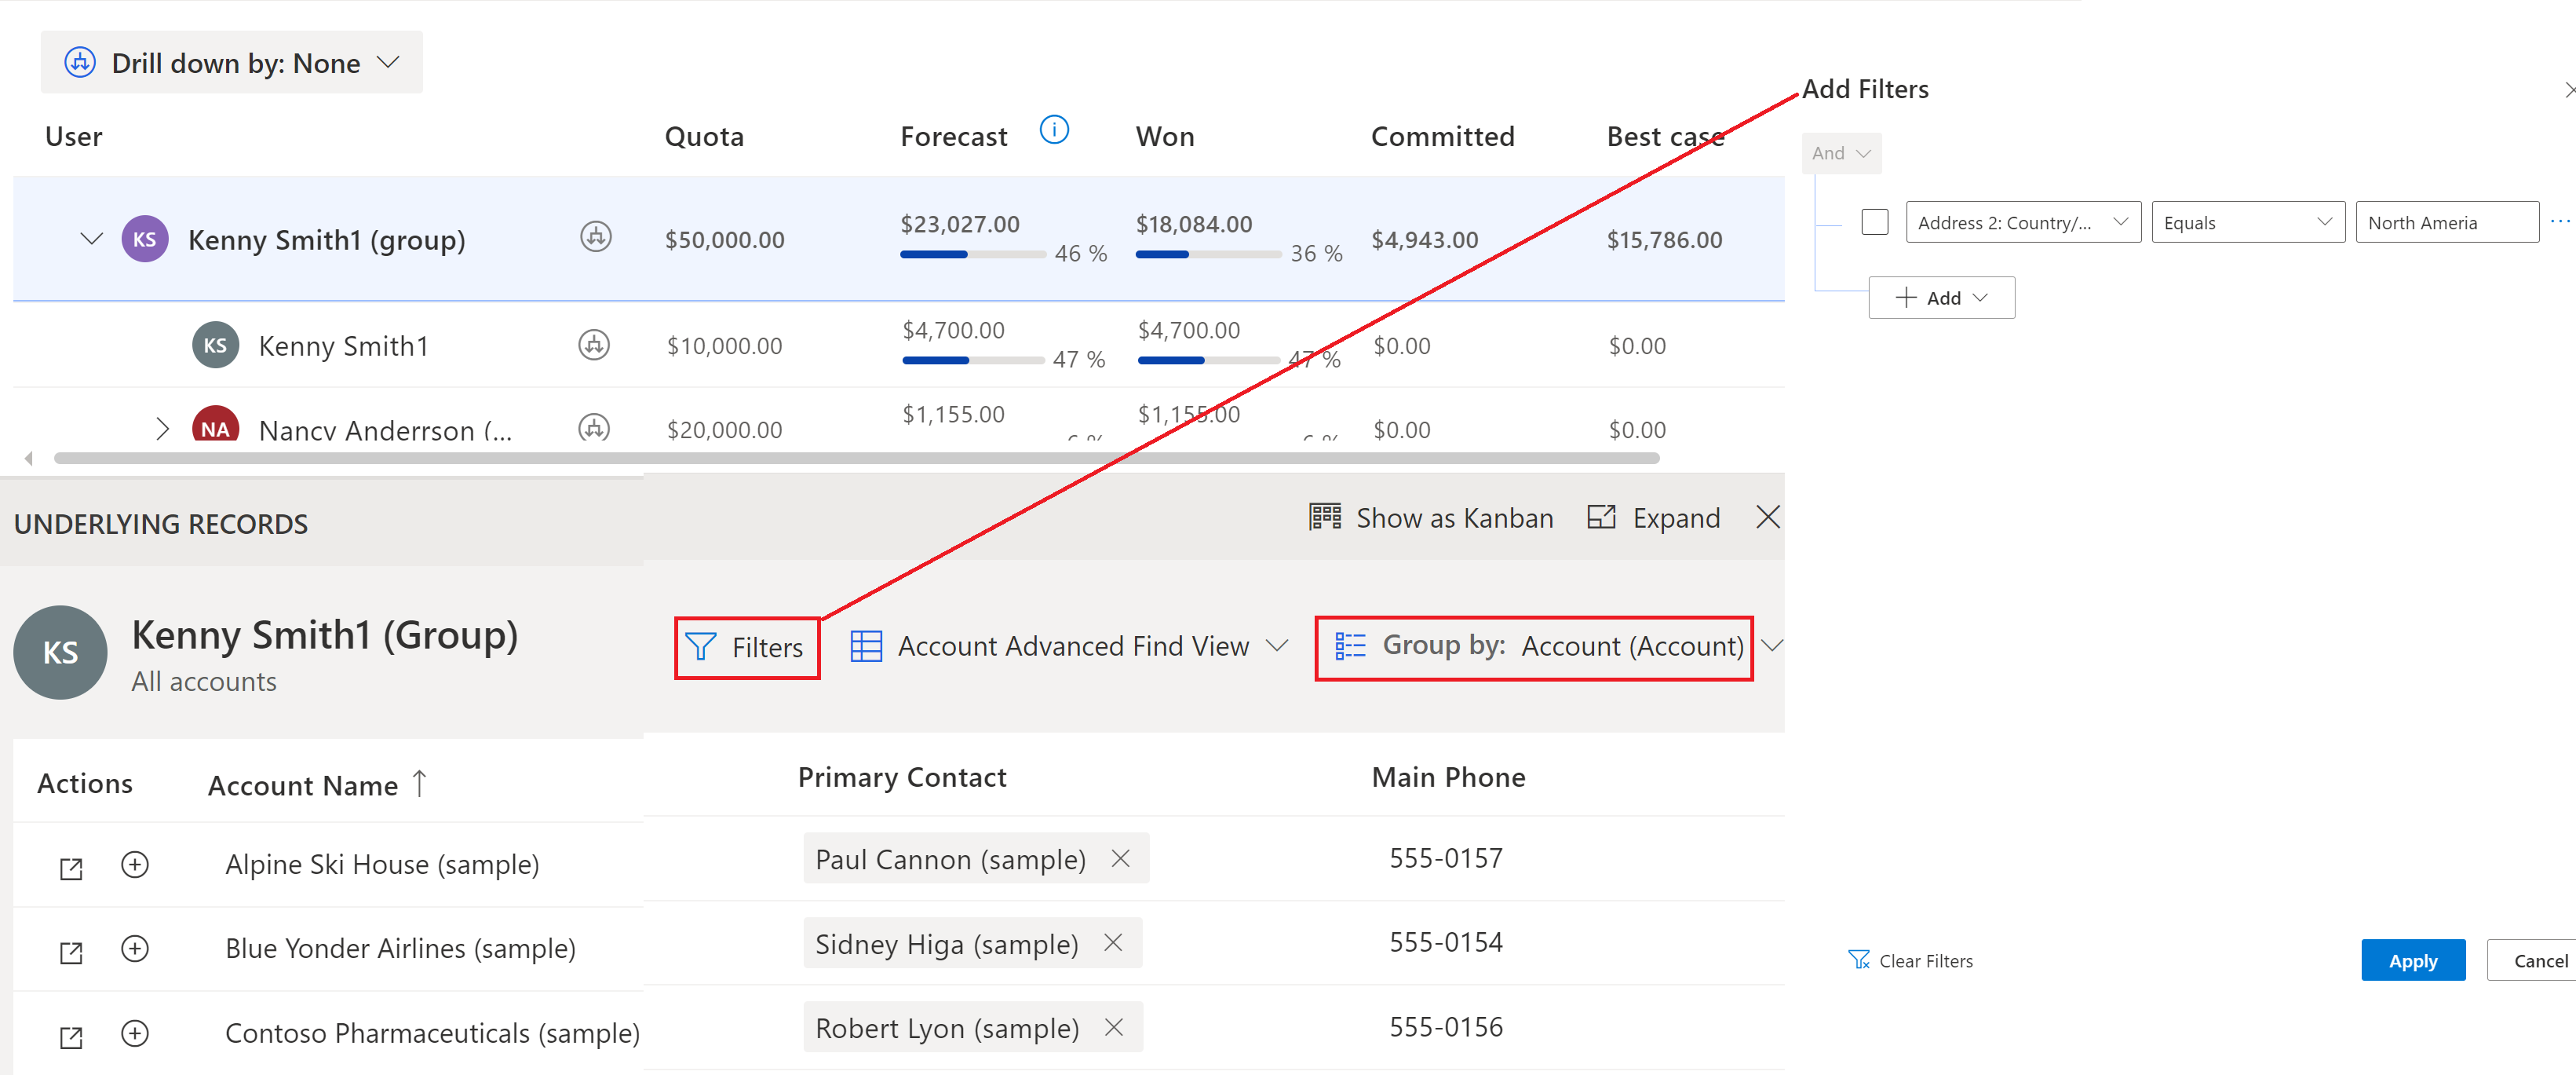
If Group by is set to an entity (such as, account).
You can filter the group by using the attributes in the selected table. For example, if you've chosen to group the opportunities by account, you can filter the accounts from a specific region. You can also add a filter on a related entity, such as estimated revenue of the opportunities associated with the account.
You can apply a different filter for the opportunities associated with the group. The filters applied on the underlying opportunities persist irrespective of the grouped entity, group filter, and recurrence of the forecast.
Each forecast can have different filter conditions and grouping.
For more information about filters, go to Add conditions to a filter.
Example: Grouping and filtering the underlying opportunities
Let's understand grouping and filtering of underlying records with an example.
Kenny Smith is a Vice President of the sales organization at Contoso Inc and heads the Sales teams in North America (NA) and Europe regions. Kenny wants to personally follow up with the customers of the high-value opportunities in the NA region so that the deals can be closed in time for Q2. Following are the steps that Kenny should perform:
Open the Q2 forecast for the org.
Select Account in the Group by field.
All underlying opportunities of the forecast are grouped by their corresponding accounts.
Select Filters > Add > Add row and specify the following condition: Address2: Country Equals North America
All the accounts in North America are displayed.
Select the View underlying rollup records (the plus sign (+)) next to an account.
The underlying opportunities associated with that account are displayed.
Select Filters > Add > Add row, and specify the following condition for the opportunities: Est.Revenue Is greater than or equal to 1,000,000
The high-value opportunities of the selected account are displayed.
Note
The opportunities filter is persisted unless cleared manually. For example, when Kenny opens the rollup records of another account in the NA region, the records are already filtered for high-value opportunities. Even if Kenny changes the grouping to a User entity, the underlying opportunities filter persists and is automatically applied to the opportunities in the new group.
View and edit in a kanban view
Open a forecast.
Select a row or a cell for any level of the hierarchy for which you want to see underlying opportunities.
In this example, we're selecting Alyce Durham. Because Alyce is a manager, all the underlying opportunities that are contributing to the team's forecast are listed. This view is opened in a table, by default.
You can identify whether the selected opportunities belong to a team, an individual, a single cell value, or a full row by looking at the table heading. The format of the heading is described in the following table:
Heading format
Description
Username (Group) – All opportunities
All the opportunities across different forecast categories that the selected user and that user's team own.
Username - All opportunities
All the opportunities across different forecast categories that the selected user owns.
Username (Group) – Column name
The opportunities that the selected user and that user's team own for the selected forecast category.
Username – Column name
All the opportunities that the selected user owns for the selected forecast category.
You can change the view of these opportunities by using the view selector. By default, the view that was selected when the forecast was configured is displayed.
Select Show as Kanban.
The table view changes into a kanban view and the order of columns is displayed based on the order that's defined in the option set in the application. All the underlying opportunities are displayed as cards in their respective forecast categories. Each card displays attributes that you can edit. In this example, the opportunity name, Owner, Est. Revenue, and Est. Close Date are displayed.
Note
The opportunities in columns Won and Lost are locked. You can't edit these values directly, because multiple attribute values must be set to enter an opportunity as Won or Lost. However, you can select the name of the opportunity, and the opportunity will open in a new page where you can edit the opportunity, and then save and close it.
To edit the opportunity, you can directly change the values for the attributes displayed on the card and drag the cards from one forecast category to another.
The changes are saved, and the opportunity is updated in Dynamics 365 Sales. The changes are also automatically applied in the forecast grid.
Note
To edit more attributes for the opportunity, select the name of the opportunity. The opportunity will open in a new page, where you can edit it as required, and then save and close it.
Can't find the options in your app?
There are three possibilities:
You don't have the necessary license or role. Check the License and role requirements section at the top of this page.
Your administrator hasn't turned on the feature.
Your organization is using a custom app. Check with your administrator for exact steps. The steps described in this article are specific to the out-of-the-box Sales Hub and Sales Professional apps.
Demonstrate customization of Dynamics 365 Sales to provide clients with tools to manage customer information, gather insights, and automate best practices.