Note
Access to this page requires authorization. You can try signing in or changing directories.
Access to this page requires authorization. You can try changing directories.
In Asset Management, you can analyze asset fault registrations to get an overview of the total number of faults registered during a specific period. Fault registrations can be analyzed from different perspectives, for example with focus on assets, asset types, functional locations, fault symptoms, or fault types.
Click Asset management > Inquiries > Asset fault > Asset fault analysis.
In the Asset fault analysis calculation dialog, you can use the Level field to indicate how detailed you want the asset fault lines to be regarding functional locations.
For example, if you insert the number "1" in the field, and you have a multi-level functional location structure, all asset fault lines for a functional location will be shown on the top level, and therefore the hours on a line may be added up from functional locations located at a lower level.
If you insert the number "0" in the Level field, you will see a detailed result showing all asset fault lines on all the functional location level to which they are related.
If you want to limit the search, you can select specific assets, fault dates, fault causes, and fault remedies on the Records to include FastTab.
Click OK to start the calculation.
On the Asset fault analysis tab, click one or more Group by buttons to display the detail level you want to see. Activated buttons are highlighted. Activate or deactivate buttons by clicking on them.
Click Update calculations to show your selections on the screen.
Note
Every time you activate or deactivate a Group by button, remember to click the Update calculations button. This is required because a large amount of data is processed as you are recalculating fault probability.
Examples
There are many ways to analyze fault registrations. This section has five examples of how different data selections can provide more insight and detail when analyzing asset fault registrations.
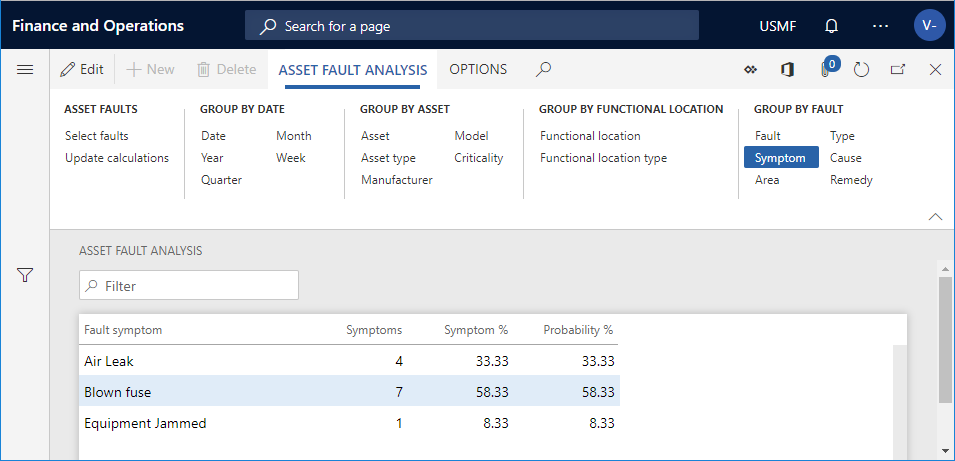
Group by symptoms
In the screenshot below, only the Symptom button is selected.
- Fault registrations have been made on three fault symptoms: "Air leak", "Blown fuse", and "Equipment jammed".
- In the Probability % column, all percentages add up to 100%. Probability is based on all Symptom registrations in this fault analysis.
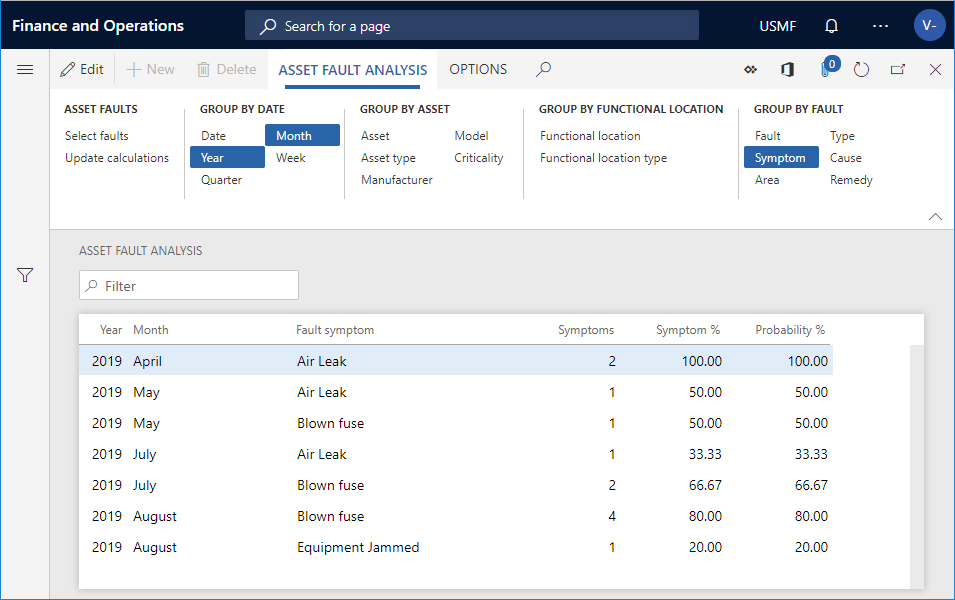
Group by symptoms and time period
In the screenshot below, Year and Month are added to show how you can view fault registrations during a selected period.
- The fault symptoms are now shown as registrations per year/month.
- In the Probability % column, if you add all percentages for each month, they add up to 100%. Probability is based on the Symptom registrations in this fault analysis. If you have a large number of lines on an asset, but a large percentage stands out on a line, that would be an indication of a fault symptom to examine more closely to find a way to limit the number of registrations for that fault symptom.
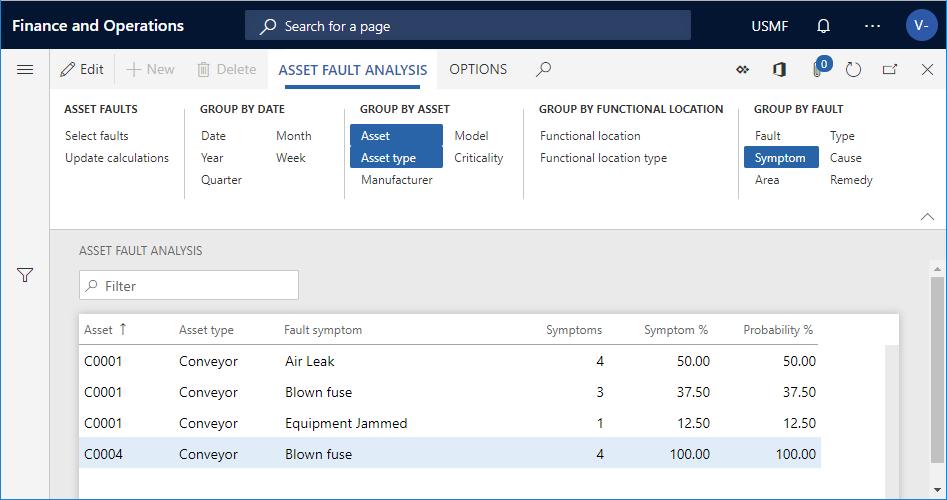
Group by multiple symptoms and assets
The combination of assets and an asset type is used as a basis for the calculations shown in the three screenshots below, which will increase in detail level.
Generally, the buttons in the Group by date, Group by asset, Group by functional location Action Pane groups, as well as the Fault button (Fault ID), contain periods or asset relations. The Symptom, Area, Type, Cause, and Remedy buttons are categorizations used in fault management to analyze asset fault registrations and pinpoint problem areas.
Group by symptom, asset, and asset type
In the screenshot below, Asset and Asset type were added to provide more detail regarding fault registrations.
- The fault symptoms are now split up in Asset / Asset type / Symptom combinations.
- In the Probability % column, if you add all percentages for the combination of Asset / Asset type / Symptom respectively, they each add up to 100%. Probability is based on Symptom registrations in this fault analysis. If you have a large number of lines on an asset, but a large percentage stands out on a line, that would be an indication of a fault symptom to examine more closely to find a way to limit the number of registrations for that fault symptom.
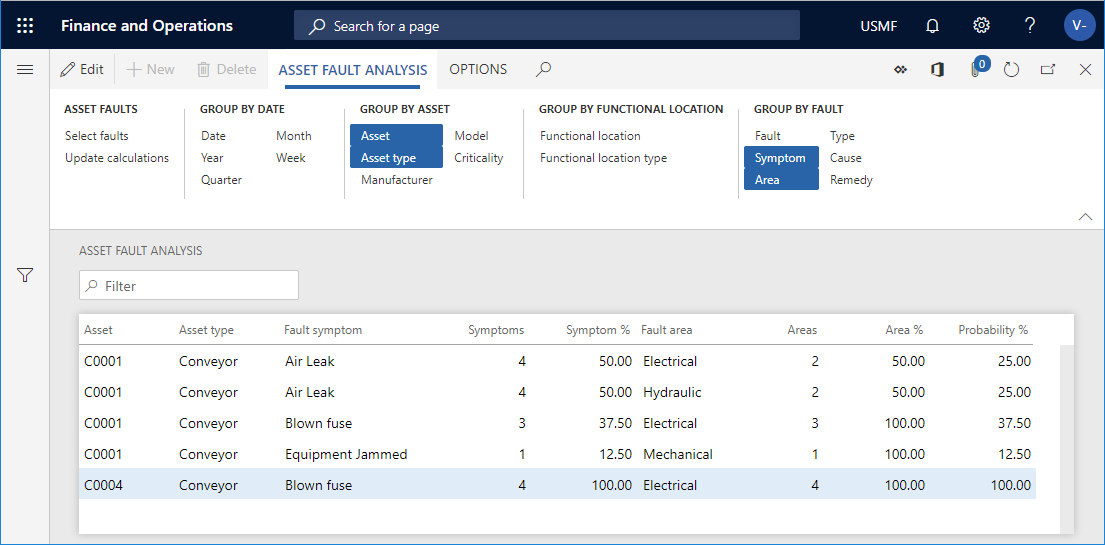
Group by two symptoms, asset, and asset type
In the screenshot below, Area was added to Symptom, Asset, and Asset type to provide more detail regarding fault registrations.
- In the Probability % column, if you add all percentages for the combination of Asset / Asset type / Symptom on an asset, they each add up to 100%. Probability is based on the combination of Symptom and Area in this fault analysis. If you have a large number of lines on an asset, but a large percentage stands out on a line, that would be an indication of a fault area to examine more closely to find a way to limit the number of registrations for that fault area.
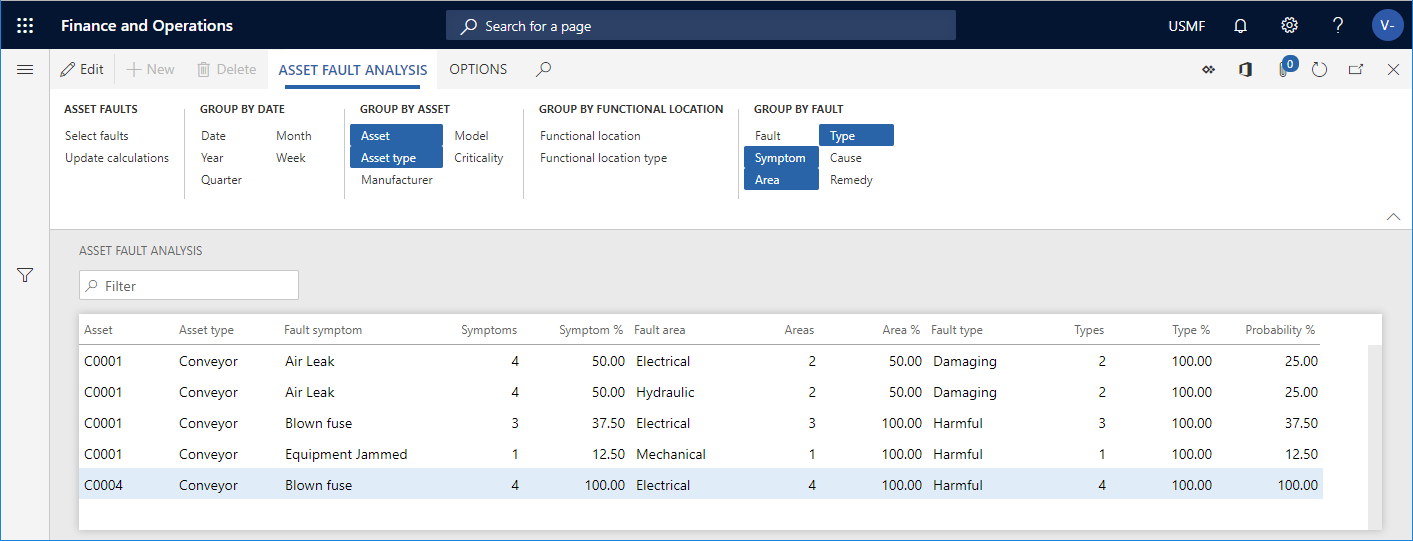
Group by three symptom, asset, and asset type
In the screenshot below, Type was added, and the most detailed calculation in this example is shown.
- In the Probability % column, if you add all percentages for the combination of Asset / Asset type / Symptom on an asset, they each add up to 100%. Probability is based on the combination of Symptom, Area, and Type in this fault analysis. If you have a large number of lines on an asset, but a large percentage stands out on a line, that would be an indication of a fault type to examine more closely to find a way to limit the number of registrations on that fault type.
Note
For an overview of all fault registrations created on work orders and maintenance requests, click Asset management > Inquiries > Asset fault > Asset faults. On the Asset faults page, select an asset fault registration and expand the Related information pane to see information regarding the related work order or maintenance request.