Note
Access to this page requires authorization. You can try signing in or changing directories.
Access to this page requires authorization. You can try changing directories.
This quickstart shows a simple end-to-end flow in Fabric: upload a local CSV file, load it as a Delta table in a lakehouse, and build a report from it.
By the end, you can:
- Upload a CSV file to a lakehouse
- Convert the file to a Delta table
- Generate a semantic model and create a Power BI report
Prerequisites
Before you begin, make sure you have the following:
- A Fabric workspace where you can create lakehouse items. If you don't already have one, see Create workspaces.
- The "Taxi Zone Lookup Table" CSV file downloaded from the TLC Trip Record Data website.
Create a lakehouse
Start by creating the lakehouse where you store the CSV file and table.
- In Fabric, select Workspaces from the navigation bar.
- To open your workspace, enter its name in the search box located at the top and select it from the search results.
- From the workspace, select New item, enter Lakehouse in the search box, then select Lakehouse.
- In the New lakehouse dialog box, enter wwilakehouse in the Name field.
- Select Create.
After the lakehouse is created, the next step is to upload the CSV file.
Upload a CSV file to the lakehouse
Now place your source CSV file in the lakehouse files area so it can be loaded into a Delta table.
Create the
TaxiDatafolder under theFilessection of your lakehouse.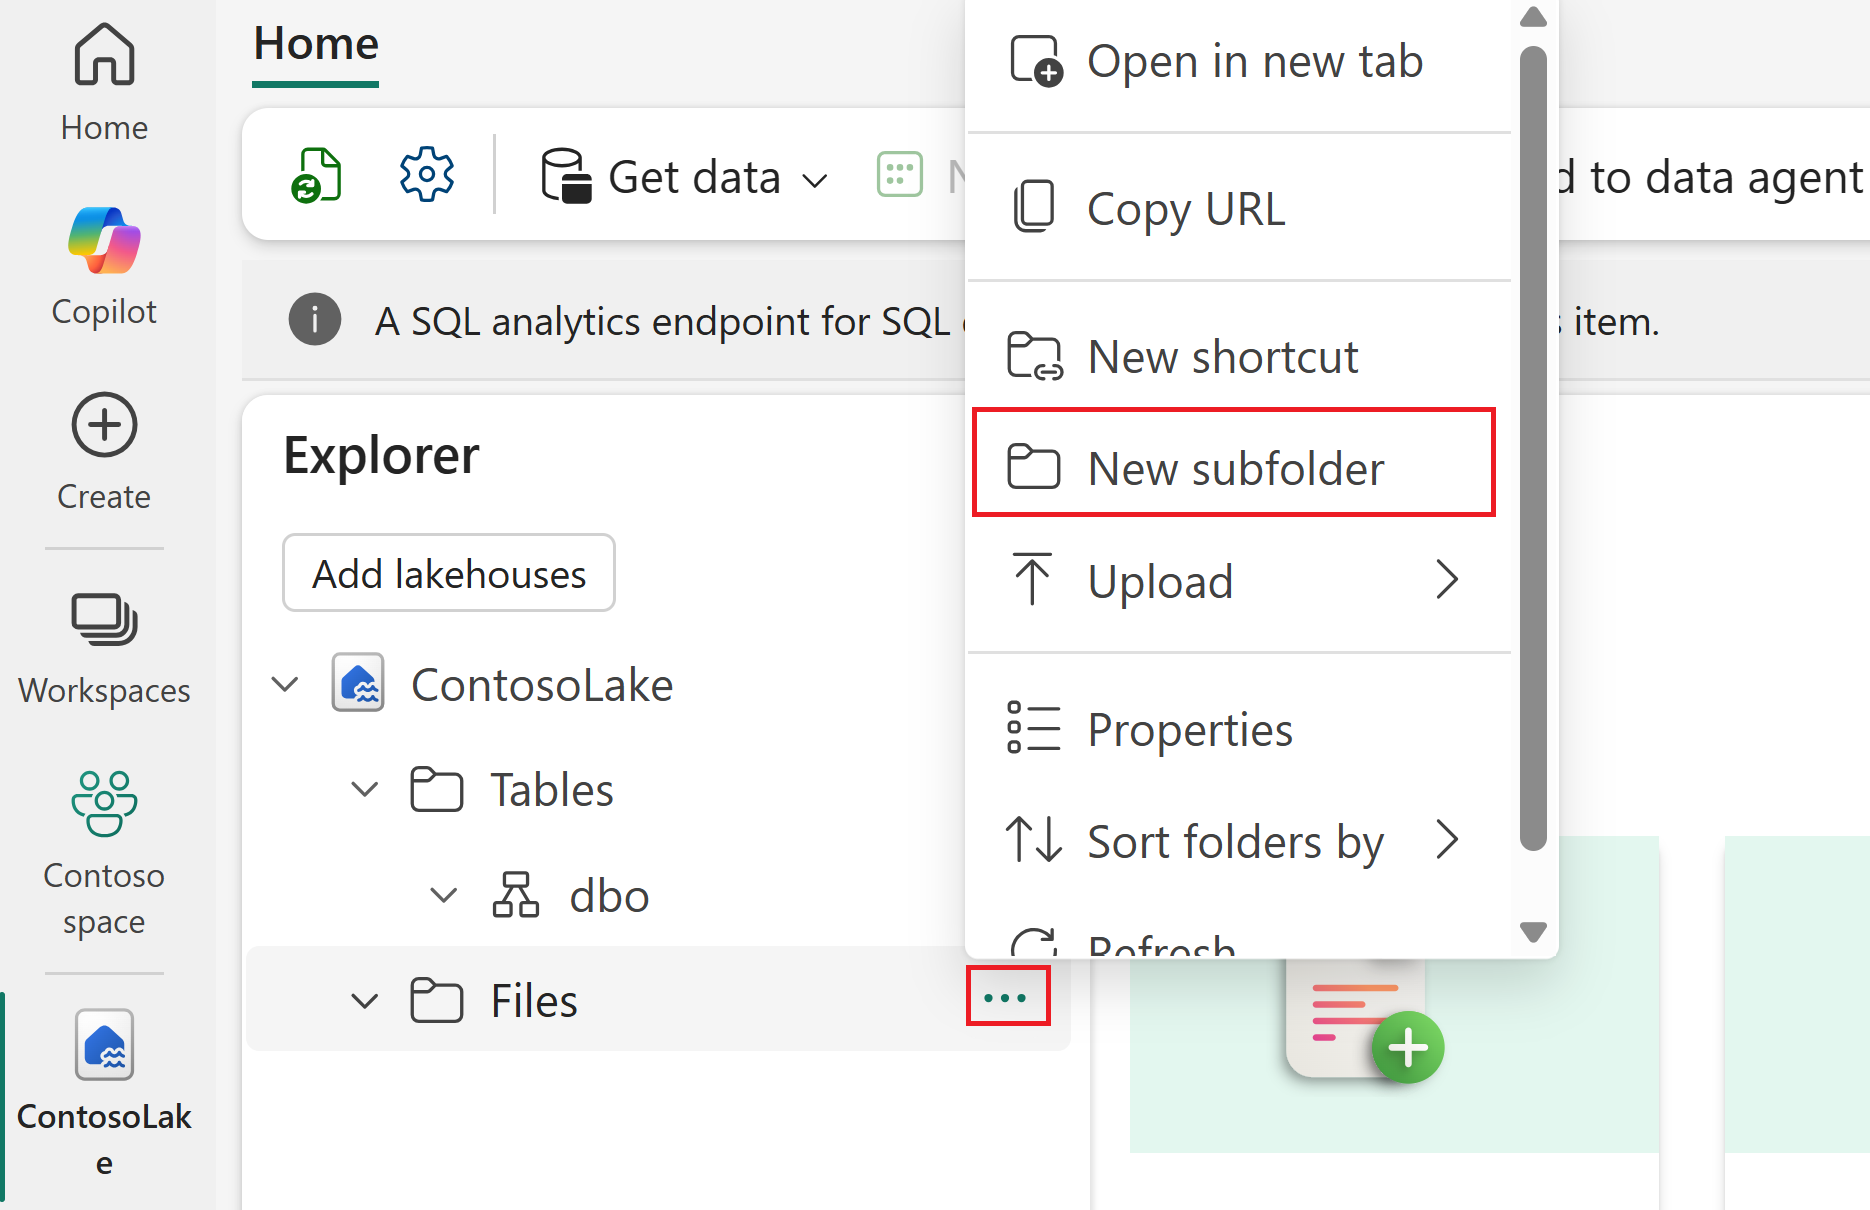
Select the ellipsis (...) next to the
TaxiDatafolder, and then select Upload > Upload files.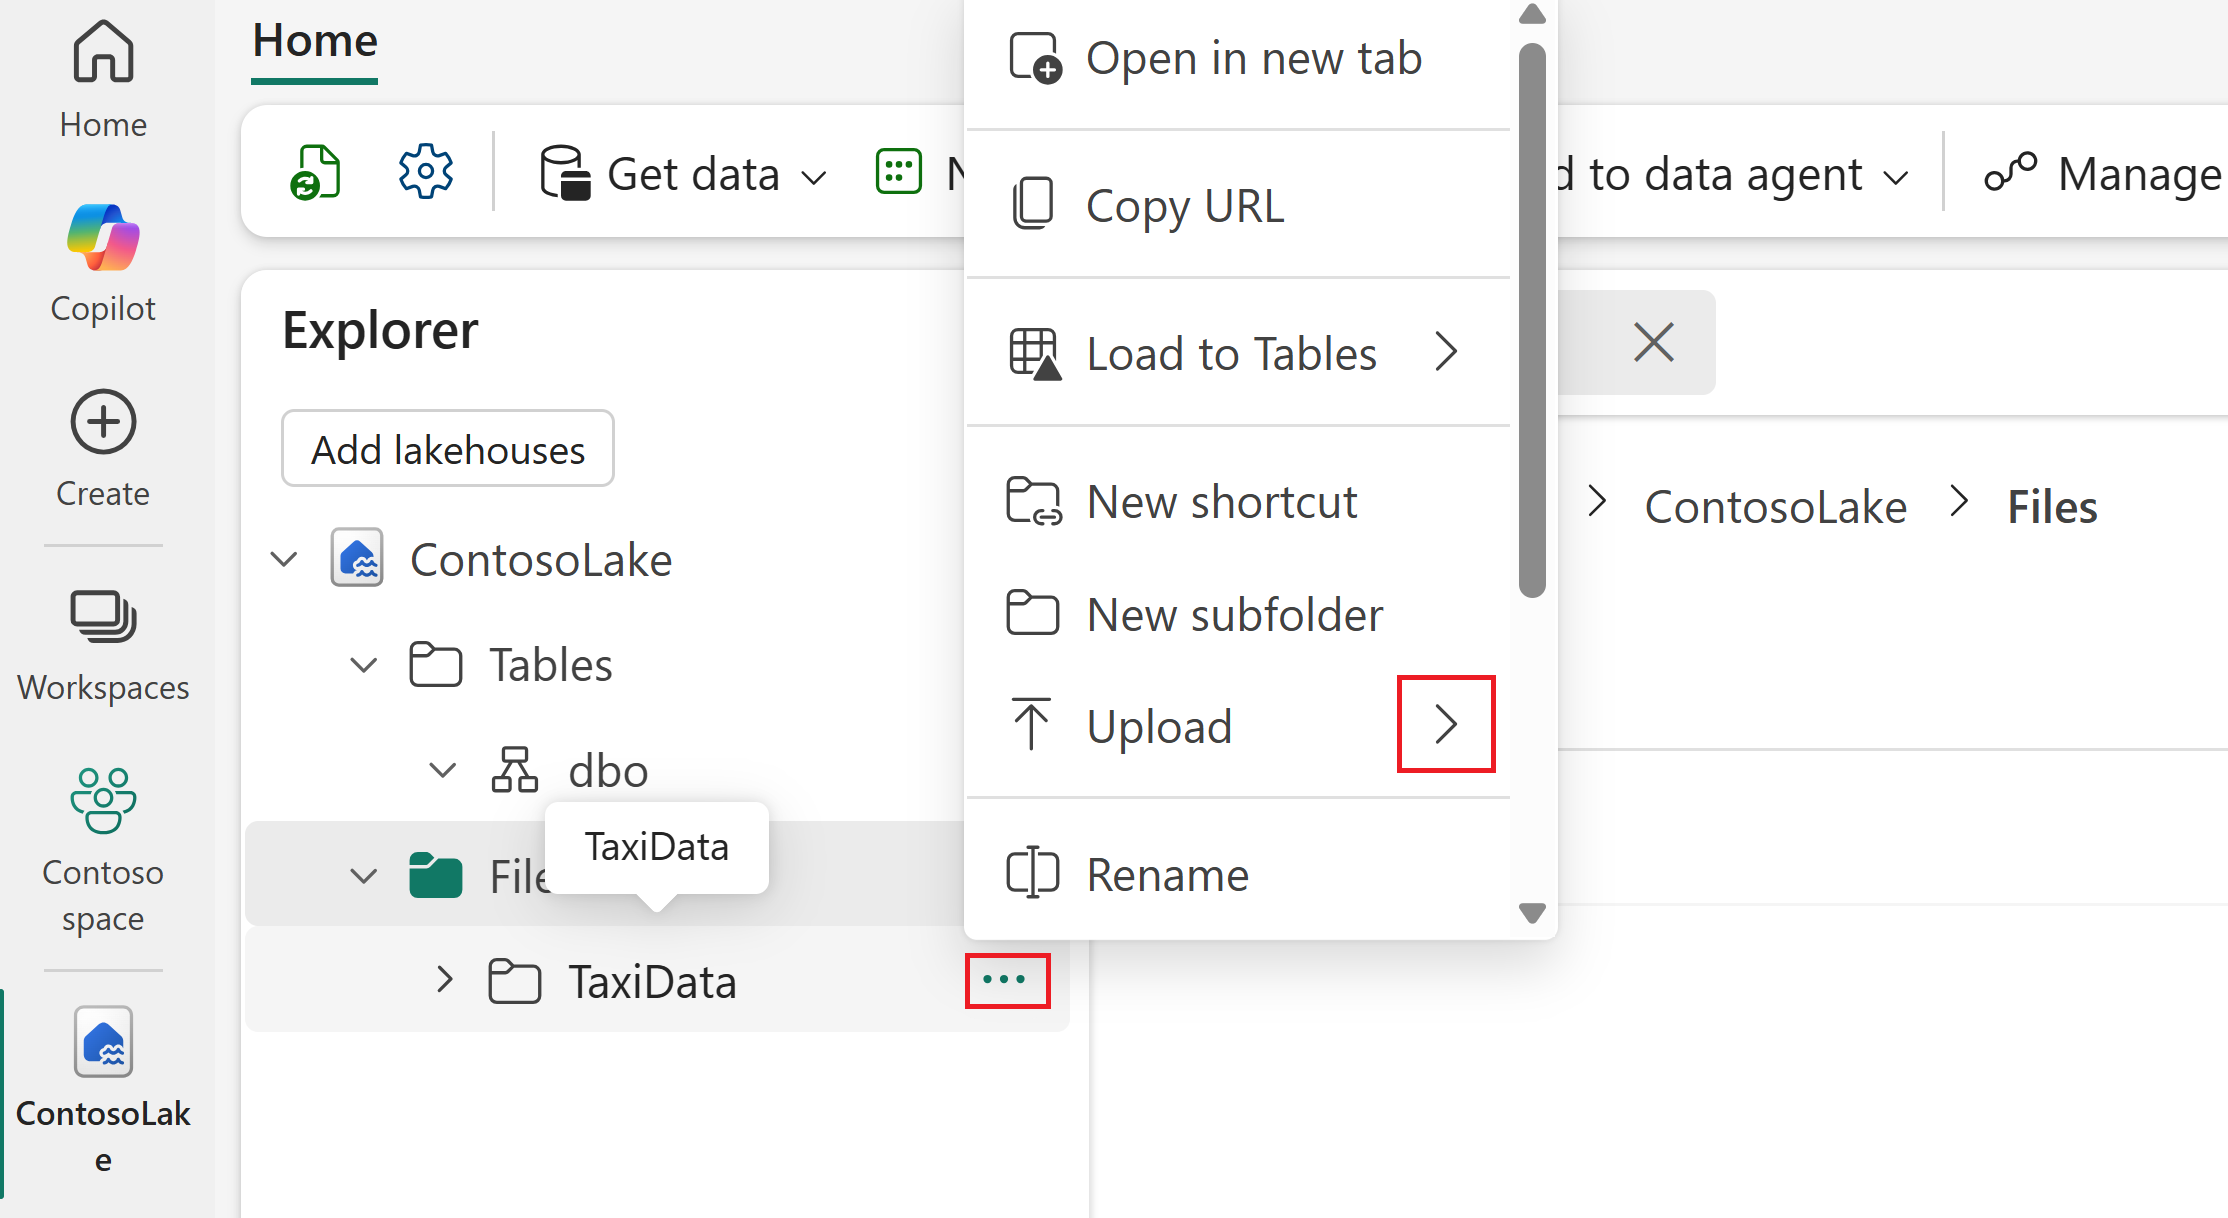
Once uploaded, select the folder to see its content.
If the file name includes unsupported special characters, rename the file before loading. For current naming requirements, see Load to Delta Lake tables. In this example, rename the file to
taxi_zone_lookup.csv.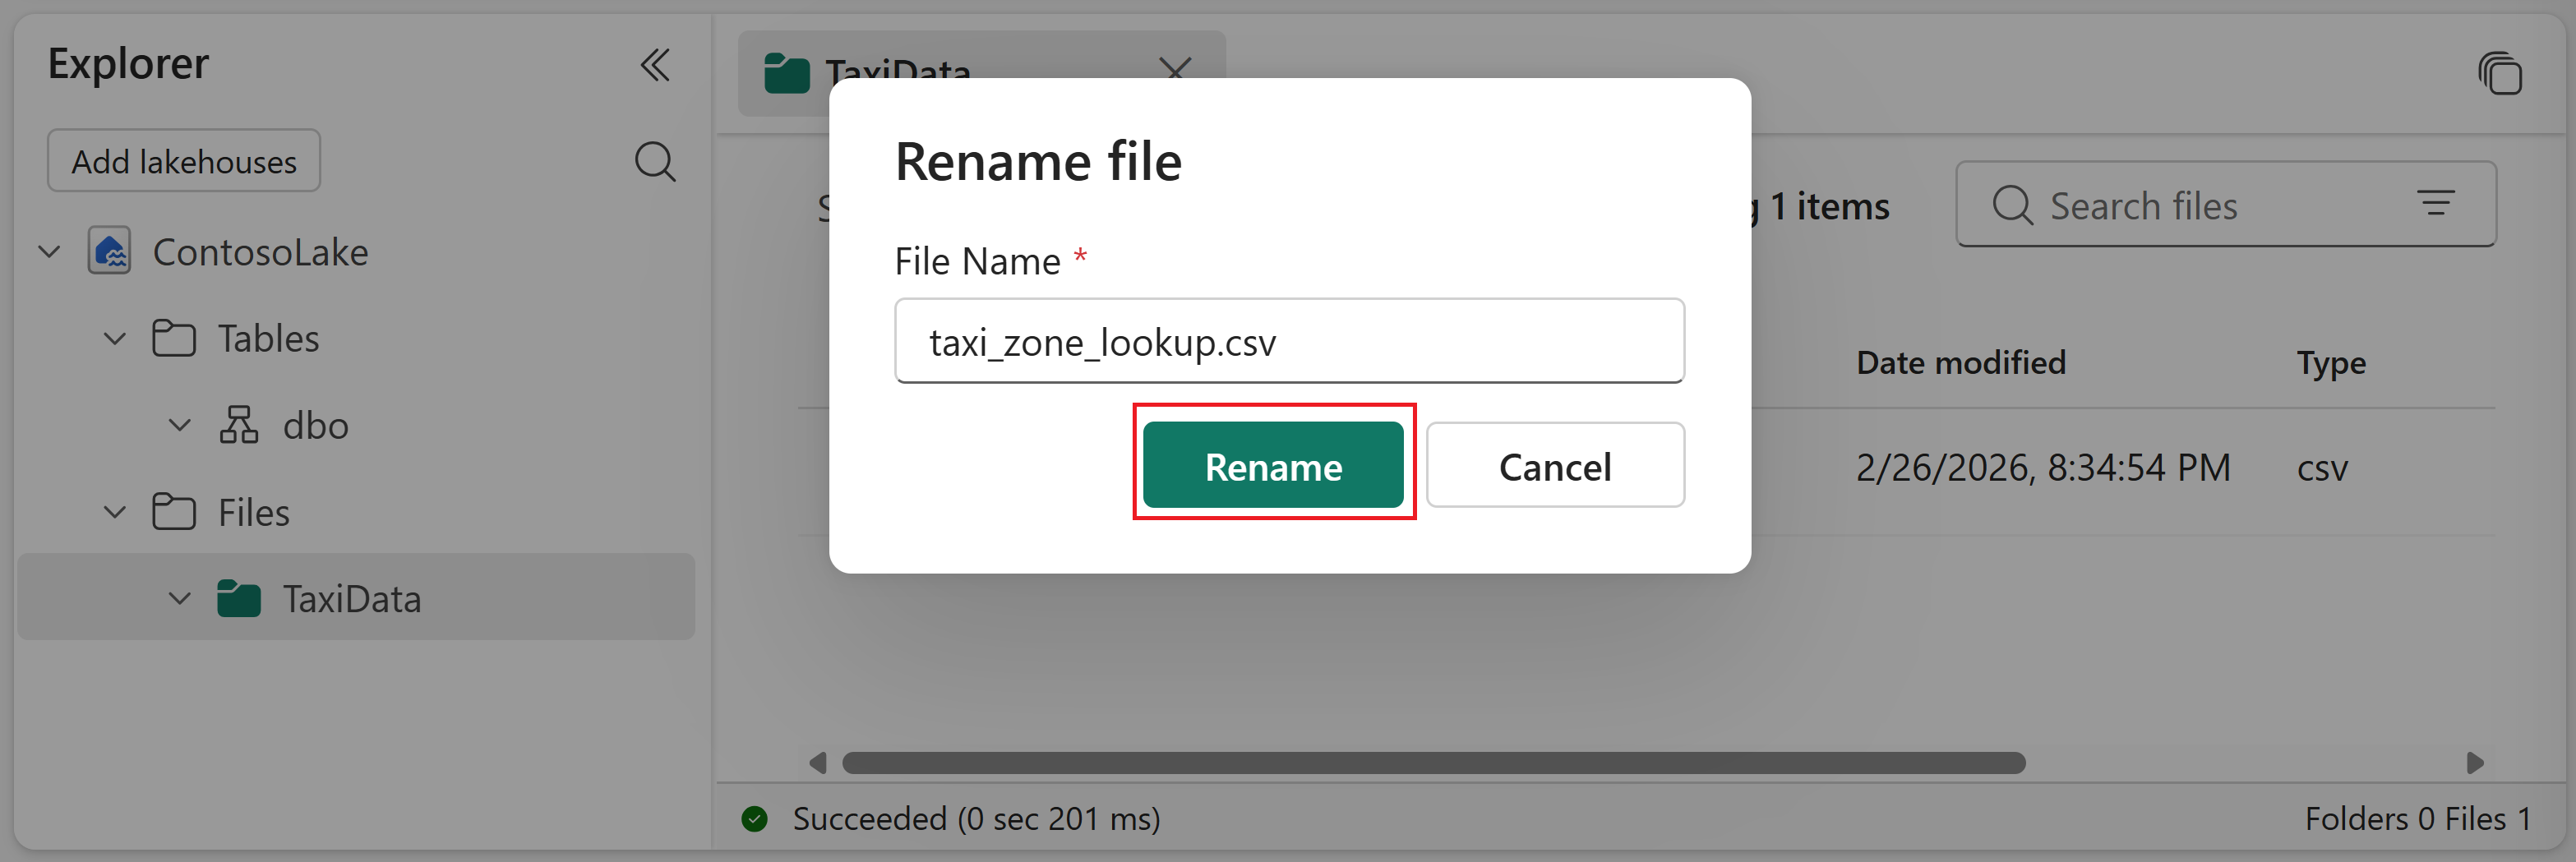


Load the file to a Delta table
In this stage, you convert the uploaded CSV file into a Delta table that can be queried and used for reporting.
- Right-click or use the ellipsis on the CSV file to open the contextual menu. Select Load to tables, and then choose New table.
- In the load to tables dialog, review the suggested table name. Real-time validation applies while you type.
- Select Load to execute the load.
- The table now shows up in the lakehouse explorer, expand the table to see the columns and its types. Select the table to see a preview.
Note
If the table already exists, different load mode options appear. Overwrite drops and recreates the table. Append inserts all CSV content as new data. For more details, see Load to Delta Lake tables.
Generate a semantic model and create a Power BI report
With the Delta table ready, create a semantic model and then build a report from that model.
- On the Lakehouse ribbon, create a new semantic model.
- Select the table to add to the semantic model, and then confirm your selection.
- In semantic model editing, you can define relationships between tables and apply data type normalization and DAX transformations as needed.
- Select New report on the ribbon.
- Use the report builder to design a Power BI report.