Note
Access to this page requires authorization. You can try signing in or changing directories.
Access to this page requires authorization. You can try changing directories.
The purpose of this document is to guide you in estimating the cost of running the same activities in the Fabric Data Factory Pipeline instead of Azure Data Factory or Synapse Pipelines, and estimating the cost of running Dataflows Gen2 in Fabric Data Factory instead of Dataflows Gen1.
Prerequisites
- Microsoft Fabric Licensing
- Data pipelines pricing for Data Factory in Microsoft Fabric
- Dataflow Gen2 pricing for Data Factory in Microsoft Fabric
Azure Data Factory pricing
Azure Data Factory billing is already well known to many existing customers. Pipelines are control flows of discrete steps referred to as activities. You pay for data pipeline orchestration by activity run and activity execution by integration runtime hours. The integration runtime, which is serverless in Azure and self-hosted in hybrid scenarios, provides the compute resources used to execute the activities in a pipeline. Integration runtime charges are prorated by the minute and rounded up. For example, the Azure Data Factory copy activity can move data across various data stores in a secure, reliable, performant, and scalable way.
Pricing for Data Pipeline in Azure Data Factory is calculated based on:
- Pipeline orchestration and execution
- Data flow execution and debugging
- Number of Data Factory operations such as create pipelines and pipeline monitoring
| Type | Azure Integration Runtime Price | Azure Managed virtual network Integration Runtime Price | Self-Hosted Integration Runtime Price |
|---|---|---|---|
| Orchestration¹ | $1 per 1,000 runs | $1 per 1,000 runs | $1.50 per 1,000 runs |
| Data movement² | $0.25/DIU-hour | $0.25/DIU-hour | $0.10/hour |
| Pipeline Activity³ | $0.005/hour | $1/hour (Up to 50 concurrent pipeline activities) | $0.002/hour |
| External Pipeline Activity⁴ | $0.00025/hour | $1/hour (Up to 800 concurrent pipeline activities) | $0.0001/hour |
¹Orchestration refers to activity runs, trigger executions, and debug runs.
²Use of the copy activity to egress data out of an Azure data center incurs extra network bandwidth charges, which will show up as a separate outbound data transfer line item on your bill.
³Pipeline activities execute on integration runtime. Pipeline activities include Lookup, Get Metadata, Delete, and schema operations during authoring (test connection, browse folder list and table list, get schema, and preview data). External pipeline activities are managed on integration runtime but execute on linked services. External activities include Databricks, stored procedure, HDInsight activities, and many more.
⁴External pipeline activities are managed on integration runtime but execute on linked services. External activities include Databricks, stored procedure, HDInsight activities, and many more.
Read/write operations for Azure Data Factory entities include create, read, update, and delete. Entities include datasets, linked services, pipelines, integration runtime, and triggers.
| Type | Price | Examples |
|---|---|---|
| Read/Write | $0.50 per 50,000 modified/referenced entities | Read/write of entities in Azure Data Factory |
| Monitoring | $0.25 per 50,000 run records retrieved | Monitoring of pipeline, activity, trigger, and debug runs |
Data Factory for Fabric pricing
Pricing in Data Factory for Fabric is billed through Data Factory pipelines, and Dataflow Gen1 with Power BI.
Fabric data pipelines pricing
The following table shows a breakdown of the pricing model for data pipelines in Data Factory for Microsoft Fabric:
| Data Pipelines Engine Type | Charge Meters and Metric Units | Fabric Capacity Units (CUs) consumption rate |
|---|---|---|
| Data movement | Based on Copy activity run duration in hours and the used intelligent optimization throughput resources | 1.5 CUs / hour |
| Data orchestration | Incorporates orchestration activity runs and activity integration runtime charges | 0.0056 CUs for each non-copy activity run |
It indicates that for each intelligent optimization throughput resource usage in a Data Pipeline execution, 1.5 CU per hour is consumed for data movement Copy activities. Secondly, each orchestration activity run consumes 0.0056 CU. At the end of each pipeline run, the CU consumption for each engine type is summed and is billed as per the translated price of the Fabric Capacity in the region where the capacity is deployed. For more information about Data pipelines pricing, see Pricing for data pipelines.
Dataflow Gen1 pricing in Power BI
Dataflow Gen 1 is currently priced as per Power BI premium per user or premium capacity on second consumption normalized to an hour. The capacity hour gets deducted from your overall capacity allocated to tenant. Capacity can be configured to support any dataflows or paginated reports, with each requiring a configurable maximum percentage of memory. The memory is dynamically allocated to your dataflows. Given F64/P1 capacity, it has a total of 8 PBI v-cores and 64 capacity units. Capacity units get deducted as dataflows consume CPU and memory.
Data Factory in Fabric pricing
The following table indicates that to determine Dataflow Gen2 execution costs, each query execution utilizes the mashup engine for standard computing, and that compute execution duration is translated to a consumption rate of 16 CUs per hour. Secondly, for high scale compute scenarios when staging is enabled, Lakehouse/Warehouse SQL engine execution duration should be accounted for as well. Compute execution duration is translated to a consumption rate of 6 CUs per hour. At the end of each Dataflow Gen2 run, the Capacity Unit (CU) consumption for each engine type is summed and is billed according to the translated price for Fabric capacity in the region where it's deployed.
| Dataflow Gen2 Engine Type | Consumption Meters | Fabric CU consumption rate | Consumption reporting granularity |
|---|---|---|---|
| Standard Compute | Based on each mashup engine query execution duration in seconds. | 16 CUs per hour | Per Dataflow Gen2 item |
| High Scale Dataflows Compute | Based on Lakehouse/Warehouse SQL, engine execution (with staging enabled) duration in seconds. | 6 CUs per hour | Per workspace |
| Data movement | Based on Fast Copy run duration in hours and the used intelligent optimization throughput resources. | 1.5 CUs per hour | Per Dataflow Gen2 item |
Total refresh cost = (S + H CU-hour) * (Fabric capacity per unit price)
For more information, see Pricing for Dataflows Gen2.
Converting Azure Data Factory cost estimations to Fabric
While data flow Gen 2 pricing is like Gen 1 pricing, Fabric pipelines take a different approach than Azure Data Factory. In Fabric, we don't price external pipeline activities. The following table summarizes the conversion of Azure Data Factory costs to Fabric costs for a sample set of activities for a large customer:
| ADF Meter | Cost | Billed hours | ADF price | Fabric CU multiplier | Fabric CU hour | Fabric price | Fabric cost |
|---|---|---|---|---|---|---|---|
| Self-Hosted Data Movement | $1,688.10 | 16881 | 0.1 | 6 | 101286 | 0.18 | $18,231.48 |
| Self-Hosted External Pipeline Activity | $10.10 | 100994 | 0.0001 | ||||
| Self-Hosted Orchestration Activity Run | $2,005.50 | 1337 | 1.5 | 0.0056 | 7.4872 | 0.18 | $1.35 |
| Self-Hosted Pipeline Activity | $215.93 | 107991 | 0.002 | 0.0056 | 604.7496 | 0.18 | $108.85 |
| Cloud Data Movement | $3.25 | 13 | 0.25 | 1.5 | 19.5 | 0.18 | $3.51 |
| Cloud External Pipeline Activity | $0.63 | 2525 | 0.00025 | ||||
| Cloud Orchestration Activity Run | $1.68 | 1678 | 1 | 0.0056 | 9.3968 | 0.18 | $1.70 |
| Cloud Pipeline Activity | $34.28 | 6855 | 0.005 | 0.0056 | 38.388 | 0.18 | $6.91 |
| Azure Managed virtual network Data Movement | 86.75 | 347 | 0.25 | 1.5 | 520.5 | 0.18 | $93.69 |
| Azure Managed virtual network External Pipeline Activity | 7160 | 7160 | 1 | ||||
| Azure Managed virtual network Orchestration Activity Run | 37 | 37 | 1 | 0.0056 | 0.2072 | 0.18 | $0.04 |
| Azure Managed virtual network Pipeline Activity | 1008 | 1008 | 1 | 0.0056 | 5.6448 | 0.18 | $1.02 |
| Total Revenue/Billed hours | $13,927.59 | 246,826 | 102,491.8736 | $18,448.54 |
Making a Fabric cost estimation for Data Factory
By now, you have enough information on how legacy Azure Data Factory and Data Factory Gen 1 are metered and billed. The prior tables showed how you can take current meter data and convert to Fabric Data Factory pipeline and Data Flows Gen 2 costs to Fabric.
Here we describe the steps to estimate costs for each artifact.
For Data Flows Gen 1, obtain the past data flow Gen 1 capacity cost from the Power BI Metric app. Then, recalculate capacity hours for the same number of refreshes in Data Flows Gen2 as shown in the previous table.
On the Admin Portal's Capacity settings, select See usage report:
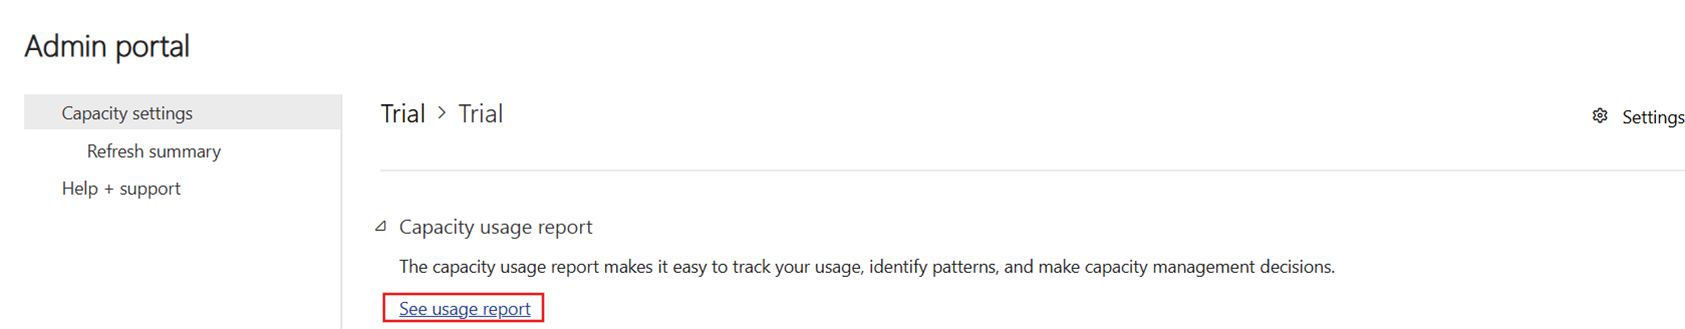
From there, you can find the details of the capacity usage.
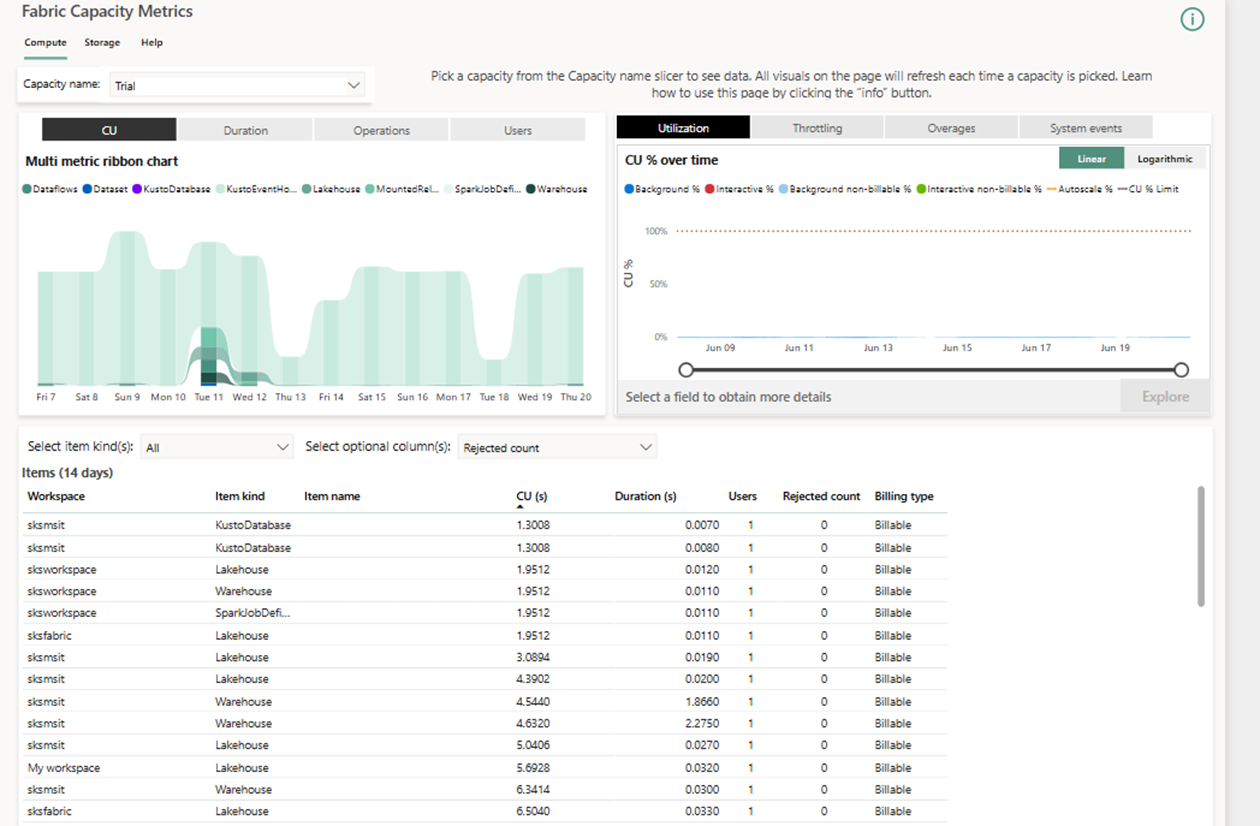
For Azure Data Factory, your can get all meter data from your current ADF subscription. Build out a table and plugin the values for customers. Create the table as shown in the case of the sample table. Like Data Flows Gen 1, you can get pipeline Capacity Units for pipelines in Fabric Metric App. Given ADF cost, calculate Fabric cost for pay-as-you-go. You can interpolate it to one year to get discounted pricing.

