Note
Access to this page requires authorization. You can try signing in or changing directories.
Access to this page requires authorization. You can try changing directories.
Monitoring your dataflow refreshes is key in ensuring that your dataflows are running as expected. Refresh history and monitoring hub allows you to evaluate in detail what happened during the refresh of your dataflow. This article provides you with an overview of the features that are available in the refresh history and monitoring hub. We also provide you with some guidance on how to use these features.
Refresh history
Refresh history is available using the drop-down menu in your workspace. You can access it by selecting the Recent runs button.

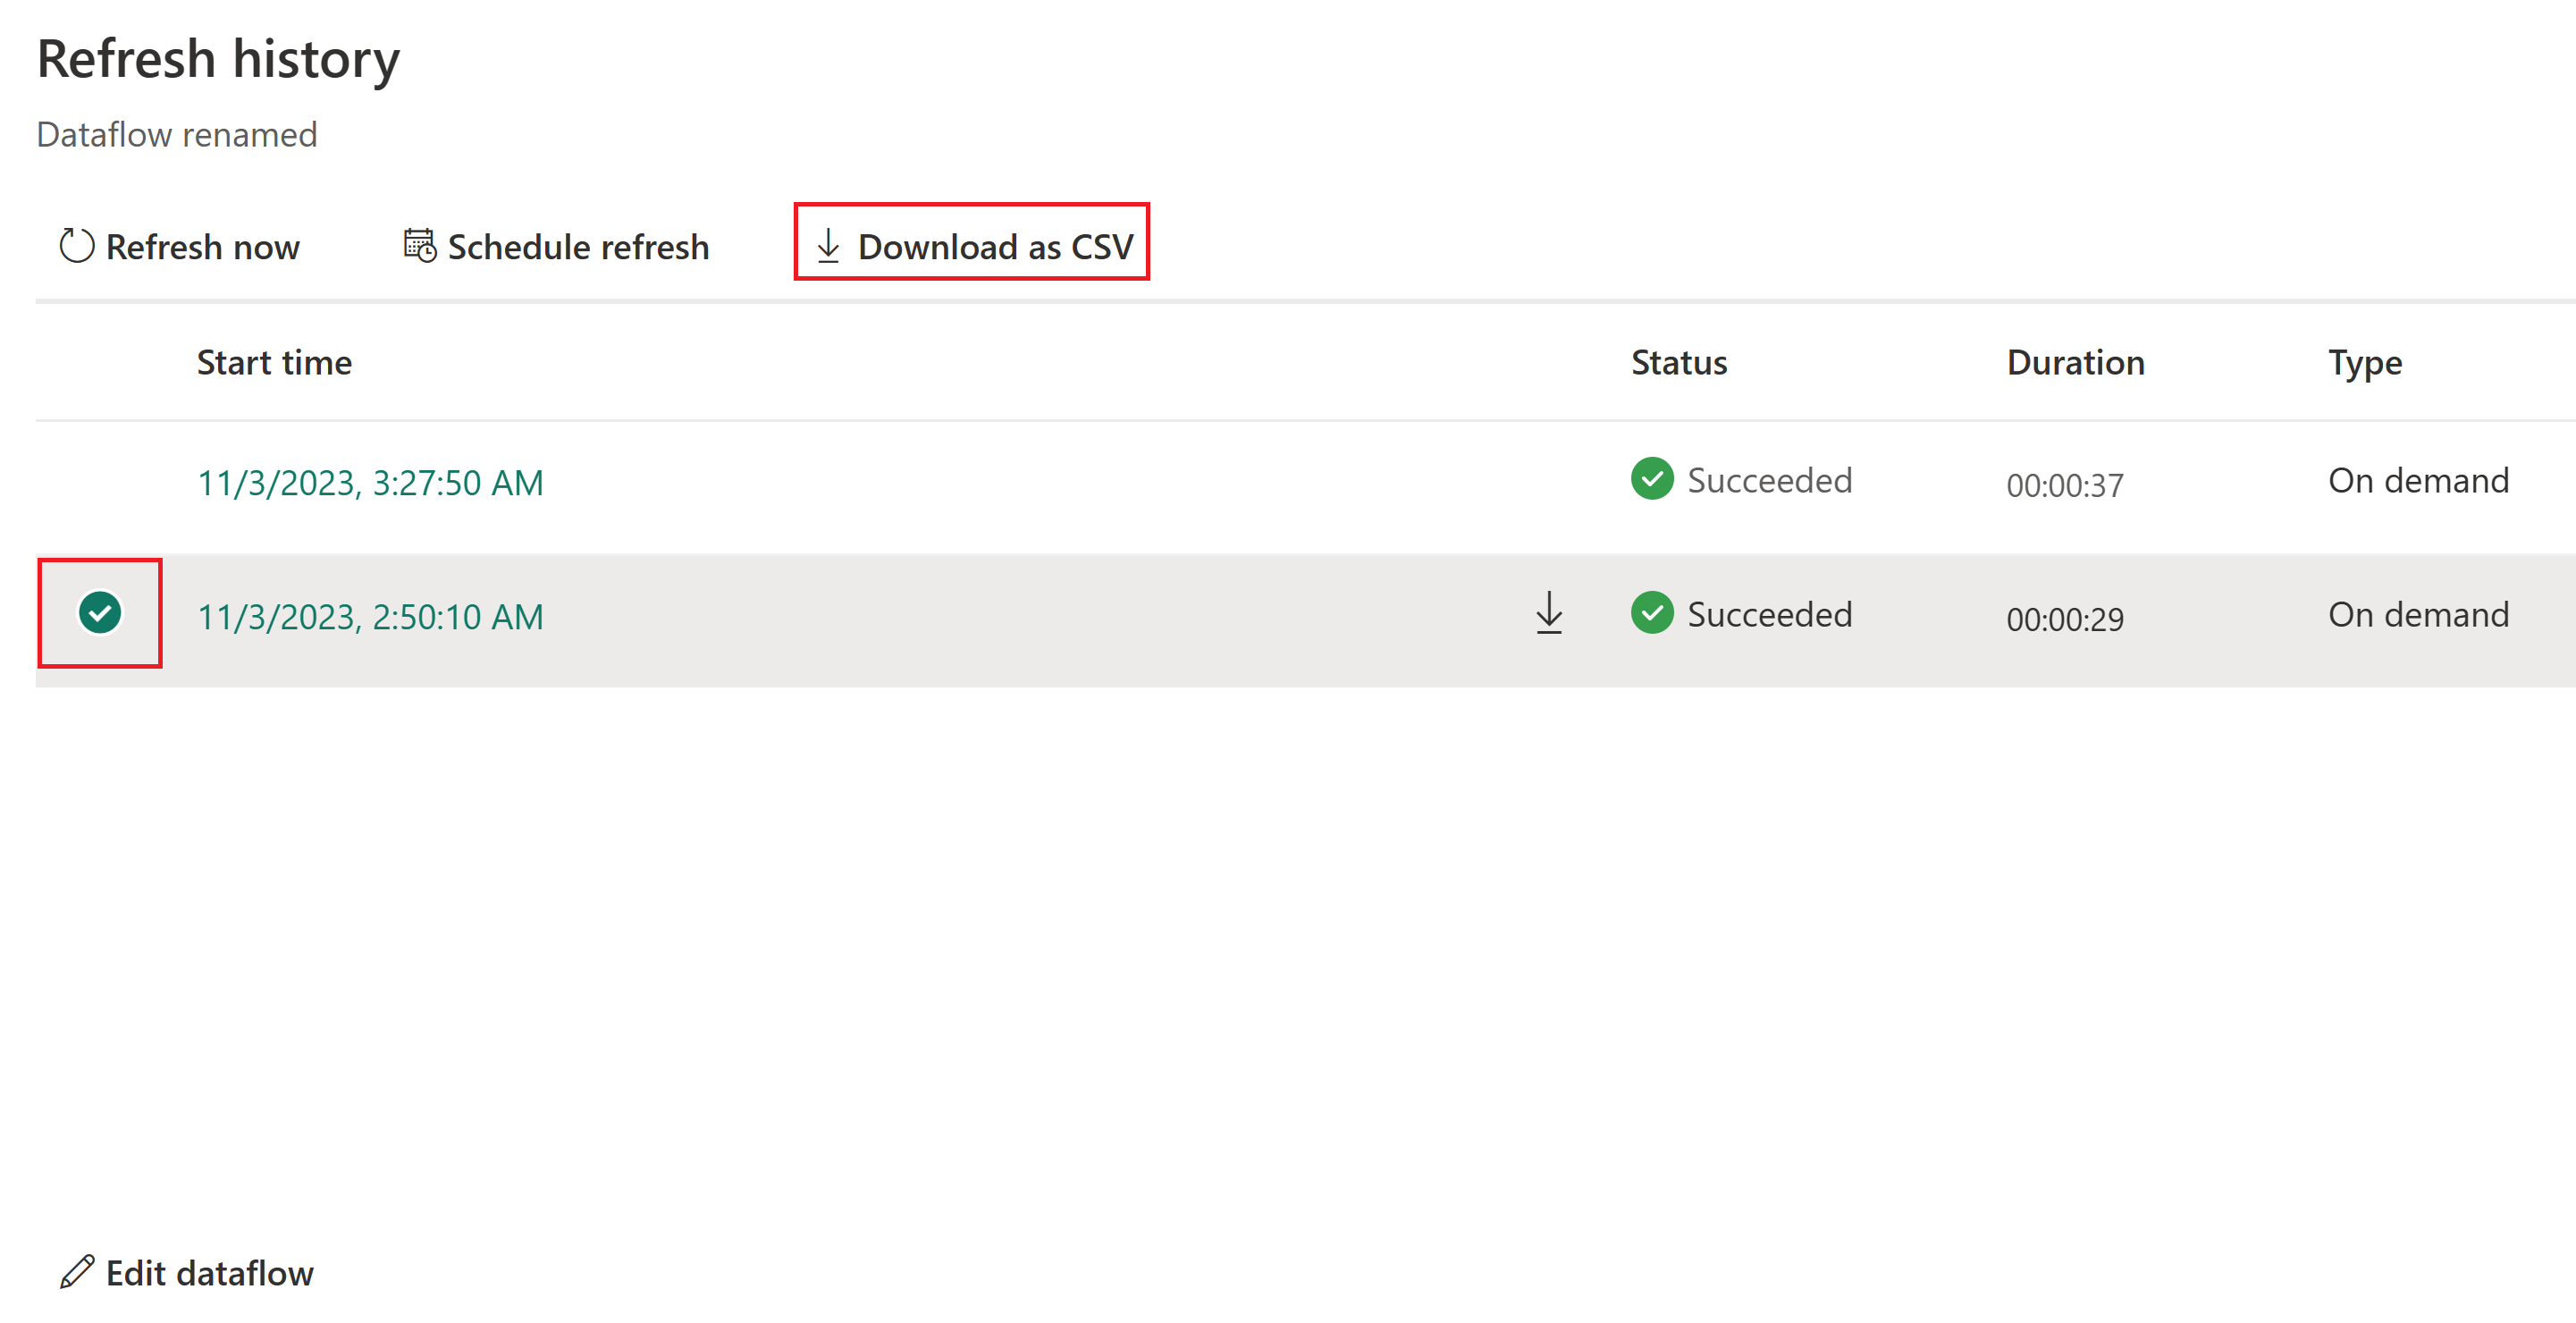
When you open your dataflow refresh history, you first notice a list of all your data refreshes. This first screen provides you with information about:
- Start time
- Status
- Duration
- Type

We show you up to 50 refresh histories or up to 6 months back (which ever comes first) and store up to 250 refresh histories or 6 months back in the onelake. You can take some actions right away from this page like start a new refresh, schedule a refresh, or edit the dataflow.
Download a CSV file of the refresh
Some times you might need to get a CSV file of your refresh. To get this file, take the following steps:
Open the refresh history of the dataflow.
Select the run you want to get a CSV file from.
Download the CSV.

Reviewing your dataflow refresh from the UI
Once you determined which dataflow you want to investigate, you can drill down into one of the refreshes by selecting the Start time field. This screen provides you with more information about the refresh that was performed. This includes general information about the refresh and a list of tables and activities.

In short, this overview provides you:
- Status of the dataflow
- Type of refresh
- Start and End time
- Duration
- Request ID
- Session ID
- Dataflow ID
The Tables section reflects all the entities for which you enable loading in your dataflow. Meaning that those tables shown here are being loaded into the staging area of your dataflow. These tables are the entities you can access using the Power Query Dataflow connector in Power BI, Excel, or dataflows. You can select any of the listed table names to view the details of this specific table. Once you select the name, you arrive at the following Details screen:

The Activities section reflects all the actions that took place during the refresh, for example loading data to your output destination. This table also allows you to dive deeper into the details of the specific activity. By selecting the name of the activity, you arrive at the following Details screen:

This screen gives you more clarity in what happened during the activity. For example, for output destinations the activity screen provides you with the:
- Status of the Activity
- Start and End time
- Duration
- Activity statistics:
- Endpoints contacted
- Volume processed by the connector
- Bytes read
- Rows read
- Bytes written
- Rows written
- Volume processed by the connector
- Endpoints contacted
To investigate what happened, you can drill down into an activity or table. The following screen provides you with general information about the refresh and errors. If you're drilling into an activity, you're presented with how much data got processed and sent to your output destination. Some connectors report on the number of rows and some report on the number of bytes. The statistics are shown in the Activity statistics section.
Monitoring hub
The monitoring hub is available using the side menu. You can access it by selecting the Monitoring hub button.
The monitoring hub provides you with a dashboard that gives you an overview of the status of your dataflows.

This dashboard provides you with the following information:
- Status of your dataflows
- Start time of the refresh
- Refresh duration
- Submitter of the refresh
- Workspace name
- Fabric capacity used for the refresh of your dataflow
- Average refresh duration
- Number of refreshes per day
- Type of refresh