Note
Access to this page requires authorization. You can try signing in or changing directories.
Access to this page requires authorization. You can try changing directories.
Important
This feature is in preview.
The operations agent for pipelines is an AI-powered feature in Microsoft Fabric that helps you monitor, diagnose, and optimize data pipeline executions automatically. Unlike general-purpose AI agents, this feature is purpose-built for Fabric pipeline operations.
Built directly into the pipeline experience, the agent analyzes pipeline runs, logs, and performance signals to deliver actionable insights without manual investigation. The agent continuously operates in a loop: observe, analyze, recommend, and act.
This approach lets you move from reactive debugging to proactive pipeline operations.
Why use the operations agent?
Managing pipelines at scale often requires:
- Manually reviewing run history and logs
- Diagnosing failures across multiple activities
- Interpreting performance bottlenecks
- Building custom queries or dashboards
The operations agent reduces this effort by automating these workflows.
Key benefits
- Accelerate troubleshooting: Quickly identify root causes of pipeline failures.
- Reduce manual effort: Eliminate the need to manually collect logs and signals.
- Proactive monitoring: Detect issues early with continuous analysis.
- Improve pipeline reliability: Maintain stable, production-grade Workflows at scale.
- Actionable recommendations: Get targeted guidance to optimize performance and health.
How to use the operations agent
Fabric Data Factory integrates the operations agent and automatically uses pipeline context.
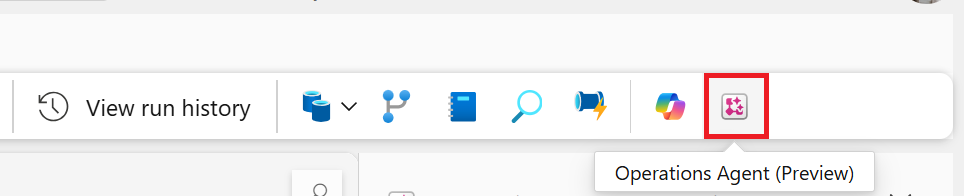
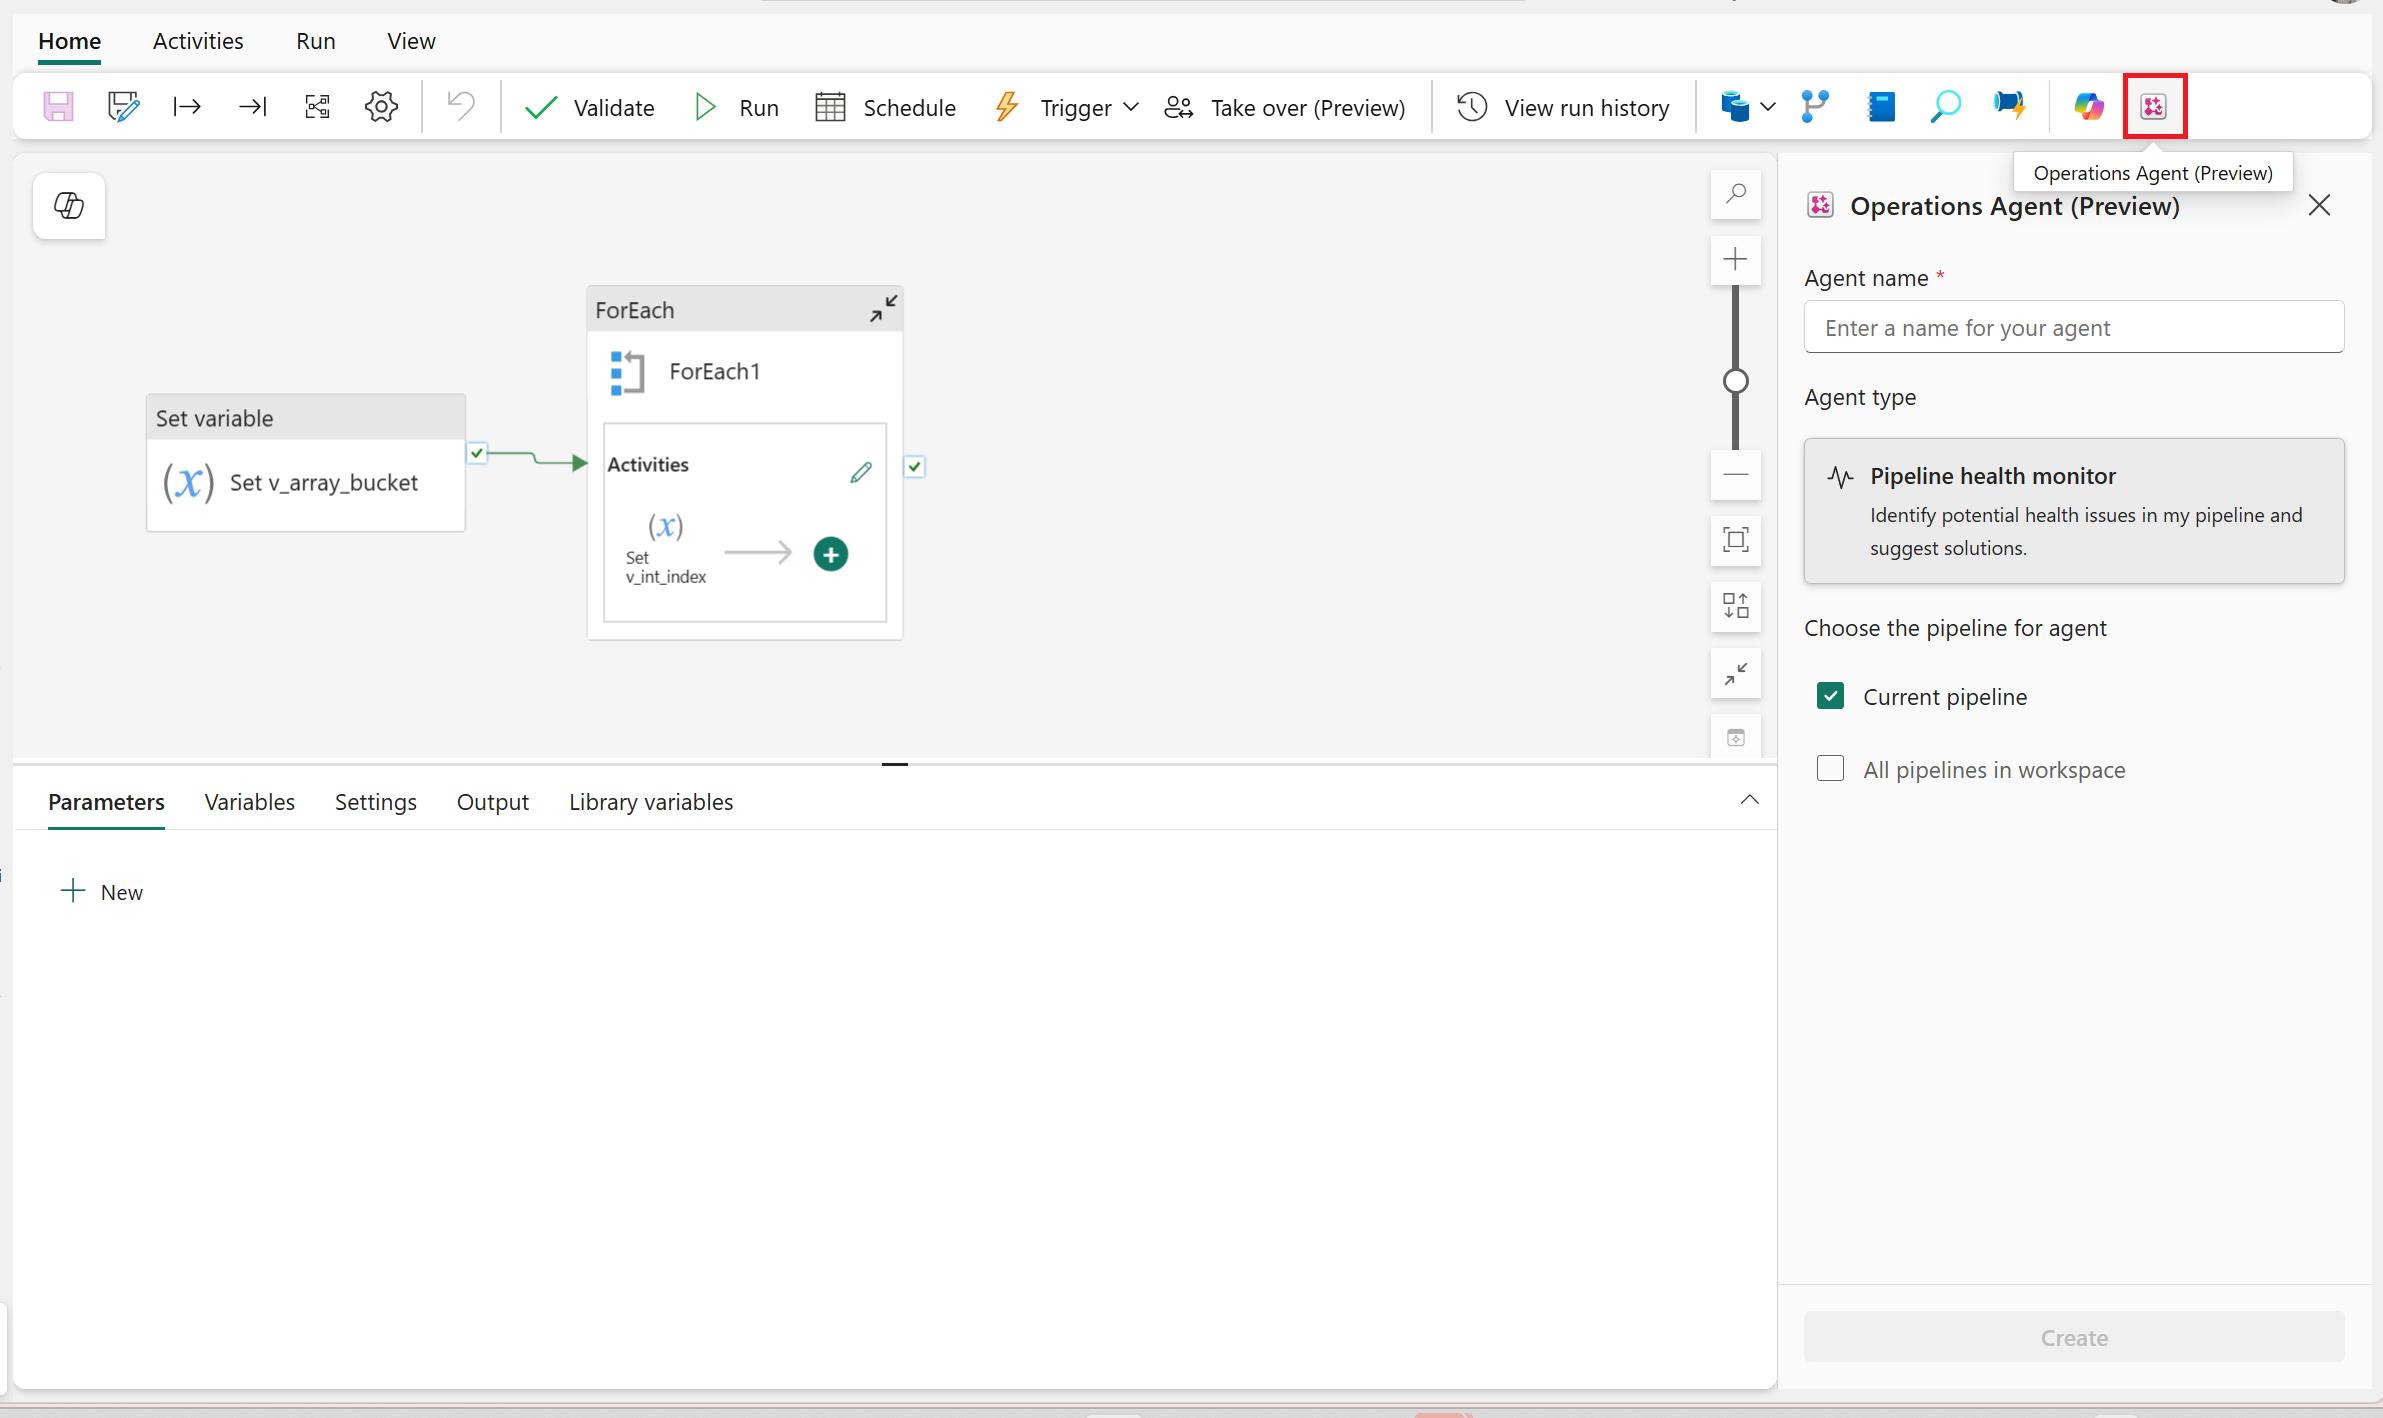
Access the operations agent from the Home ribbon on your pipeline canvas.
Select a pipeline scenario and generate your agent. Choose your preconfigured agent and whether the agent monitors your current pipeline or all pipelines in your workspace.
Note
Currently, the operations agent only supports health monitoring scenarios.
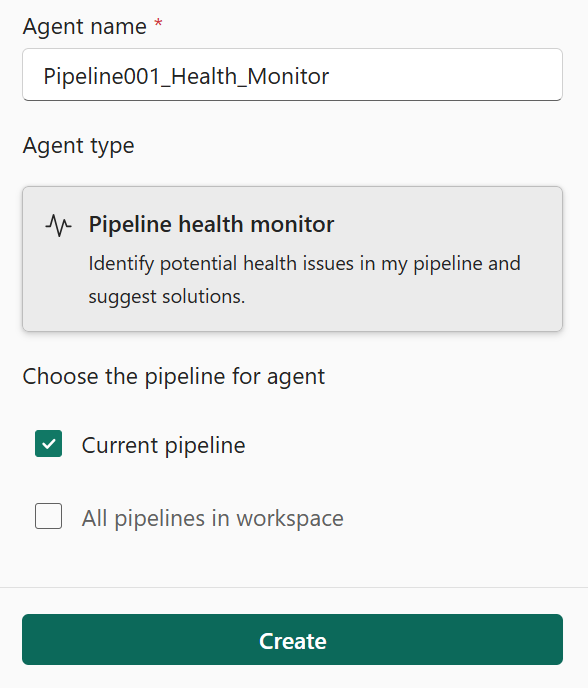
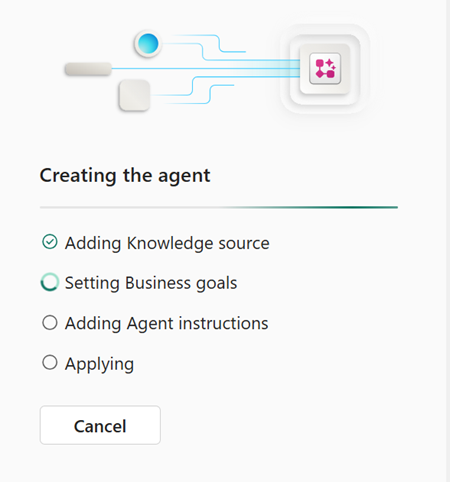
Select Create to generate your agent.
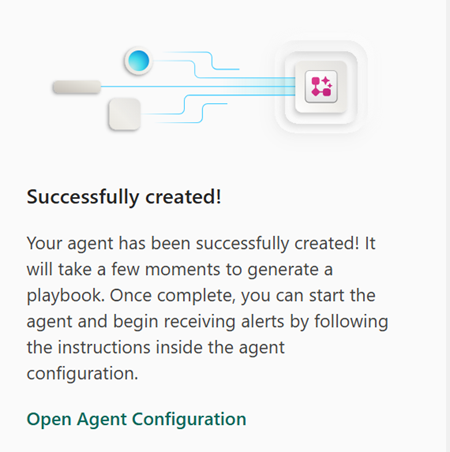
After you create the agent, select Open Agent Configuration to view your operations agent item.
The agent includes automatic context injection and uses:
- Pipeline execution logs
- Activity-level metadata
- Performance and runtime signals
You don't need to set up or configure the agent manually. The agent monitors pipeline behavior over time and builds insights based on observed patterns, including:
- Root Cause Analysis for failures
- Detection of bottlenecks and anomalies
- Recommendations for optimization
- Alerts or notifications for issues
Within your operations agent item, you can edit the agent instructions to update the playbook. You can extend your agent with specific actions, track logs, and add more context for the agent to monitor.
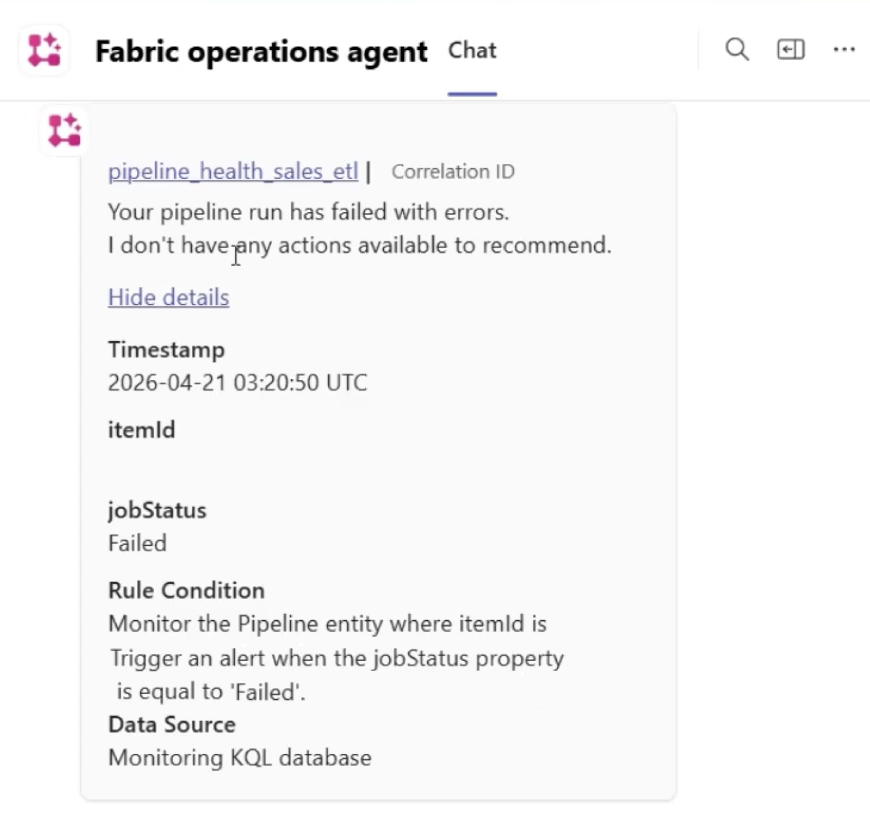
Select Start in the top ribbon of the operations agent item to run your agent. The agent sends you pipeline monitoring insights through Teams.

Core capabilities
| Capability | Description |
|---|---|
| Pipeline health monitoring | Track success and failure rates, execution patterns, and abnormal behavior across runs. |
| Failure diagnosis | Analyze pipeline and activity-level failures to identify likely root causes. |
| Performance optimization | Highlight slow activities and detect bottlenecks impacting pipeline performance. |
| Proactive alerting | Surface issues early based on observed trends and conditions. |
| Scenario-driven setup | Quickly get started using templates tailored for pipeline scenarios. |
Example scenarios
Diagnose a failed pipeline
When a Fabric Data Factory pipeline fails, the operations agent can:
- Analyze execution logs and history
- Identify the failing activity
- Provide a likely root cause
- Suggest next steps for resolution
Optimize pipeline performance
For slow Fabric Data Factory pipelines, the operations agent can:
- Detect long-running activities
- Highlight inefficiencies
- Recommend targeted improvements
Monitor pipeline health at scale
For production environments with many Fabric pipelines, the operations agent can:
- Continuously track pipeline health
- Identify anomalous failure patterns
- Surface risks before they escalate
When to use the operations agent
Use the operations agent when:
- You run production pipelines at scale.
- You need faster failure diagnosis.
- You want proactive monitoring and insights.
- You want to reduce manual operational overhead.