Note
Access to this page requires authorization. You can try signing in or changing directories.
Access to this page requires authorization. You can try changing directories.
In this tutorial, we provide end-to-end steps to a common scenario that uses the pipeline to load source data into Lakehouse at high performance copy and then transform the data by dataflow to make users can easily load and transform data.
Prerequisites
A Microsoft Fabric enabled workspace. If you don't already have one, refer to the article Create a workspace.
Create a pipeline
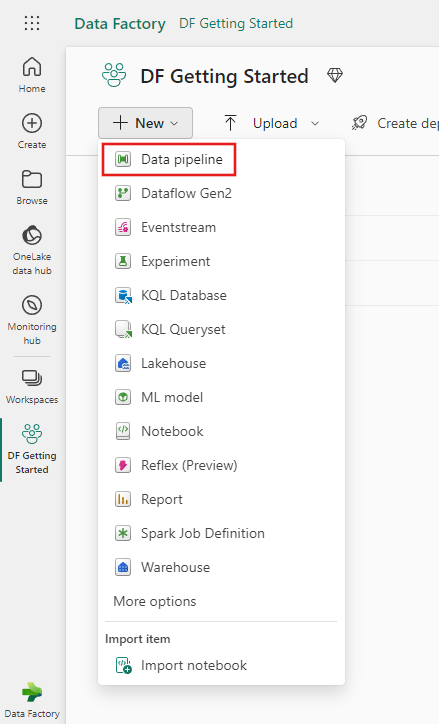
Switch to the Data Factory experience.
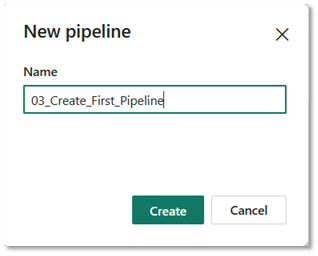
Select New and then Pipeline, and then input a name for your pipeline.
Use a pipeline to load sample data into Lakehouse
Use the following steps to load sample data into Lakehouse.
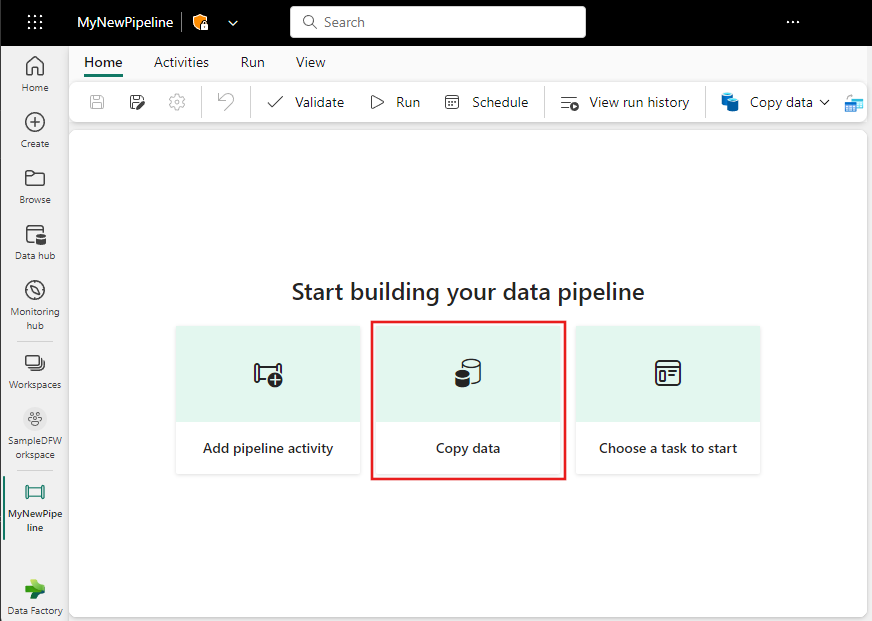
Step 1: Start with the Copy assistant
Select Copy data assistant on the canvas to open the copy assistant tool to get started. Or Select Use copy assistant from the Copy data drop down list under the Activities tab on the ribbon.
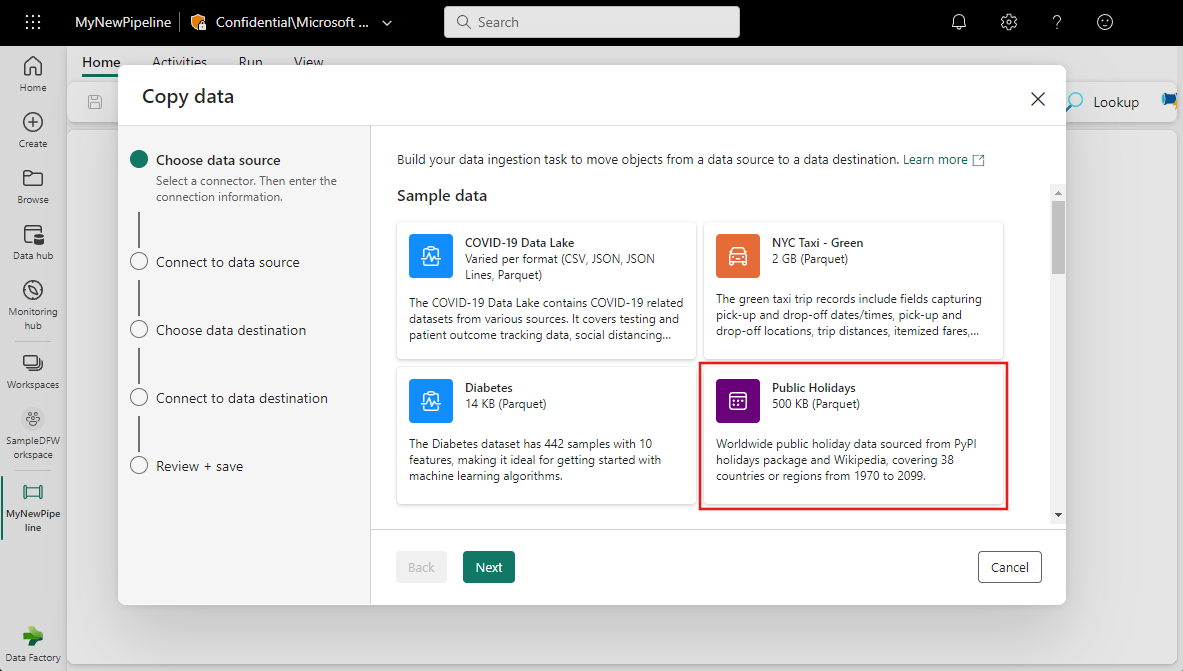
Step 2: Configure your source
Choose the Public Holidays from the Sample data options for your data source, and then select Next.
In the Connect to data source section of the Copy data assistant, a preview of the sample data is displayed. Select Next to move on to the data destination.

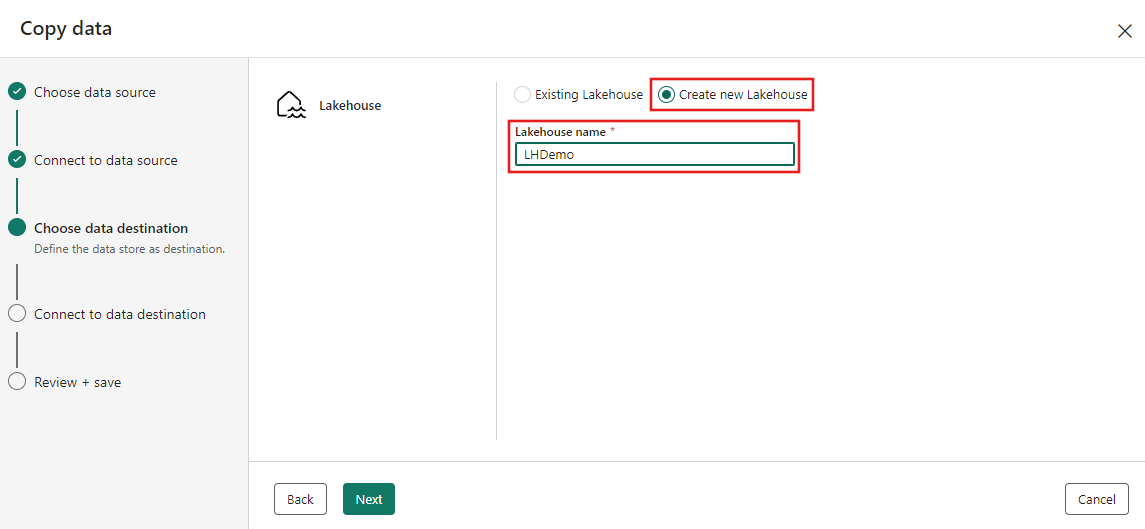
Step 3: Configure your destination
Select Lakehouse.

Enter LHDemo for the Lakehouse name, then select Create and connect.
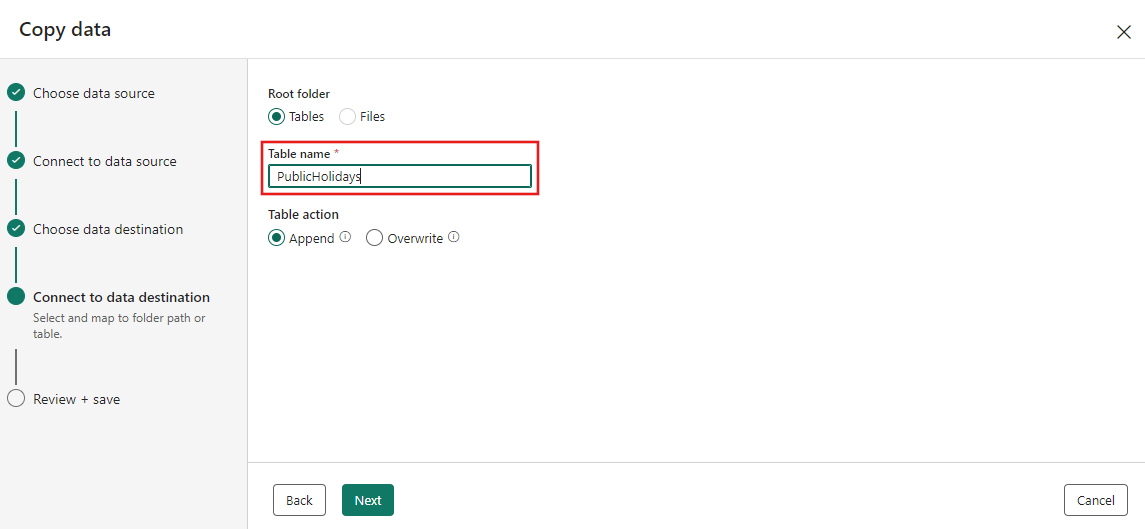
Configure and map your source data to the destination Lakehouse table. Select Tables for the Root folder and Load to new table for Load settings. Provide a Table name and select Next.
Step 4: Review and create your copy activity
Review your copy activity settings in the previous steps and select Start data transfer immediately. Then select Save + Run to run the new pipeline.

Once finished, the copy activity is added to your new pipeline canvas, and the pipeline automatically runs to load data into Lakehouse.
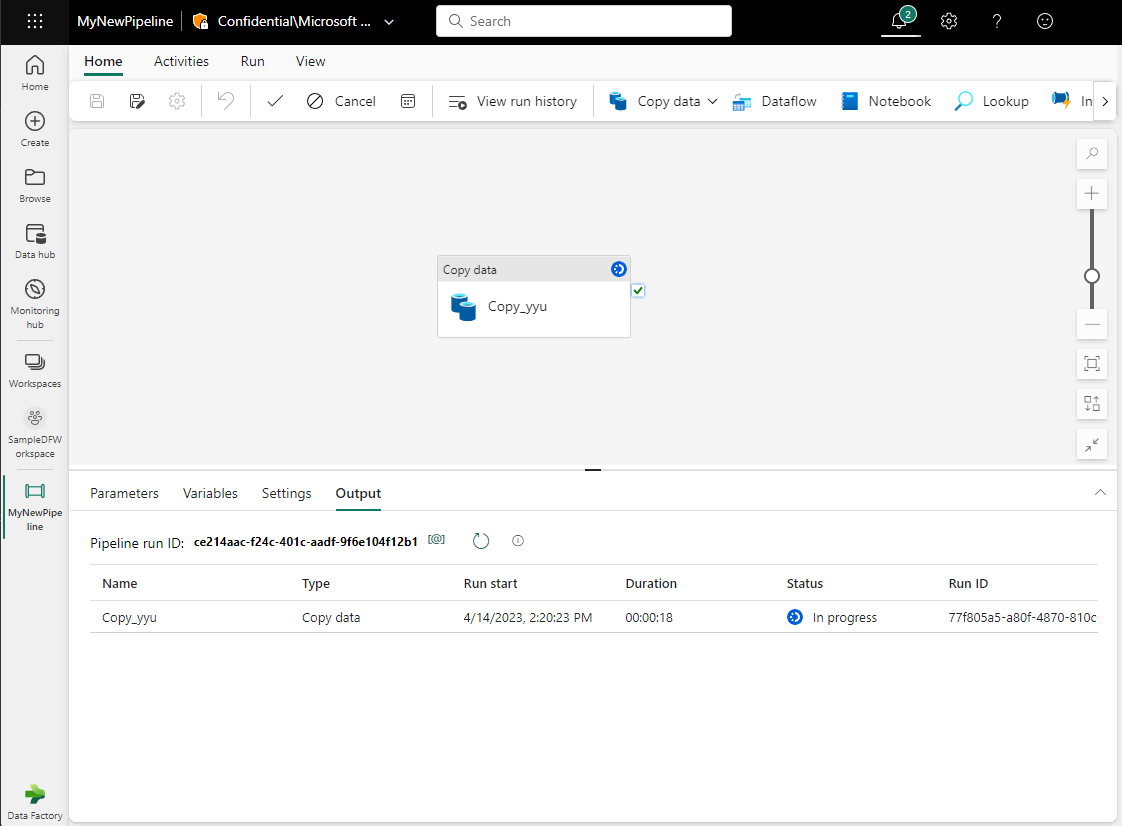
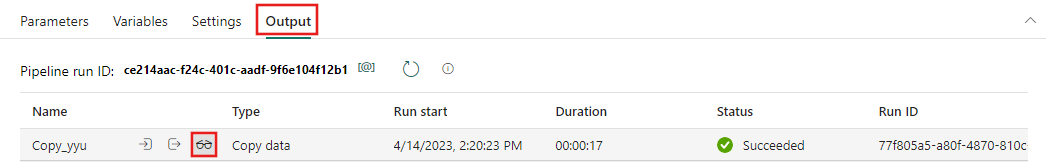
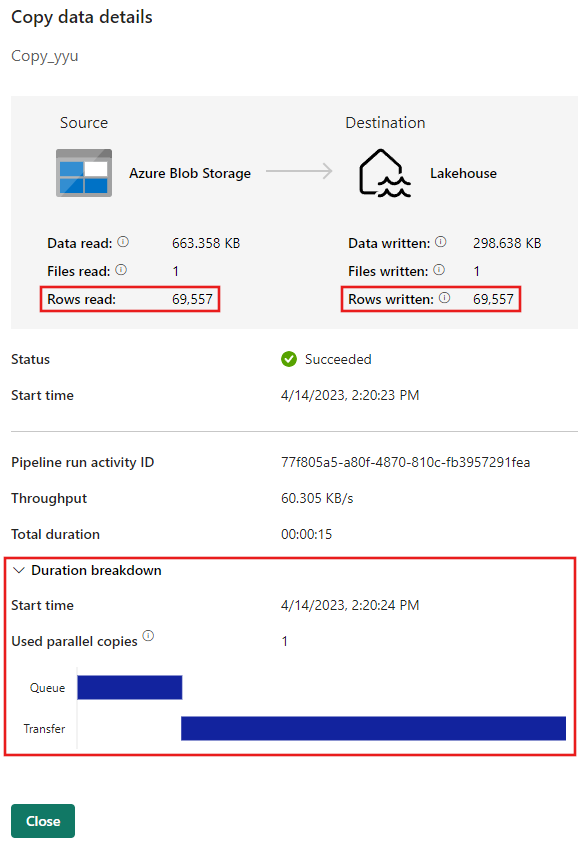
You can monitor the running process and check the results on the Output tab below the pipeline canvas. Hover over the name in the output row to see the Run details button (an icon of a pair of glasses, highlighted) to view the run details.
The run details show 69,557 rows were read and written, and various other details about the run, including a breakdown of the duration.
Use a Dataflow Gen2 to transform data in the Lakehouse
You now have a Lakehouse with sample data loaded. Next, you'll use a dataflow to transform the data. Dataflows are a code-free way to transform data at scale.
Select your workspace, then select New item > Dataflow Gen2.

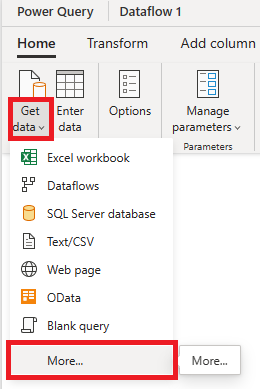
Select the get data dropdown and select More....
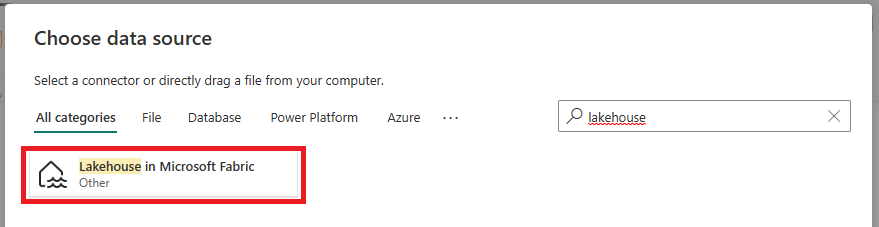
Search for Lakehouse and select Lakehouse.
Sign-in and select Next to continue.

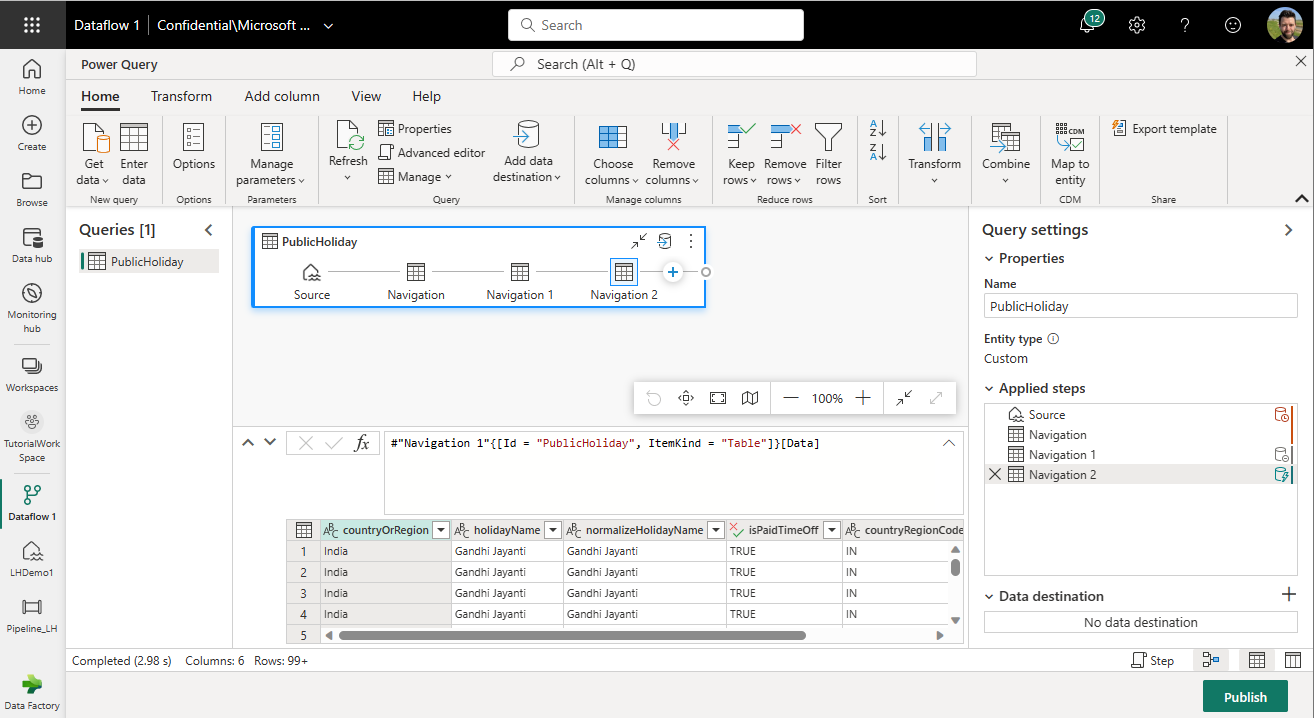
Select the table you created in the previous step and select Create.

Review the data preview in the editor.
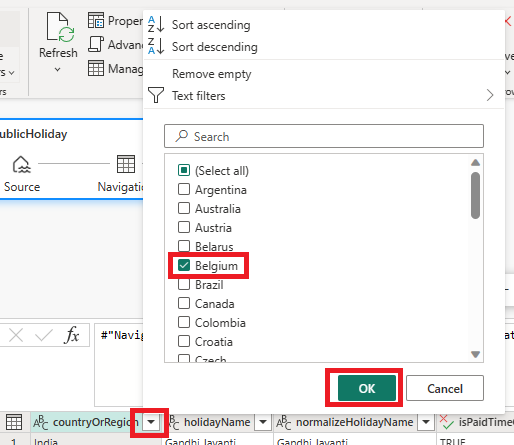
Apply a filter to the dataflow to only include rows where the Countryorregion column is equal to Belgium.
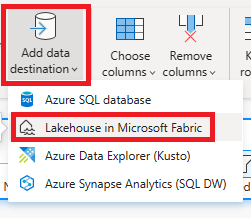
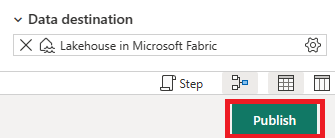
Add a data destination to the query by selecting Add data destination and then Lakehouse in Microsoft Fabric.
Sign-in and select Next to continue.
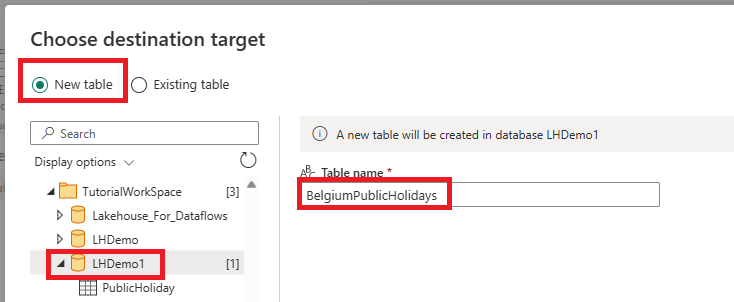
Create a new table called BelgiumPublicHolidays and select Next.
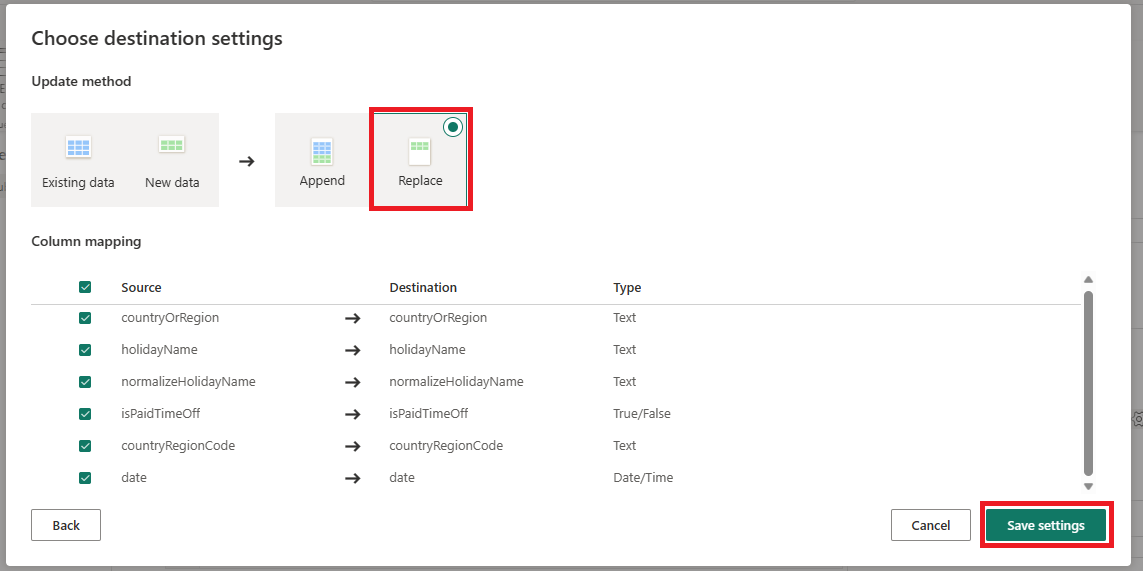
Review the settings and select Save settings.
Publish the dataflow by selecting Publish.
After the dataflow is published, select Refresh now to run the dataflow.


After the refresh is complete, you can view the data in the Lakehouse table. You can also use this data now to create reports, dashboards, and more.
Related content
This sample shows you how to copy sample data to Lakehouse and transform the data with a dataflow using Data Factory in Microsoft Fabric. You learned how to:
- Create a pipeline.
- Use the pipeline to load sample data into Lakehouse.
- Use dataflow to transform data in the Lakehouse.
Next, advance to learn more about monitoring your pipeline runs.