Note
Access to this page requires authorization. You can try signing in or changing directories.
Access to this page requires authorization. You can try changing directories.
This tutorial takes 15 minutes, and describes how to incrementally amass data into a lakehouse using Dataflow Gen2.
Incrementally amassing data in a data destination requires a technique to load only new or updated data into your data destination. This technique can be done by using a query to filter the data based on the data destination. This tutorial shows how to create a dataflow to load data from an OData source into a lakehouse and how to add a query to the dataflow to filter the data based on the data destination.
The high-level steps in this tutorial are as follows:
- Create a dataflow to load data from an OData source into a lakehouse.
- Add a query to the dataflow to filter the data based on the data destination.
- (Optional) reload data using notebooks and pipelines.
Prerequisites
You must have a Microsoft Fabric enabled workspace. If you don't already have one, refer to Create a workspace. Also, the tutorial assumes you're using the diagram view in Dataflow Gen2. To check if you're using the diagram view, in the top ribbon go to View and make sure Diagram view is selected.
Create a dataflow to load data from an OData source into a lakehouse
In this section, you create a dataflow to load data from an OData source into a lakehouse.
Create a new lakehouse in your workspace.

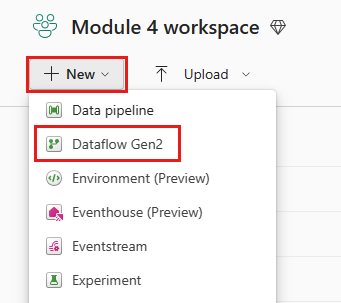
Create a new Dataflow Gen2 in your workspace.
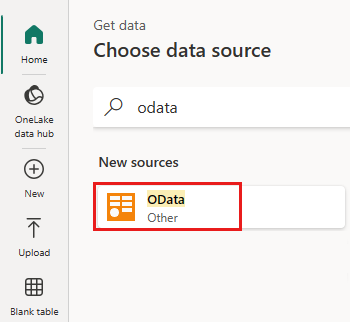
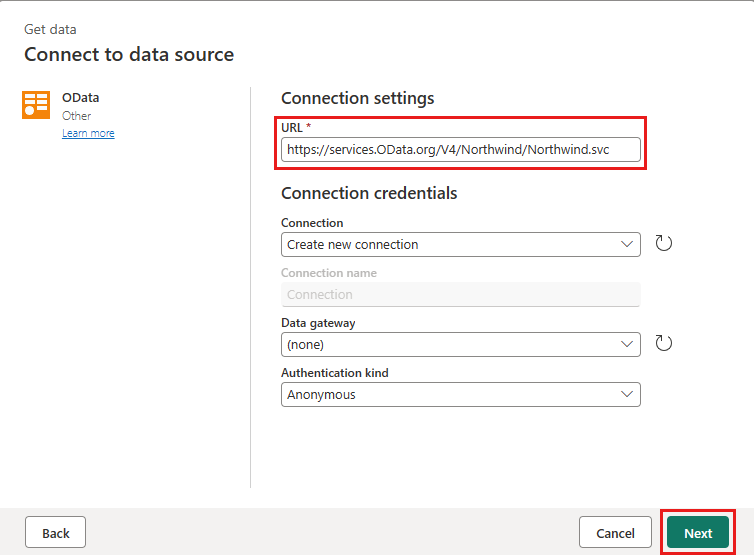
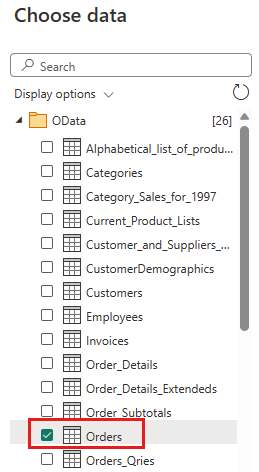
Add a new source to the dataflow. Select the OData source and enter the following URL:
https://services.OData.org/V4/Northwind/Northwind.svc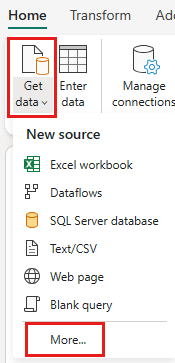
Select the Orders table and select Next.
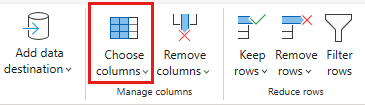
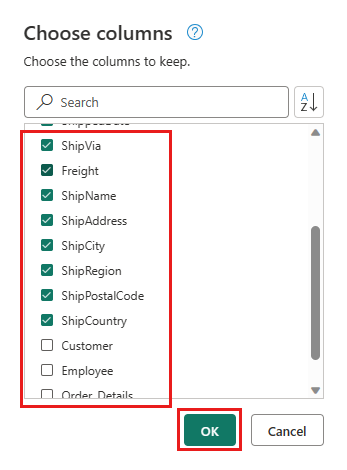
Select the following columns to keep:
OrderIDCustomerIDEmployeeIDOrderDateRequiredDateShippedDateShipViaFreightShipNameShipAddressShipCityShipRegionShipPostalCodeShipCountry
Change datatype of
OrderDate,RequiredDate, andShippedDatetodatetime.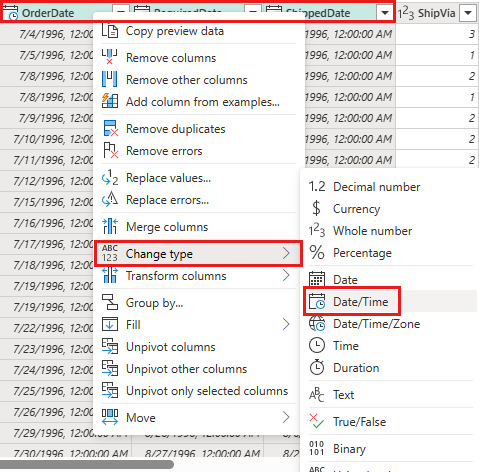
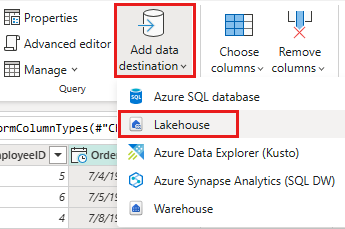
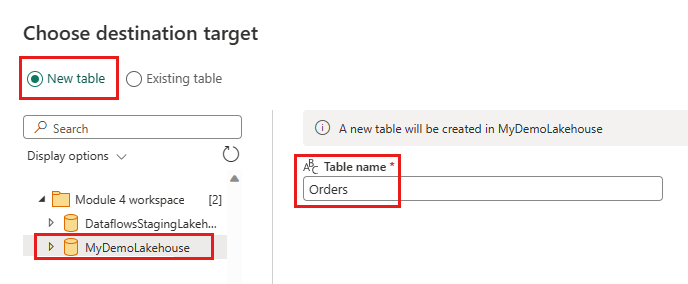
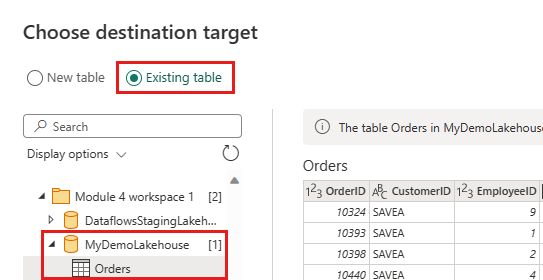
Set up the data destination to your lakehouse using the following settings:
- Data destination:
Lakehouse - Lakehouse: Select the lakehouse you created in step 1.
- New table name:
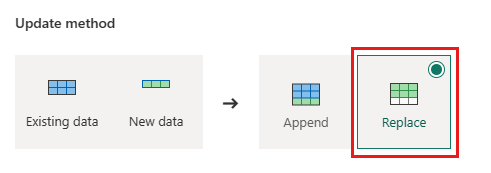
Orders - Update method:
Replace
- Data destination:
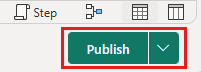
select Next and publish the dataflow.


You have now created a dataflow to load data from an OData source into a lakehouse. This dataflow is used in the next section to add a query to the dataflow to filter the data based on the data destination. After that, you can use the dataflow to reload data using notebooks and pipelines.
Add a query to the dataflow to filter the data based on the data destination
This section adds a query to the dataflow to filter the data based on the data in the destination lakehouse. The query gets the maximum OrderID in the lakehouse at the beginning of the dataflow refresh and uses the maximum OrderId to only get the orders with a higher OrderId from to source to append to your data destination. This assumes that orders are added to the source in ascending order of OrderID. If this isn't the case, you can use a different column to filter the data. For example, you can use the OrderDate column to filter the data.
Note
OData filters are applied within Fabric after the data is received from the data source, however, for database sources like SQL Server, the filter is applied in the query submitted to the backend data source, and only filtered rows are returned to the service.
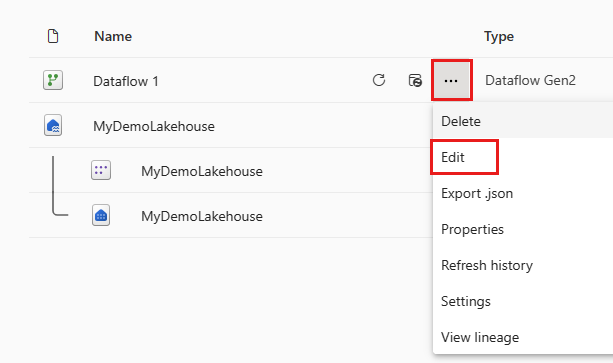
After the dataflow refreshes, reopen the dataflow you created in the previous section.
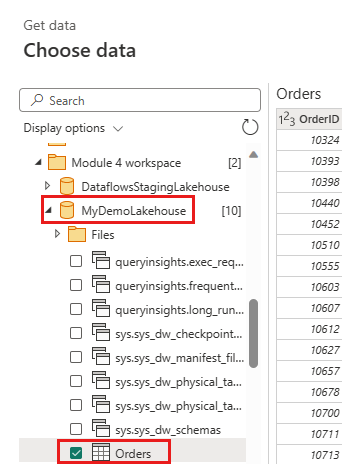
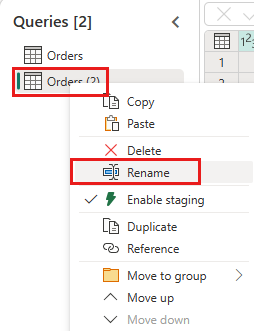
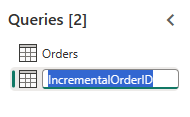
Create a new query named
IncrementalOrderIDand get data from the Orders table in the lakehouse you created in the previous section.

Disable staging of this query.

In the data preview, right-click on the
OrderIDcolumn and select Drill down.
From the ribbon, select List Tools -> Statistics -> Maximum.

You now have a query that returns the maximum OrderID in the lakehouse. This query is used to filter the data from the OData source. The next section adds a query to the dataflow to filter the data from the OData source based on the maximum OrderID in the lakehouse.
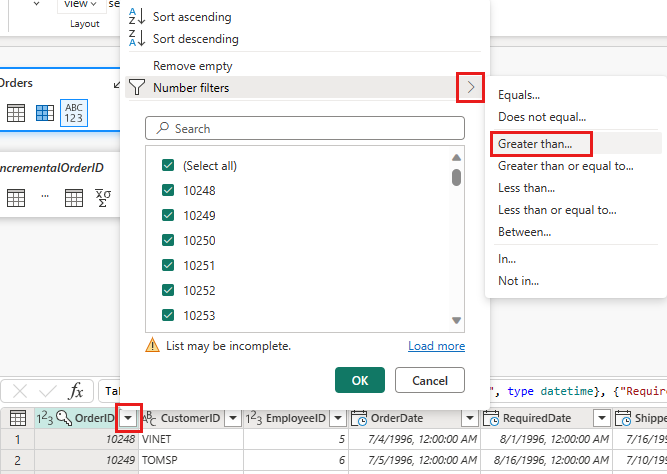
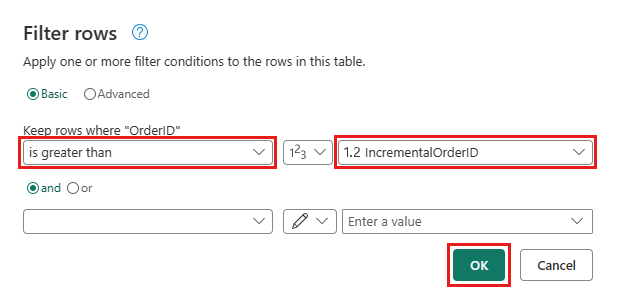
Go back to the Orders query and add a new step to filter the data. Use the following settings:
- Column:
OrderID - Operation:
Greater than - Value: parameter
IncrementalOrderID
- Column:
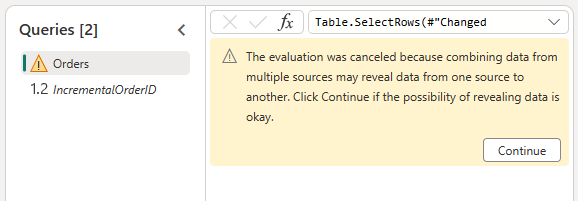
Allow combining the data from the OData source and the lakehouse by confirming the following dialog:
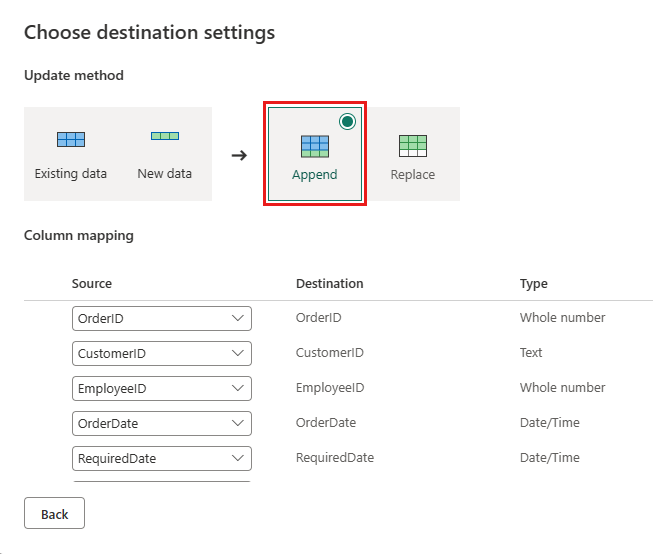
Update the data destination to use the following settings:
- Update method:
Append
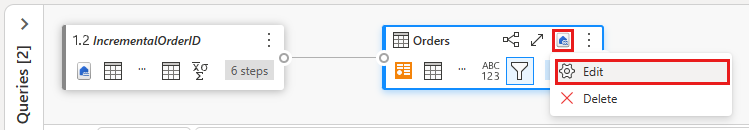
- Update method:
Publish the dataflow.
Your dataflow now contains a query that filters the data from the OData source based on the maximum OrderID in the lakehouse. This means that only new or updated data is loaded into the lakehouse. The next section uses the dataflow to reload data using notebooks and pipelines.
(Optional) reload data using notebooks and pipelines
Optionally, you can reload specific data using notebooks and pipelines. With custom python code in the notebook, you remove the old data from the lakehouse. By then creating a pipeline in which you first run the notebook and sequentially run the dataflow, you reload the data from the OData source into the lakehouse. Notebooks support multiple languages, but this tutorial uses PySpark. Pyspark is a Python API for Spark and is used in this tutorial to run Spark SQL queries.
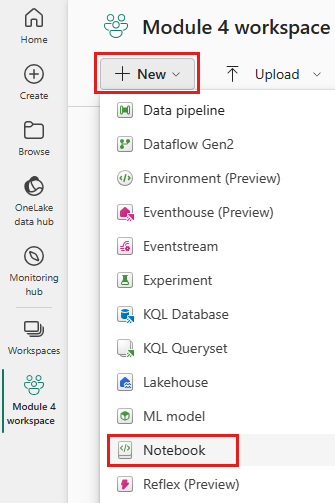
Create a new notebook in your workspace.
Add the following PySpark code to your notebook:
### Variables
LakehouseName = "YOURLAKEHOUSE"
TableName = "Orders"
ColName = "OrderID"
NumberOfOrdersToRemove = "10"


### Remove Old Orders
Reload = spark.sql("SELECT Max({0})-{1} as ReLoadValue FROM {2}.{3}".format(ColName,NumberOfOrdersToRemove,LakehouseName,TableName)).collect()
Reload = Reload[0].ReLoadValue
spark.sql("Delete from {0}.{1} where {2} > {3}".format(LakehouseName, TableName, ColName, Reload))
Run the notebook to verify that the data is removed from the lakehouse.
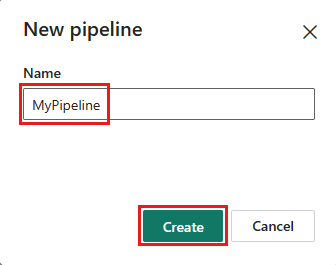
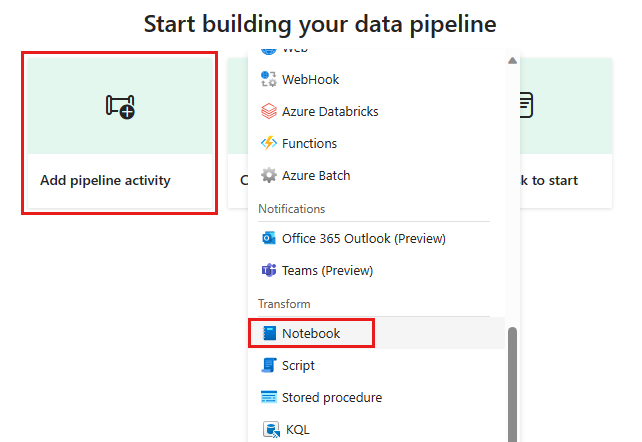
Create a new pipeline in your workspace.
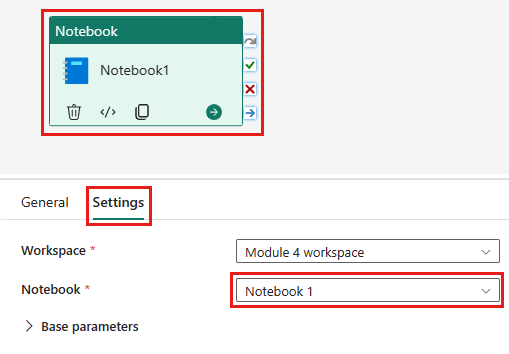
Add a new notebook activity to the pipeline and select the notebook you created in the previous step.
Add a new dataflow activity to the pipeline and select the dataflow you created in the previous section.
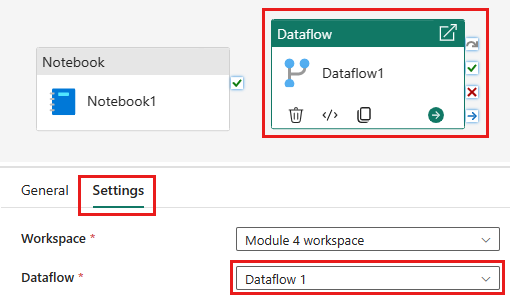
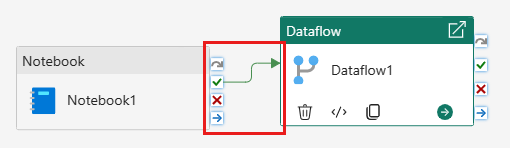
Link the notebook activity to the dataflow activity with a success trigger.
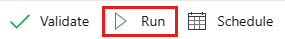
Save and run the pipeline.

You now have a pipeline that removes old data from the lakehouse and reloads the data from the OData source into the lakehouse. With this setup, you can reload the data from the OData source into the lakehouse regularly.