Note
Access to this page requires authorization. You can try signing in or changing directories.
Access to this page requires authorization. You can try changing directories.
The code interpreter tool gives your data agent a secure, sandboxed Python environment for analyzing the data it retrieves. With the tool enabled, your data agent can go beyond querying your data sources and answer natural language questions that require data analysis, mathematical computations, or visualizations. For example, you can ask your data agent to chart trends over time, detect correlations across columns, or combine results from multiple sources. The agent generates and runs the Python code on your behalf, and you can review the generated code, outputs, and Python visualizations directly in the run steps.
Important
This feature is in preview.
Prerequisites
- A paid F2 or higher Fabric capacity, or a Power BI Premium per capacity (P1 or higher) capacity with Microsoft Fabric enabled.
- Enable cross-geo processing and cross-geo storing for AI based on requirements explained in Fabric data agent tenant settings.
- At least one of these data sources, with data: A warehouse, a lakehouse, a Power BI semantic model, a KQL database, a mirrored database, or an ontology. You must have read access to the data source.
Add the code interpreter tool
To add the code interpreter tool to your data agent:
Open your data agent.
Select the Tools tab.
Select Add code interpreter.
In the confirmation dialog, select Confirm.
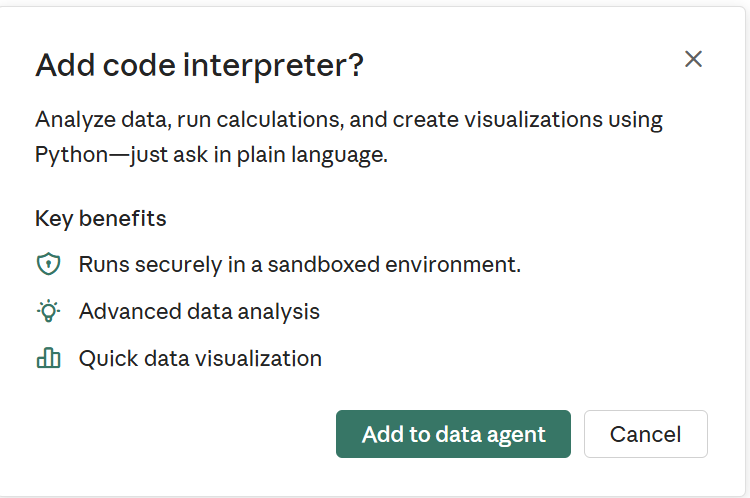


The code interpreter tool is now added to your data agent and ready to use.
Warning
The first time you use the code interpreter in an existing data agent chat, you may need to clear the thread before the agent picks up the new tool. Start a new chat or clear the existing thread to ensure the code interpreter is available.
Enable the code interpreter tool with the SDK
You can also enable the code interpreter tool programmatically by using the Fabric data agent Python SDK. This option is useful when you want to script the setup of your data agent or include it as part of an automated deployment.
from fabric.dataagent.client import (
    FabricDataAgentManagement,
    create_data_agent,
    delete_data_agent,
)

# Define the name for the data agent
data_agent_name = "<data agent name>"

# Create a new data agent (run this once)
data_agent = create_data_agent(
    data_agent_name,
)

# If the data agent already exists, use this instead to connect:
# data_agent = FabricDataAgentManagement(data_agent_name)

conf = data_agent._client.get_configuration()
conf.value["experimental"] = {"codeInterpreterEnabled": True}
data_agent._client.set_configuration(conf)
Ask questions
After you add the code interpreter tool, you can ask your data agent questions in natural language. The agent queries your connected data sources, passes the results to the code interpreter, and uses Python to analyze the data, run calculations, or generate visualizations. You don't need to write any code yourself.
Try questions like:
- Generate a heatmap of claim frequency by region and cause of loss over the past five years.
- Create a pairwise plot of customer tenure, monthly spend, and churn risk to explore correlations.
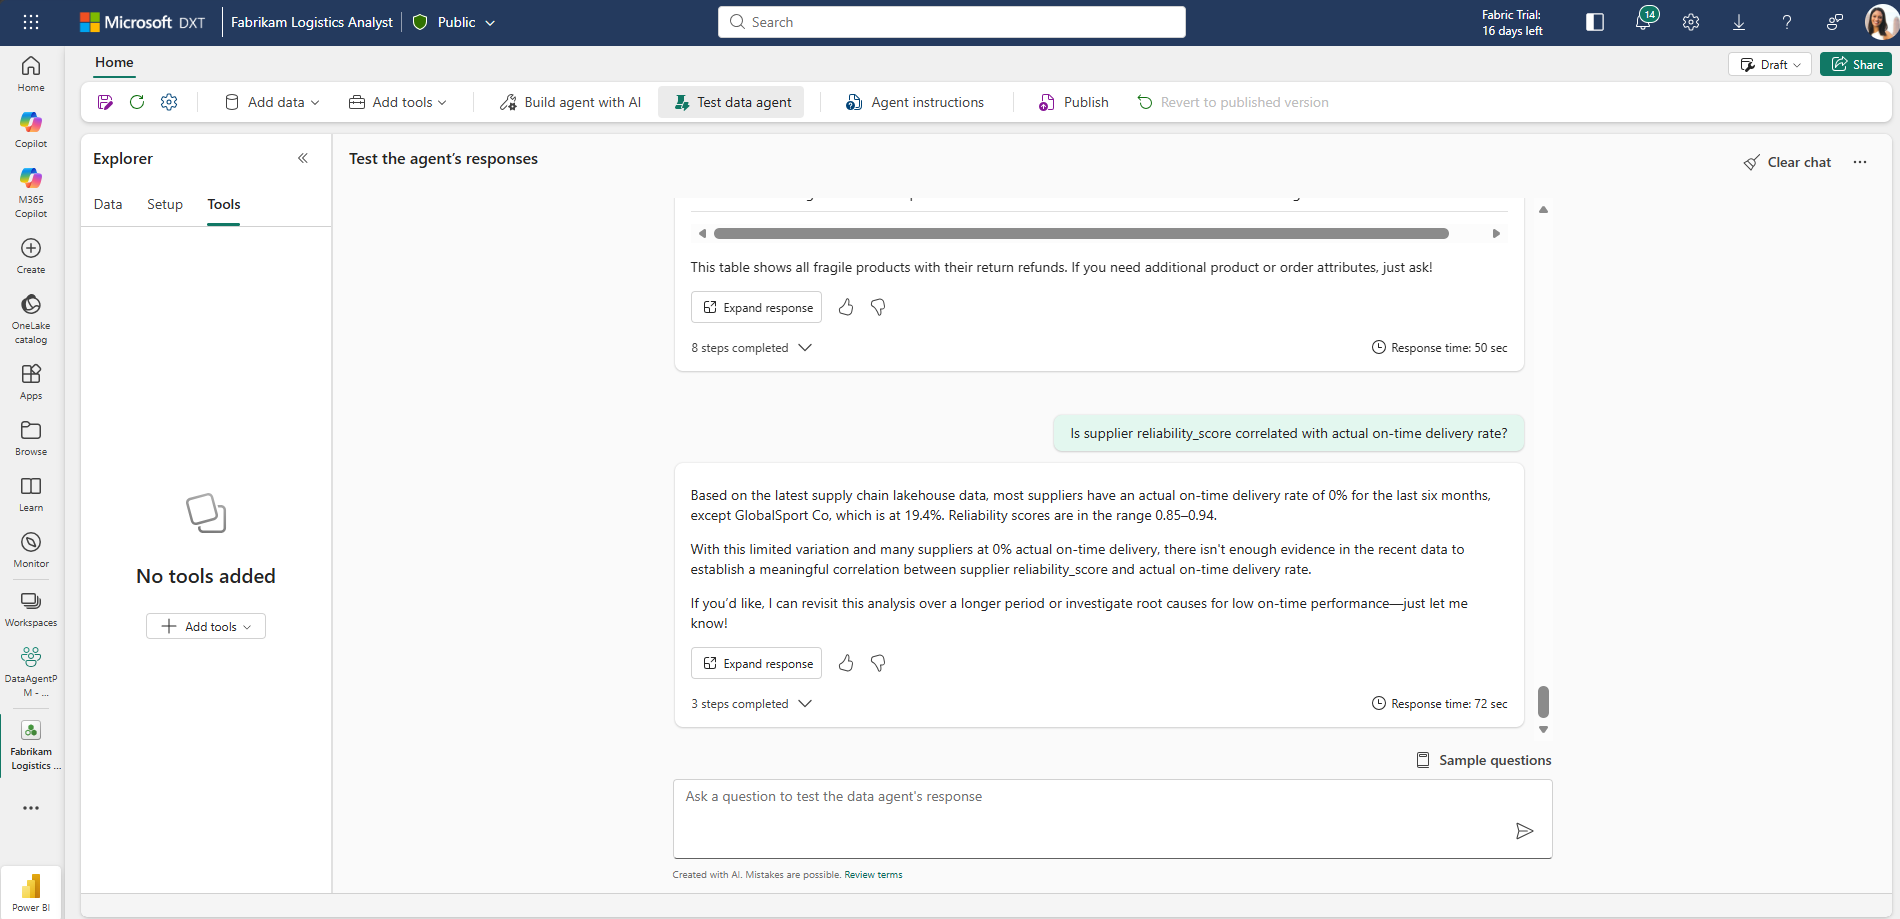
- Is supplier
reliability_scorecorrelated with actual on-time delivery rate? - Build a correlation heatmap across all supplier performance metrics—contracted
reliability_score, contractedlead_time_days, actual on-time delivery percentage, defect rate, actual lead time, units delivered, and total cost. Show me which metrics move together and which are independent. - Forecast next quarter's revenue based on the past three years of sales data.
Inspect the results
After your data agent answers a question, you can use the run steps to see exactly how the code interpreter produced the result. Expand the code interpreter step to view the Python code the agent generated, the inputs it ran against, and the output it returned. The run steps make it easy to validate the analysis, or troubleshoot unexpected results.

Use agent instructions
You can't add instructions directly to the code interpreter tool, but you can use agent-level instructions to shape how and when your data agent calls it. For example, you can guide the agent on when to prefer the code interpreter over another tool, what context to include in the request, or how to format the final result. For more information, see Configure your data agent.