Note
Access to this page requires authorization. You can try signing in or changing directories.
Access to this page requires authorization. You can try changing directories.
A machine learning experiment is the primary unit of organization and control for all related machine learning runs. A run corresponds to a single execution of model code. In MLflow, tracking is based on experiments and runs.
Machine learning experiments allow data scientists to log parameters, code versions, metrics, and output files when running their machine learning code. Experiments also let you visualize, search for, and compare runs, as well as download run files and metadata for analysis in other tools.
In this article, you learn more about how data scientists can interact with and use machine learning experiments to organize their development process and to track multiple runs.
Prerequisites
Get a Microsoft Fabric subscription. Or, sign up for a free Microsoft Fabric trial.
Sign in to Microsoft Fabric.
Switch to Fabric by using the experience switcher on the lower-left side of your home page.

Create an experiment
You can create a machine learning experiment directly from the Fabric user interface (UI) or by writing code that uses the MLflow API.
Create an experiment using the UI
To create a machine learning experiment from the UI:
Create a new workspace or select an existing one.
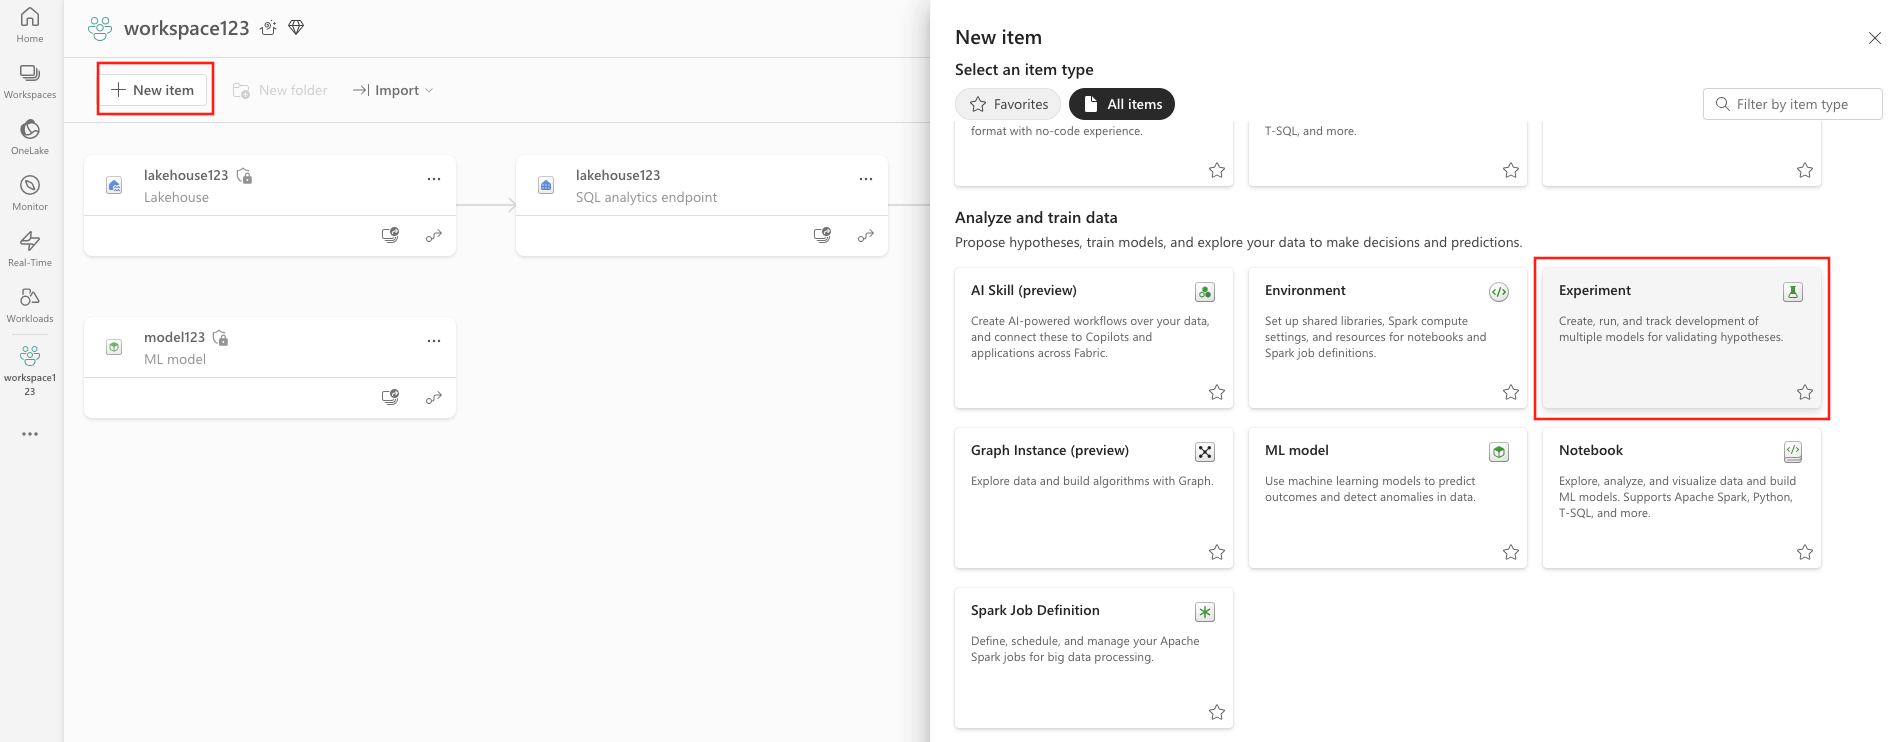
In the upper left of your workspace, select New item. Under Analyze and train data, select Experiment .
 OR
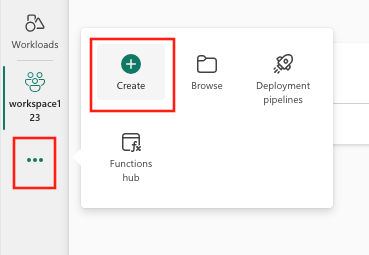
ORSelect Create, which can be found in ... from the vertical menu.
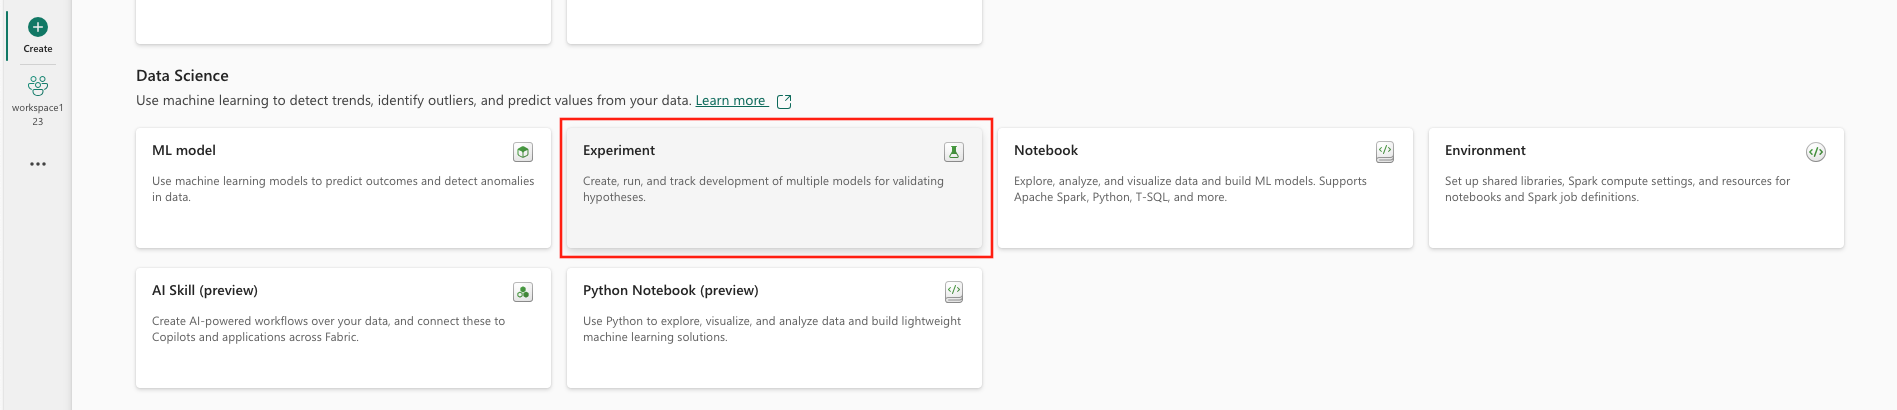
Under Data Science, select Experiment.
Provide an experiment name and select Create. This action creates an empty experiment within your workspace.


After creating the experiment, you can start adding runs to track run metrics and parameters.
Create an experiment using the MLflow API
You can also create a machine learning experiment directly from your authoring experience using the mlflow.create_experiment() or mlflow.set_experiment() APIs. In the following code, replace <EXPERIMENT_NAME> with your experiment's name.
import mlflow

# This will create a new experiment with the provided name.
mlflow.create_experiment("<EXPERIMENT_NAME>")

# This will set the given experiment as the active experiment.
# If an experiment with this name does not exist, a new experiment with this name is created.
mlflow.set_experiment("<EXPERIMENT_NAME>")
Manage runs within an experiment
A machine learning experiment contains a collection of runs for simplified tracking and comparison. Within an experiment, a data scientist can navigate across various runs and explore the underlying parameters and metrics. Data scientists can also compare runs within a machine learning experiment to identify which subset of parameters yield a desired model performance.
To view the runs for an experiment, select Run list from the experiment's view.

From the run list, you can navigate to the details of a specific run by selecting the run name.
Track run details
A machine learning run corresponds to a single execution of model code. You can track the following information for each run:

Each run includes the following information:
- Source: Name of the notebook that created the run.
- Registered Version: Indicates if the run was saved as a machine learning model.
- Start date: Start time of the run.
- Status: Progress of the run.
- Hyperparameters: Hyperparameters saved as key-value pairs. Both keys and values are strings.
- Metrics: Run metrics saved as key-value pairs. The value is numeric.
- Output files: Output files in any format. For example, you can record images, environment, models, and data files.
- Tags: Metadata as key-value pairs to runs.
View the run list
You can view all the runs in an experiment in the Run list view. This view allows you to keep track of recent activity, quickly jump to the related Spark application, and apply filters based on the run status.
Compare and filter runs
To compare and evaluate the quality of your machine learning runs, you can compare the parameters, metrics, and metadata between selected runs within an experiment.
Apply tags to runs
MLflow tagging for experiment runs allows users to add custom metadata in the form of key-value pairs to their runs. These tags help categorize, filter, and search for runs based on specific attributes, making it easier to manage and analyze experiments within the MLflow platform. Users can utilize tags to label runs with information such as model types, parameters, or any relevant identifiers, enhancing the overall organization and traceability of experiments.
This code snippet starts an MLflow run, logs some parameters and metrics, and adds tags to categorize and provide additional context for the run.
import mlflow
import mlflow.sklearn
from sklearn.model_selection import train_test_split
from sklearn.linear_model import LinearRegression
from sklearn.metrics import mean_squared_error
from sklearn.datasets import fetch_california_housing

# Autologging
mlflow.autolog()

# Load the California housing dataset
data = fetch_california_housing(as_frame=True)
X = data.data
y = data.target

# Split the data
X_train, X_test, y_train, y_test = train_test_split(X, y, test_size=0.2, random_state=42)

# Start an MLflow run
with mlflow.start_run() as run:

    # Train the model
    model = LinearRegression()
    model.fit(X_train, y_train)

    # Predict and evaluate
    y_pred = model.predict(X_test)

    # Add tags
    mlflow.set_tag("model_type", "Linear Regression")
    mlflow.set_tag("dataset", "California Housing")
    mlflow.set_tag("developer", "Bob")
Once the tags are applied, you can then view the results directly from the inline MLflow widget or from the run details page.

Warning
Warning: Limitations on Applying Tags to MLflow Experiment Runs in Fabric
- Non-Empty Tags: Tag names or values cannot be empty. If you attempt to apply a tag with an empty name or value, the operation will fail.
- Tag Names: Tag names can be up to 250 characters in length.
- Tag Values: Tag values can be up to 5000 characters in length.
- Restricted Tag Names: Tag names that start with certain prefixes are not supported. Specifically, tag names beginning with
synapseml,mlflow, ortridentare restricted and will not be accepted.
Visually compare runs
You can visually compare and filter runs within an existing experiment. Visual comparison allows you to easily navigate between multiple runs and sort across them.

To compare runs:
- Select an existing machine learning experiment that contains multiple runs.
- Select the View tab and then go to the Run list view. Alternatively, you could select the option to View run list directly from the Run details view.
- Customize the columns within the table by expanding the Customize columns pane. Here, you can select the properties, metrics, tags, and hyperparameters that you would like to see.
- Expand the Filter pane to narrow your results based on certain selected criteria.
- Select multiple runs to compare their results in the metrics comparison pane. From this pane, you can customize the charts by changing the chart title, visualization type, X-axis, Y-axis, and more.
Compare runs using the MLflow API
Data scientists can also use MLflow to query and search among runs within an experiment. You can explore more MLflow APIs for searching, filtering, and comparing runs by visiting the MLflow documentation.
Get all runs
You can use the MLflow search API mlflow.search_runs() to get all runs in an experiment by replacing <EXPERIMENT_NAME> with your experiment name or <EXPERIMENT_ID> with your experiment ID in the following code:
import mlflow

# Get runs by experiment name:
mlflow.search_runs(experiment_names=["<EXPERIMENT_NAME>"])

# Get runs by experiment ID:
mlflow.search_runs(experiment_ids=["<EXPERIMENT_ID>"])
Tip
You can search across multiple experiments by providing a list of experiment IDs to the experiment_ids parameter. Similarly, providing a list of experiment names to the experiment_names parameter will allow MLflow to search across multiple experiments. This can be useful if you want to compare across runs within different experiments.
Order and limit runs
Use the max_results parameter from search_runs to limit the number of runs returned. The order_by parameter allows you to list the columns to order by and can contain an optional DESC or ASC value. For instance, the following example returns the last run of an experiment.
mlflow.search_runs(experiment_ids=[ "1234-5678-90AB-CDEFG" ], max_results=1, order_by=["start_time DESC"])
Compare runs within a Fabric notebook
You can use the MLFlow authoring widget within Fabric notebooks to track MLflow runs generated within each notebook cell. The widget allows you to track your runs, associated metrics, parameters, and properties right down to the individual cell level.
To obtain a visual comparison, you can also switch to the Run comparison view. This view presents the data graphically, aiding in the quick identification of patterns or deviations across different runs.

Save run as a machine learning model
Once a run yields the desired result, you can save the run as a model for enhanced model tracking and for model deployment by selecting Save as a ML model.

Logged Models and Traces (MLflow 3)
With MLflow 3 support in Fabric, the experiment page includes two extra surfaces beyond the runs list:
- Logged Models section lists every LoggedModel produced by runs in the experiment. Each entry shows the model name, ID, source run, parameters, and metrics. Select a LoggedModel to open its detail page, compare it against other models, or register it as a Fabric ML model item.
- Traces tab shows GenAI traces captured from your runs, including inputs, outputs, latency, token usage, and the span hierarchy of each request.
For details about LoggedModel and Traces, see MLflow 3 in Fabric Data Science.
Monitor ML Experiments (preview)
ML experiments are integrated directly into Monitor. This functionality is designed to provide more insight into your Spark applications and the ML experiments they generate, making it easier to manage and debug these processes.
Track runs from monitor
Users can track experiment runs directly from monitor, providing a unified view of all their activities. This integration includes filtering options, enabling users to focus on experiments or runs created within the last 30 days or other specified periods.

Track related ML Experiment runs from your Spark application
ML Experiment are integrated directly into Monitor, where you can select a specific Spark application and access Item Snapshots. Here, you'll find a list of all the experiments and runs generated by that application.