Note
Access to this page requires authorization. You can try signing in or changing directories.
Access to this page requires authorization. You can try changing directories.
Applies to: ✅ SQL analytics endpoint and Warehouse in Microsoft Fabric
Important
This feature is in preview.
Use Data Warehouse Monitor to view running and historical T-SQL queries, long-running queries, and frequently run queries without running T-SQL code. Integrated into the Fabric portal, you can use Data Warehouse Monitor to confirm that queries complete successfully, analyze execution patterns, and investigate slower query runs in detail.
Data Warehouse Monitor was previously named "Query Activity".
Prerequisites
- You must be an admin in your workspace to access Data Warehouse Monitor. Members, Contributors, and Viewers don't have permission to access this view.
Get started
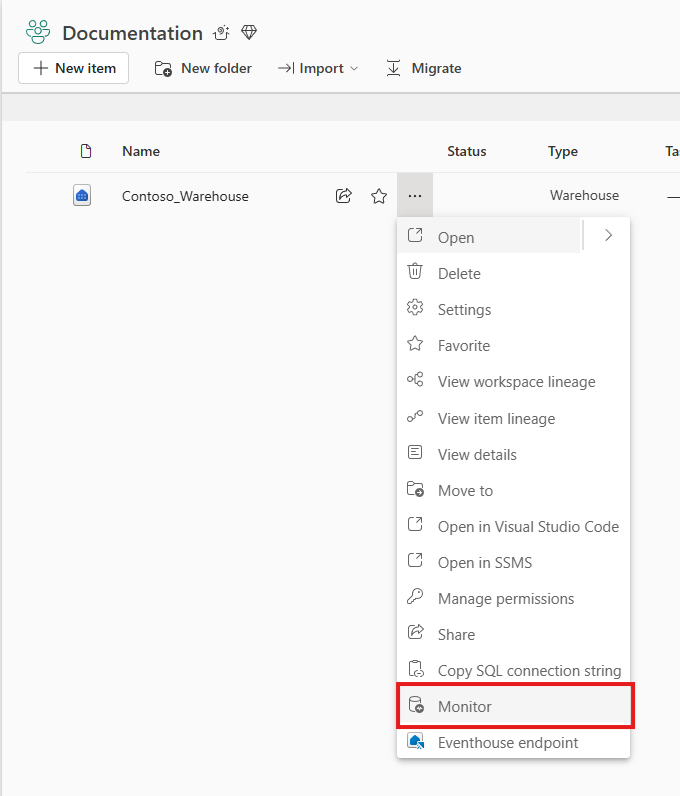
You can launch the Data Warehouse Monitor experience in two ways.
Select More Options (...) next to the warehouse you want to monitor within the workspace view, and select Monitor.
Within the query editor of the warehouse you want to monitor, select Monitor in the ribbon.


Query history
On the Query history page, you can review recent query executions and identify patterns in warehouse activity. This view combines a request count chart with a detailed results grid so you can move from a high-level trend to a specific query run.
- Use the request count chart to spot spikes in activity during the selected time range.
- Use the Filter menu to refine the view by Submit time (UTC), Status, Submitted by, Run source, Statement type, and Label.
- Use the search bar to find specific keywords in the query text or other columns.
- Use the time filter to switch quickly between the last 24 hours, last 7 days, last 30 days, or a custom time range.
- Review active filters as removable pills above the chart area. When you apply or remove filters, Monitor refreshes the chart and the query grid to match the current filter set.
- Select Refresh to reload the current results. If you see a query that you want to stop, select the query by using the checkbox and then select Cancel. You're prompted to confirm before the query is canceled. Any unselected queries that are part of the same SQL sessions that you selected are also canceled.
Note
Currently, filters applied in the monitoring experience might not be synchronized between the chart and data grid. To view consistent results, use the refresh option to reload the data.

- When you select one or more query runs that share the same query hash, View similar runs becomes available. Use this option to compare executions of the same query pattern and understand whether duration, failures, or resource usage changed across runs.

The chart updates to reflect the current filter selection, making it easier to answer questions such as:
- When did query volume increase?
- Which submitter or run source is associated with a spike in activity?
- Are failed or canceled queries concentrated in a specific time window?
You can also customize the table layout from the column menu:
- Choose which columns appear in the data grid.
- Drag items in the column menu to reorder them.
- Select Apply to update the grid to match the selected column order.
For each query, the following details are available in the Query history grid. Some columns might be hidden by default and can be added from Column options.
| Column name | Description |
|---|---|
| Distributed statement Id | Unique ID for each query |
| Query text | Text of the executed query |
| Query hash | Hash value for the query shape that helps you identify similar query logic across runs |
| Status | Query status: Succeeded, Failed, or Canceled |
| Submitted by | Name of the user or system that sent the query |
| Submit time (UTC) | Timestamp when the request arrived |
| Duration | Total time that the query took to finish |
| Run source | Name of the client program that initiated the session |
| CPU time | Total CPU time allocated for the query execution |
| Data scanned remotely | Amount of data read from remote storage in OneLake |
| Data scanned on disk | Amount of data read from local disk |
| Data scanned in cache | Amount of data read from local memory cache |
| Session Id | ID linking the query to a specific user session |
| Label | Optional label associated with the query, when a label was supplied |
| Statement type | Type of SQL statement that ran, such as SELECT, INSERT, UPDATE, or DELETE |
| Row count | Number of rows returned by the query |
| Batch ID | ID for a grouped set of queries, if applicable |
| Connection ID | Identifier for the connection used by the query |
| Database name | Name of the warehouse or SQL analytics endpoint connected at execution time |
| End time | Timestamp when the query completed execution |
| Is distributed | Indicates whether the query ran as a distributed operation: 1 for yes, 0 for no |
| Result cache hit | Result set cache state for the query: 2 means cache hit, 1 means cache created, and 0 means result set caching didn't apply |
| Root batch ID | ID for the top-level batch when queries are part of a nested batch |
| SQL pool name | Name of the SQL pool used to execute the request |
| Error code | Error code returned for the query execution when a failure is reported |
The same information regarding running queries can also be found using dynamic management views and Query insights views, for example, queryinsights.exec_requests_history.
Query insights
The other Monitor tabs help you move from history into summarized analysis:
- Long running queries helps you identify queries with consistently higher execution times.
- Frequently run queries helps you find repeated query patterns that might benefit from tuning.
For each query in the Long running queries insight, the following details are provided:
| Column name | Description |
|---|---|
| Query text | Text of the executed query |
| Median run duration | Median query execution time (ms) across runs |
| Run count | Total number of times the query was executed |
| Last run duration | Time taken by the last execution (ms) |
| Last run distributed statement ID | Unique ID for the last query execution |
| Last run session ID | Session ID for the last execution |
For each query in the Frequently run queries insight, the following details are provided:
| Column name | Description |
|---|---|
| Query text | Text of the executed query |
| Average run duration | Average query execution time (ms) across runs |
| Max duration | Longest query execution time (ms) |
| Min duration | Shortest query execution time (ms) |
| Last run distributed statement ID | Unique ID for the last query execution |
| Run count | Total number of times the query was executed |
| Count of successful runs | Number of successful query executions |
| Count of failed runs | Number of failed query executions |
| Count of canceled runs | Number of canceled query executions |
To get the most value from these views:
- Start in Query history to identify the time range, submitter, or run source that you want to investigate.
- Use View similar runs to compare executions that share the same query hash.
- Move to Long running queries to identify query patterns with high median duration.
- Review Frequently run queries to find high-volume query shapes that are good candidates for tuning.
The same information regarding completed, failed, and canceled queries from Query history along with aggregated insights can also be found in Query insights in Fabric data warehousing.
Limitations
- Depending on the concurrent workload, historical queries can take up to 15 minutes to appear in Monitor.
- Monitor shows only the top 10,000 rows for the current filter selections. To reduce the result set, narrow the time range or add filters.
- If you open Monitor immediately after creating a new warehouse, you might see an
Invalid object name queryinsights.exec_requests_historyerror. This error occurs because the underlying system views aren't yet generated. As a workaround, wait two minutes, and then refresh the page.