Note
Access to this page requires authorization. You can try signing in or changing directories.
Access to this page requires authorization. You can try changing directories.
Note
This feature is currently in public preview. This preview is provided without a service-level agreement, and isn't recommended for production workloads. Certain features might not be supported or might have constrained capabilities. For more information, see Supplemental Terms of Use for Microsoft Azure Previews.
This article shows you how to monitor your graph workloads in Microsoft Fabric by using the Monitoring hub. Use monitoring data to track activities, view historical activity, and gain insights into the performance and usage of your graph workloads. The data helps administrators and users troubleshoot problems and optimize resource usage.
Graph in Microsoft Fabric follows the existing Fabric-wide telemetry framework. Graph items are workspace-scoped (each graph belongs to a specific workspace), but the Monitoring hub aggregates visibility based on your role and permissions. You don't need to navigate workspace-by-workspace to monitor your graph workloads. You can see them all in the centralized Monitoring hub, filtered by what you're authorized to see.
Access monitoring data
To access monitoring data, follow these steps:
In Microsoft Fabric, select Monitor in the navigation pane to open the Monitoring hub.
In the Monitoring hub, locate your graph activities. You can filter by Item type, Status, or Location to narrow the results.
Review the Status column to check the current state of your graph refresh jobs.
The following screenshot shows a graph refresh job that is in progress:
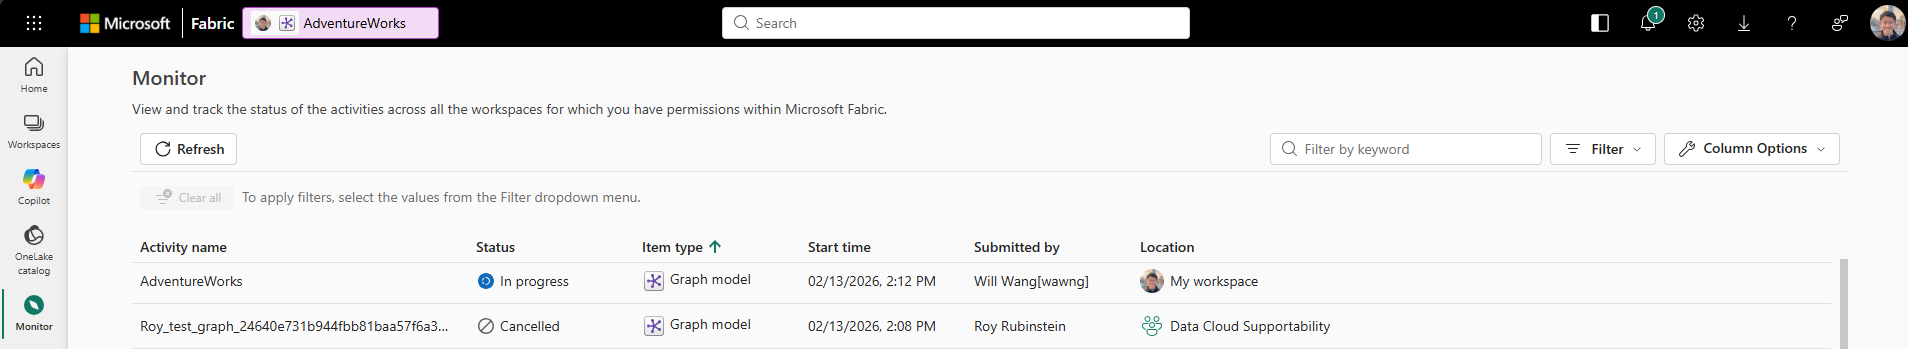
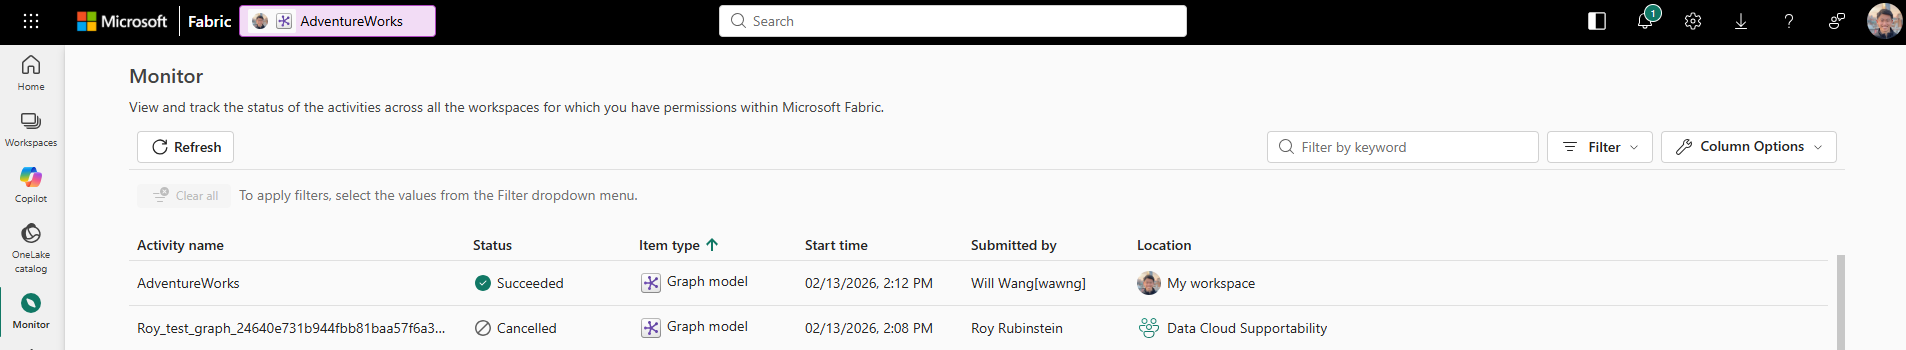
When the refresh finishes, the status updates to Succeeded or Failed.
The following screenshot shows a completed refresh with a Succeeded status:


Interpret monitoring results
The Monitoring hub displays the following status values for graph refresh jobs:
| Status | Description |
|---|---|
| In Progress | The graph is actively loading data from OneLake and constructing the queryable graph. |
| Succeeded | The refresh completed successfully. The graph is ready for querying. |
| Failed | The refresh encountered an error. Check your node and edge type configurations. |
Important
A Succeeded status means the refresh job completed without errors, but the graph might not have queryable data if you didn't configure the node types and edge types properly. Verify your graph model configuration if queries return no results after a successful refresh.
Troubleshoot common issues
If your graph refresh fails or produces unexpected results, try the following steps:
- Verify source data: Confirm that the source tables in your lakehouse contain data and are accessible.
- Check node and edge configurations: Ensure that the mapping tables, ID columns, and foreign key columns are configured correctly in your graph model.
- Review permissions: Confirm that you have the appropriate workspace permissions to access the underlying lakehouse data.
- Reload the graph: Select Save in the graph model editor to reload the graph and apply any changes to the model or underlying data.