Note
Access to this page requires authorization. You can try signing in or changing directories.
Access to this page requires authorization. You can try changing directories.
Plan, forecast, and visualize scenarios on live data sources without duplicating datasets, rebuilding models, or relying on technical teams. By unifying planning, budgeting, and forecasting data with visualizations, you can:
- Easily compare budgets, actuals, and forecasts
- Quickly identify and adjust variances that require action
- Evaluate multiple what-if scenarios
- Make real-time, strategic adjustments to budgets and forecasts based on visual insights
Important
This feature is in preview.
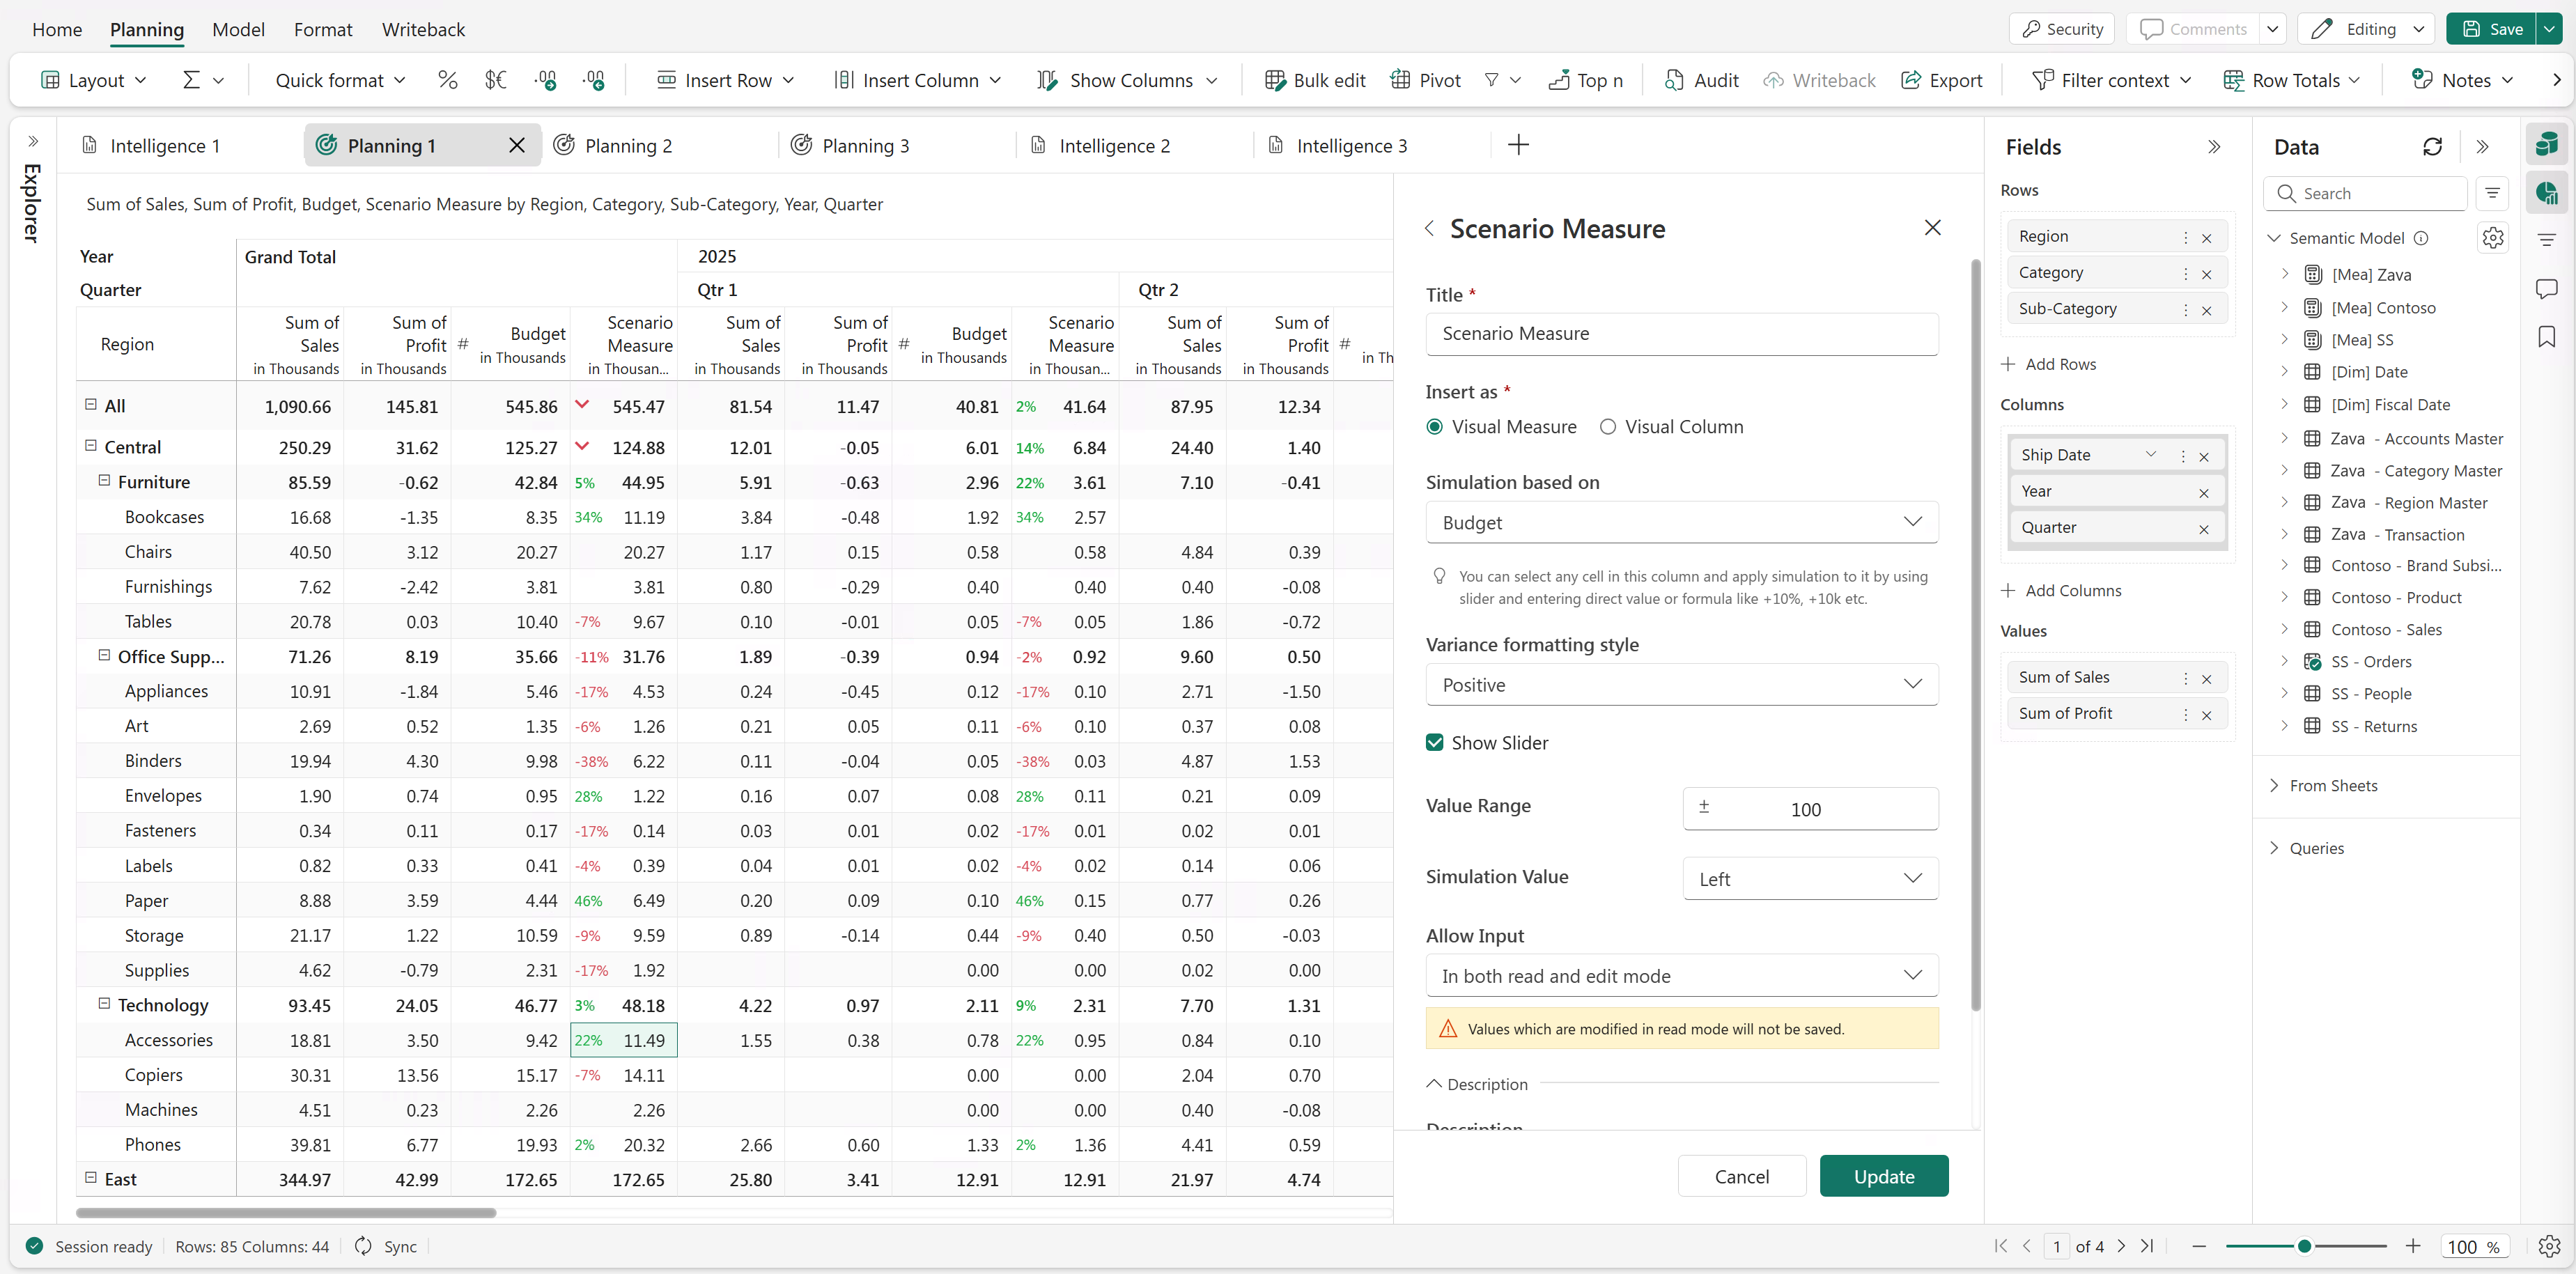
Create planning sheet
Create a planning sheet that can contain manual data inputs, simulations, scenarios, and forecasts.
In a new intelligence sheet, select the Planning visual and choose the planning sheet to import data from.
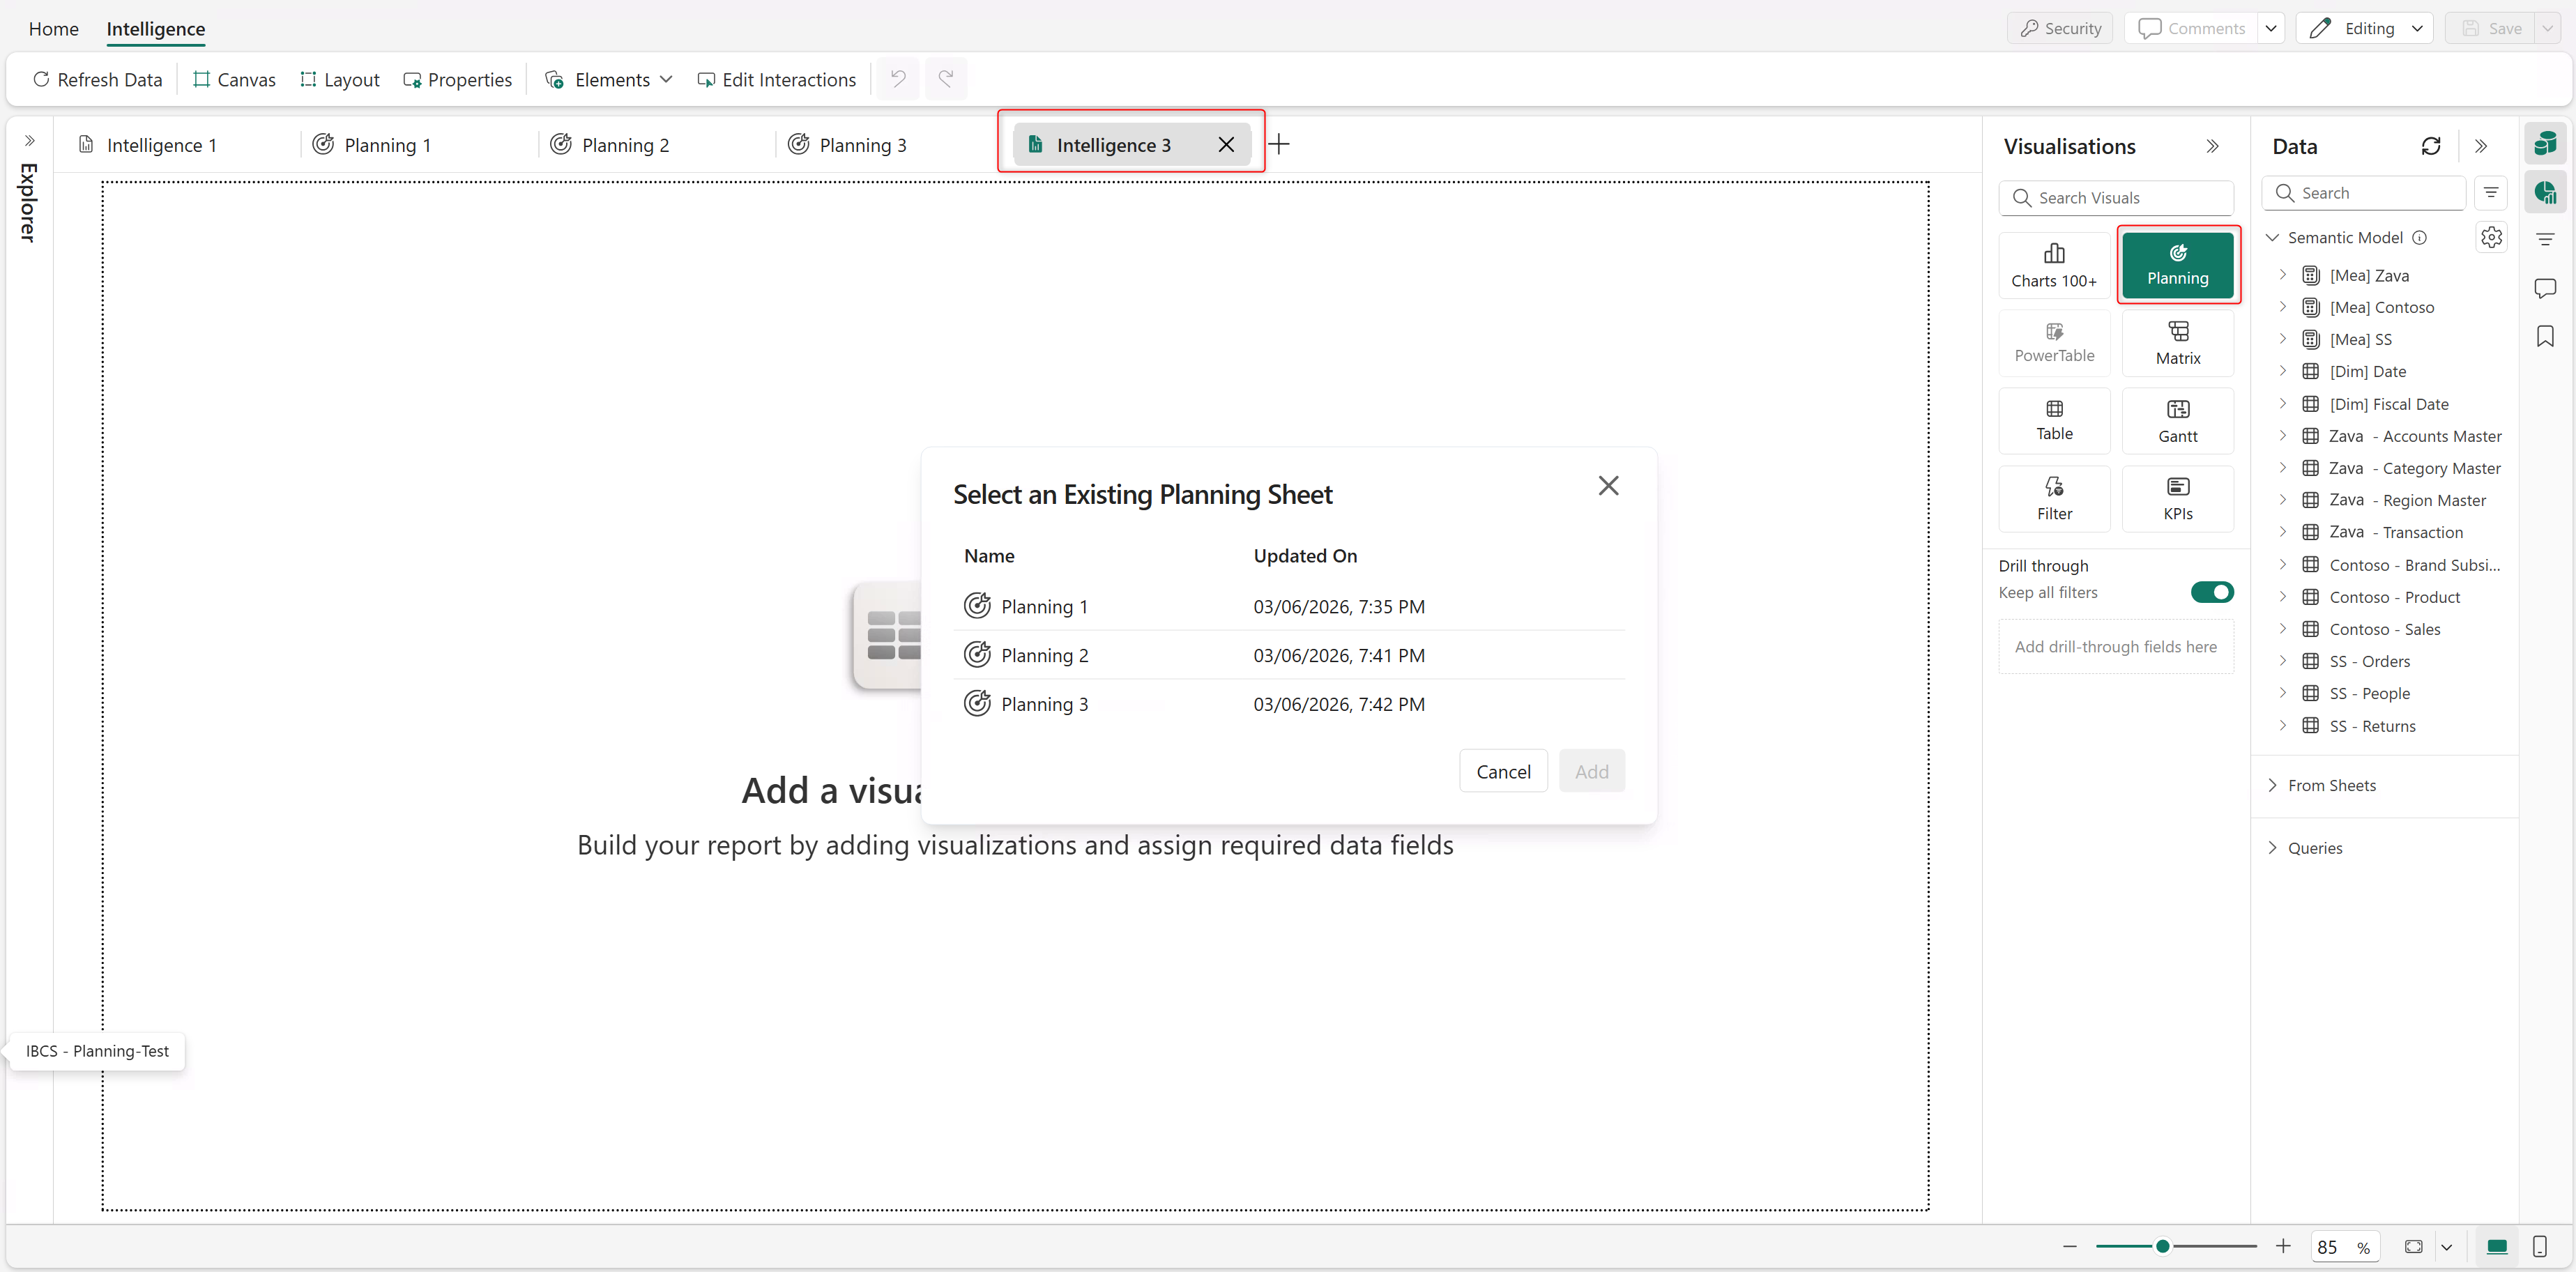
The selected sheet is imported into the intelligence sheet.
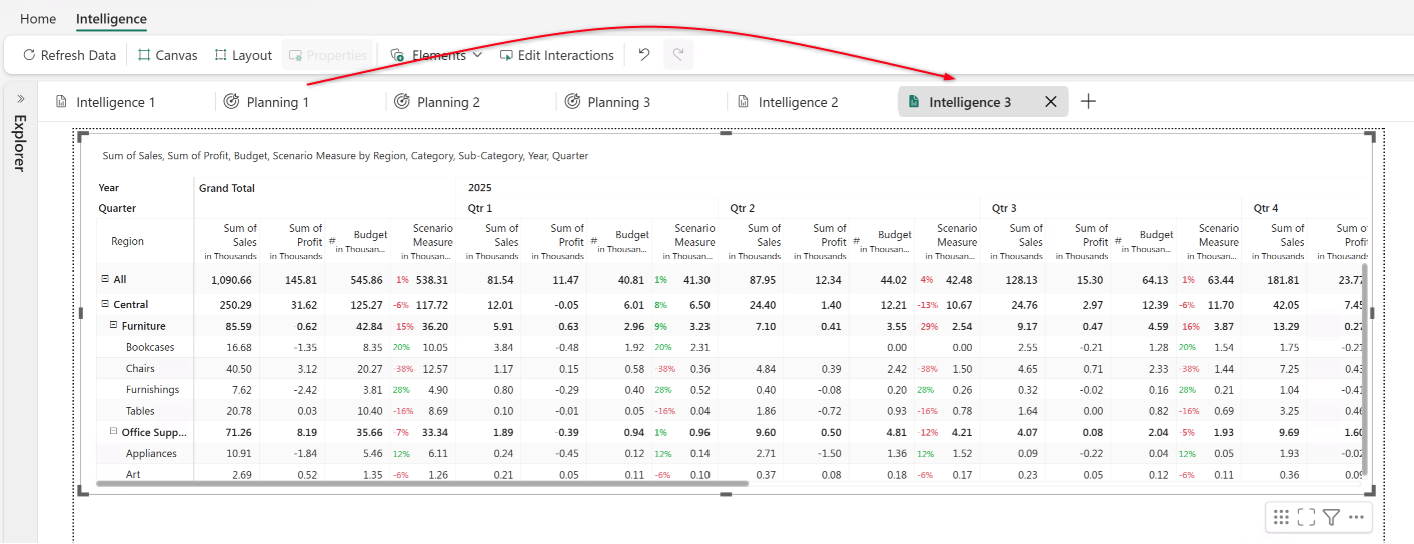


Add visuals
Add a chart (or a visual that consumes the planning data).
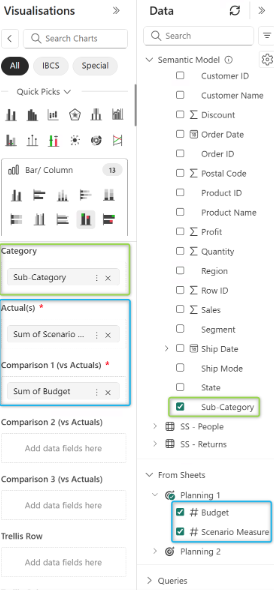
Measures from the planning sheet (data input, formulas, simulations, forecasts) appear as fields under the From Sheets section of the Data pane. You can assign dimensions and measures from your semantic models and other planning sheets.
As you run simulations in the planning sheet, the charts in the intelligence sheet are updated to reflect the changes in real time.