Note
Access to this page requires authorization. You can try signing in or changing directories.
Access to this page requires authorization. You can try changing directories.
Identifiers in planning are predefined references that you use to access specific rows, columns, hierarchy levels, periods, and other contextual information in formulas. They simplify calculations by dynamically referring to report elements instead of hardcoding values. Use the following identifiers to build formulas that respond to the current report context.
CLOSEDPERIOD
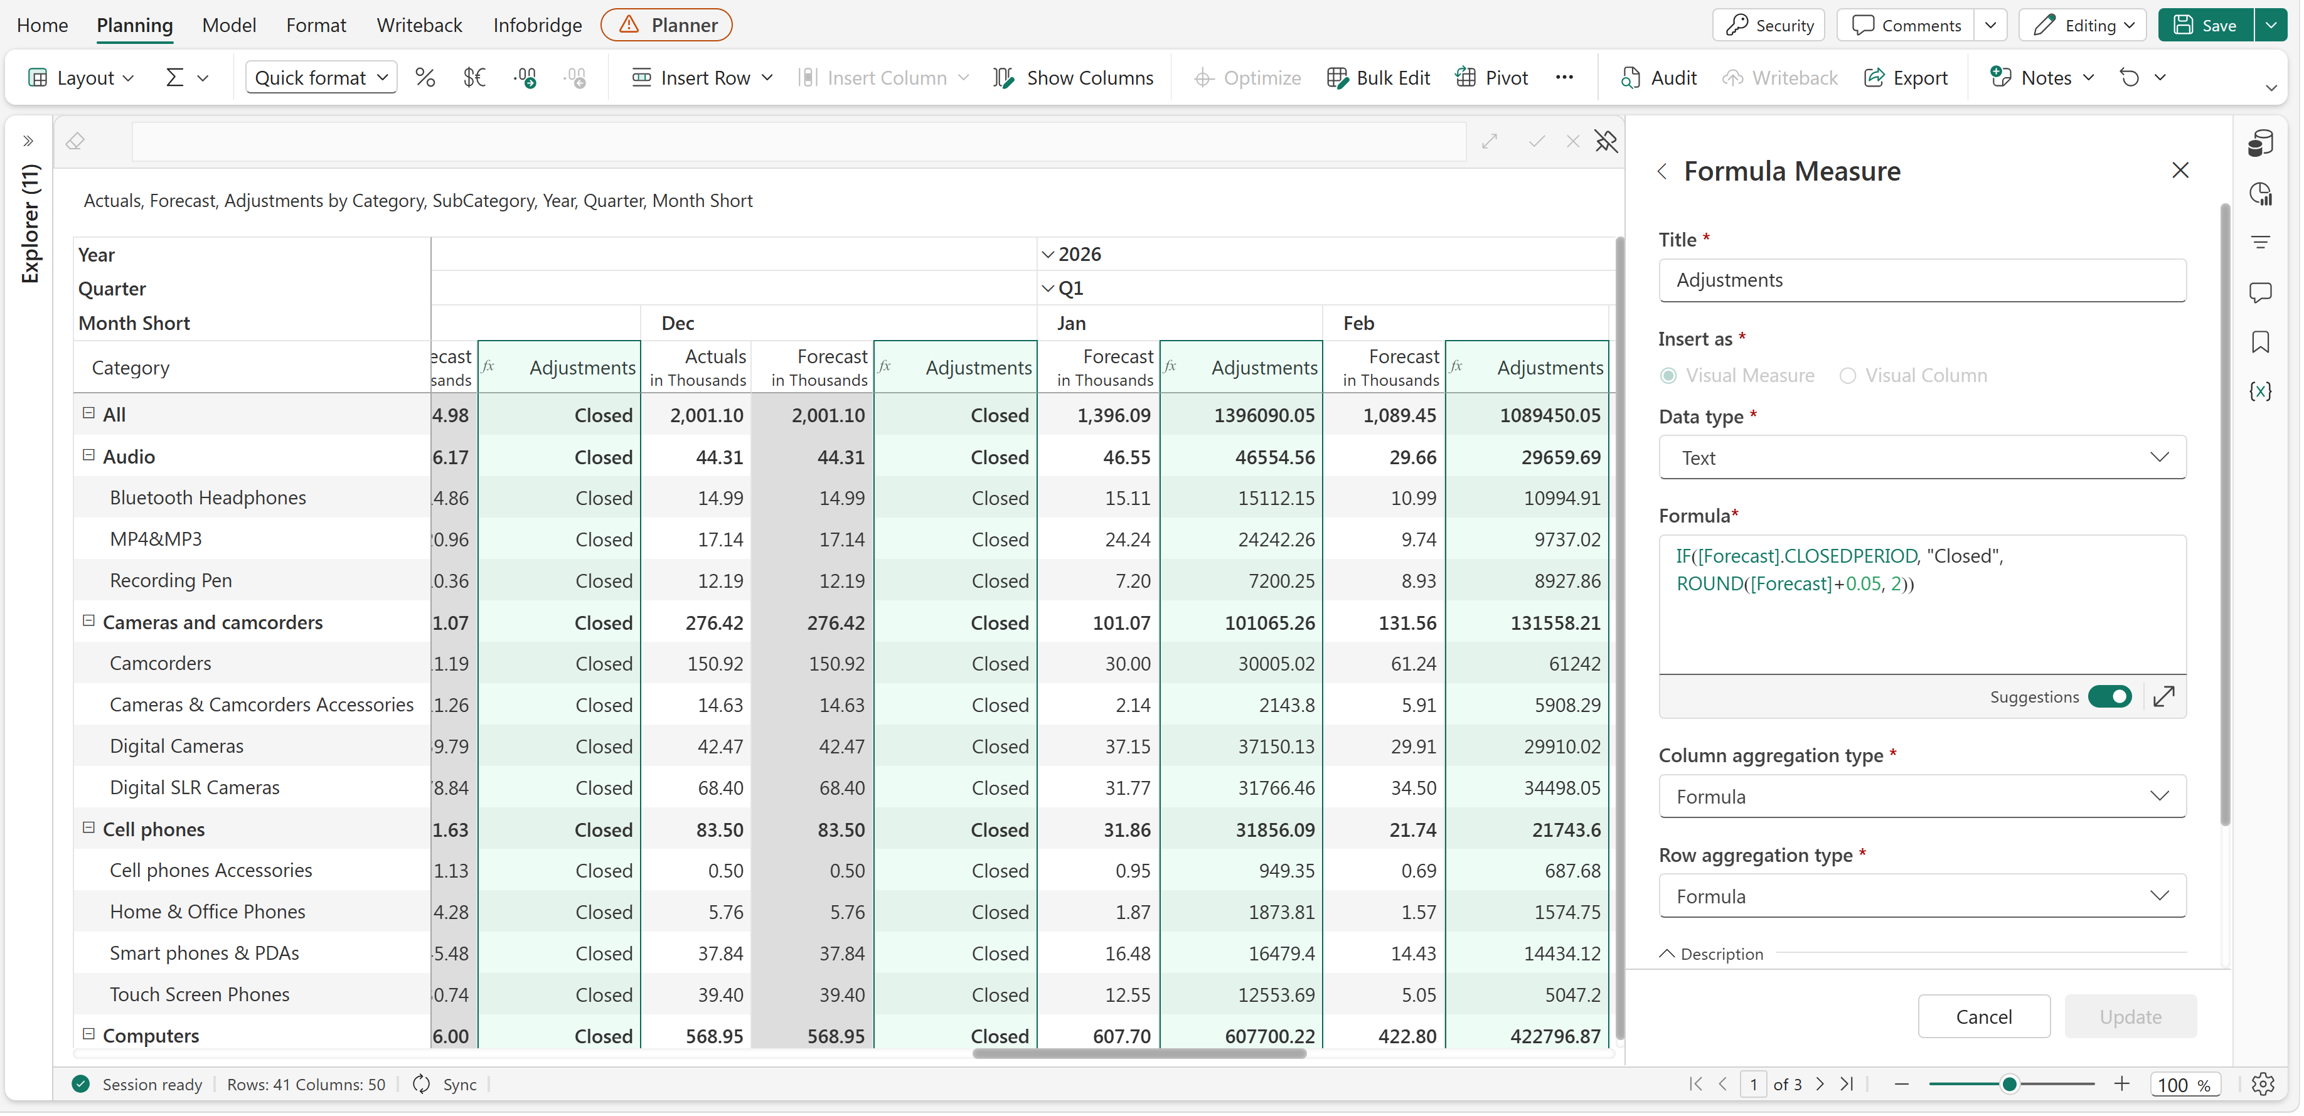
The CLOSEDPERIOD identifier returns TRUE if the referenced forecast period is closed and FALSE if the period is open. It's commonly used with conditional functions such as IF to perform different actions for closed and open forecast periods. To refer to the open periods, use the NOT operator along with the CLOSEDPERIOD function.
Syntax
[Forecast].CLOSEDPERIOD
Example
The following example checks whether a forecast period is closed. If the period is closed, the formula returns Closed. Otherwise, it returns the forecast value rounded to two decimal places with a small adjustment.
IF([Forecast].CLOSEDPERIOD, "Closed", ROUND([Forecast] + 0.05, 2))
COLUMN.CURRENT_PERIOD
The COLUMN.CURRENT_PERIOD identifier returns the current period represented by the active column in the report. Use this identifier with date-based functions, such as SHIFT, MOVINGSUM, and MOVINGAVERAGE, to create dynamic time-based calculations that automatically adjust based on the current column in the hierarchy.
Syntax
COLUMN.CURRENT_PERIOD
Examples
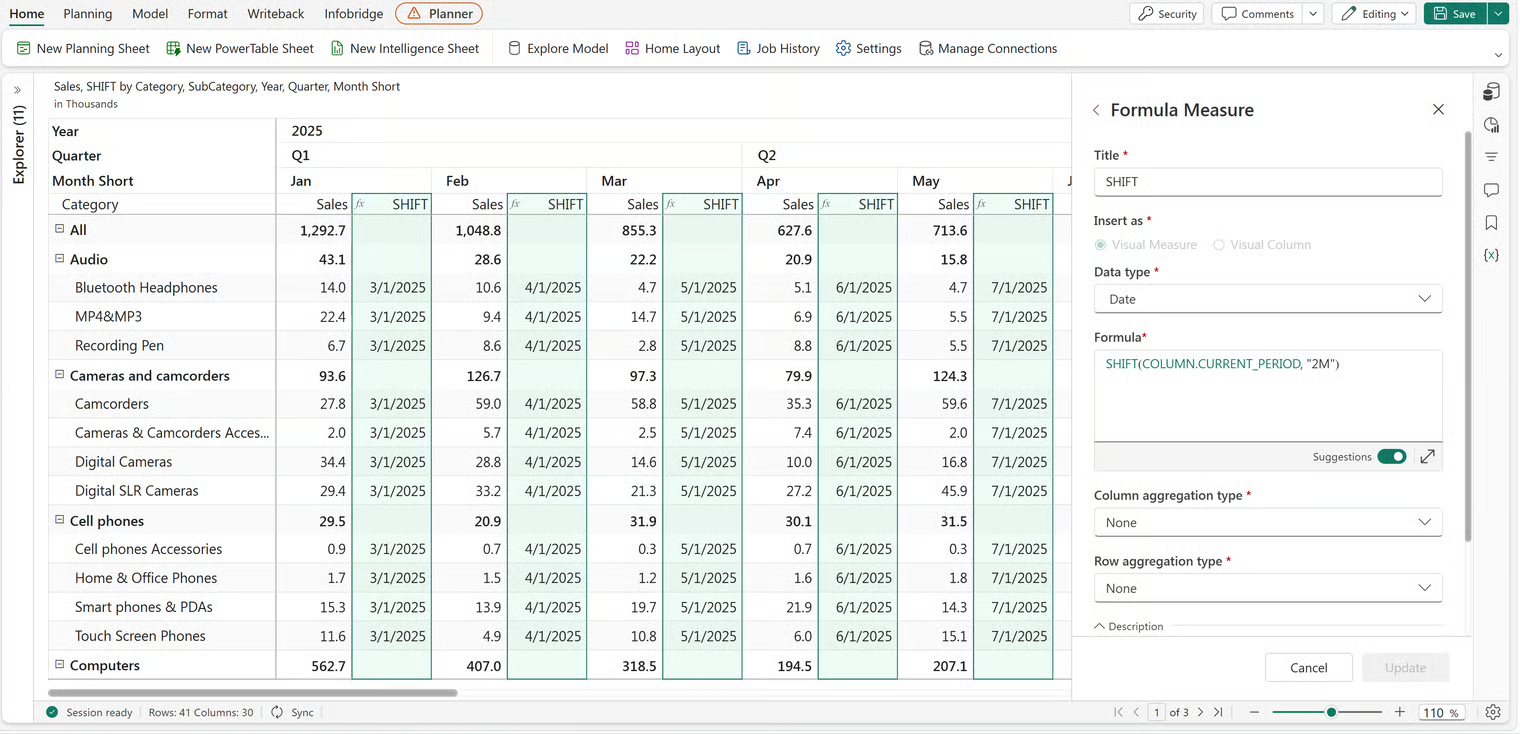
The following example uses COLUMN.CURRENT_PERIOD with the SHIFT function to return the date two months after the current period.
SHIFT(COLUMN.CURRENT_PERIOD, "2M")
The formula shifts each month's date forward by two months. For example, January 2025 returns 3/1/2025 and February 2025 returns 4/1/2025.
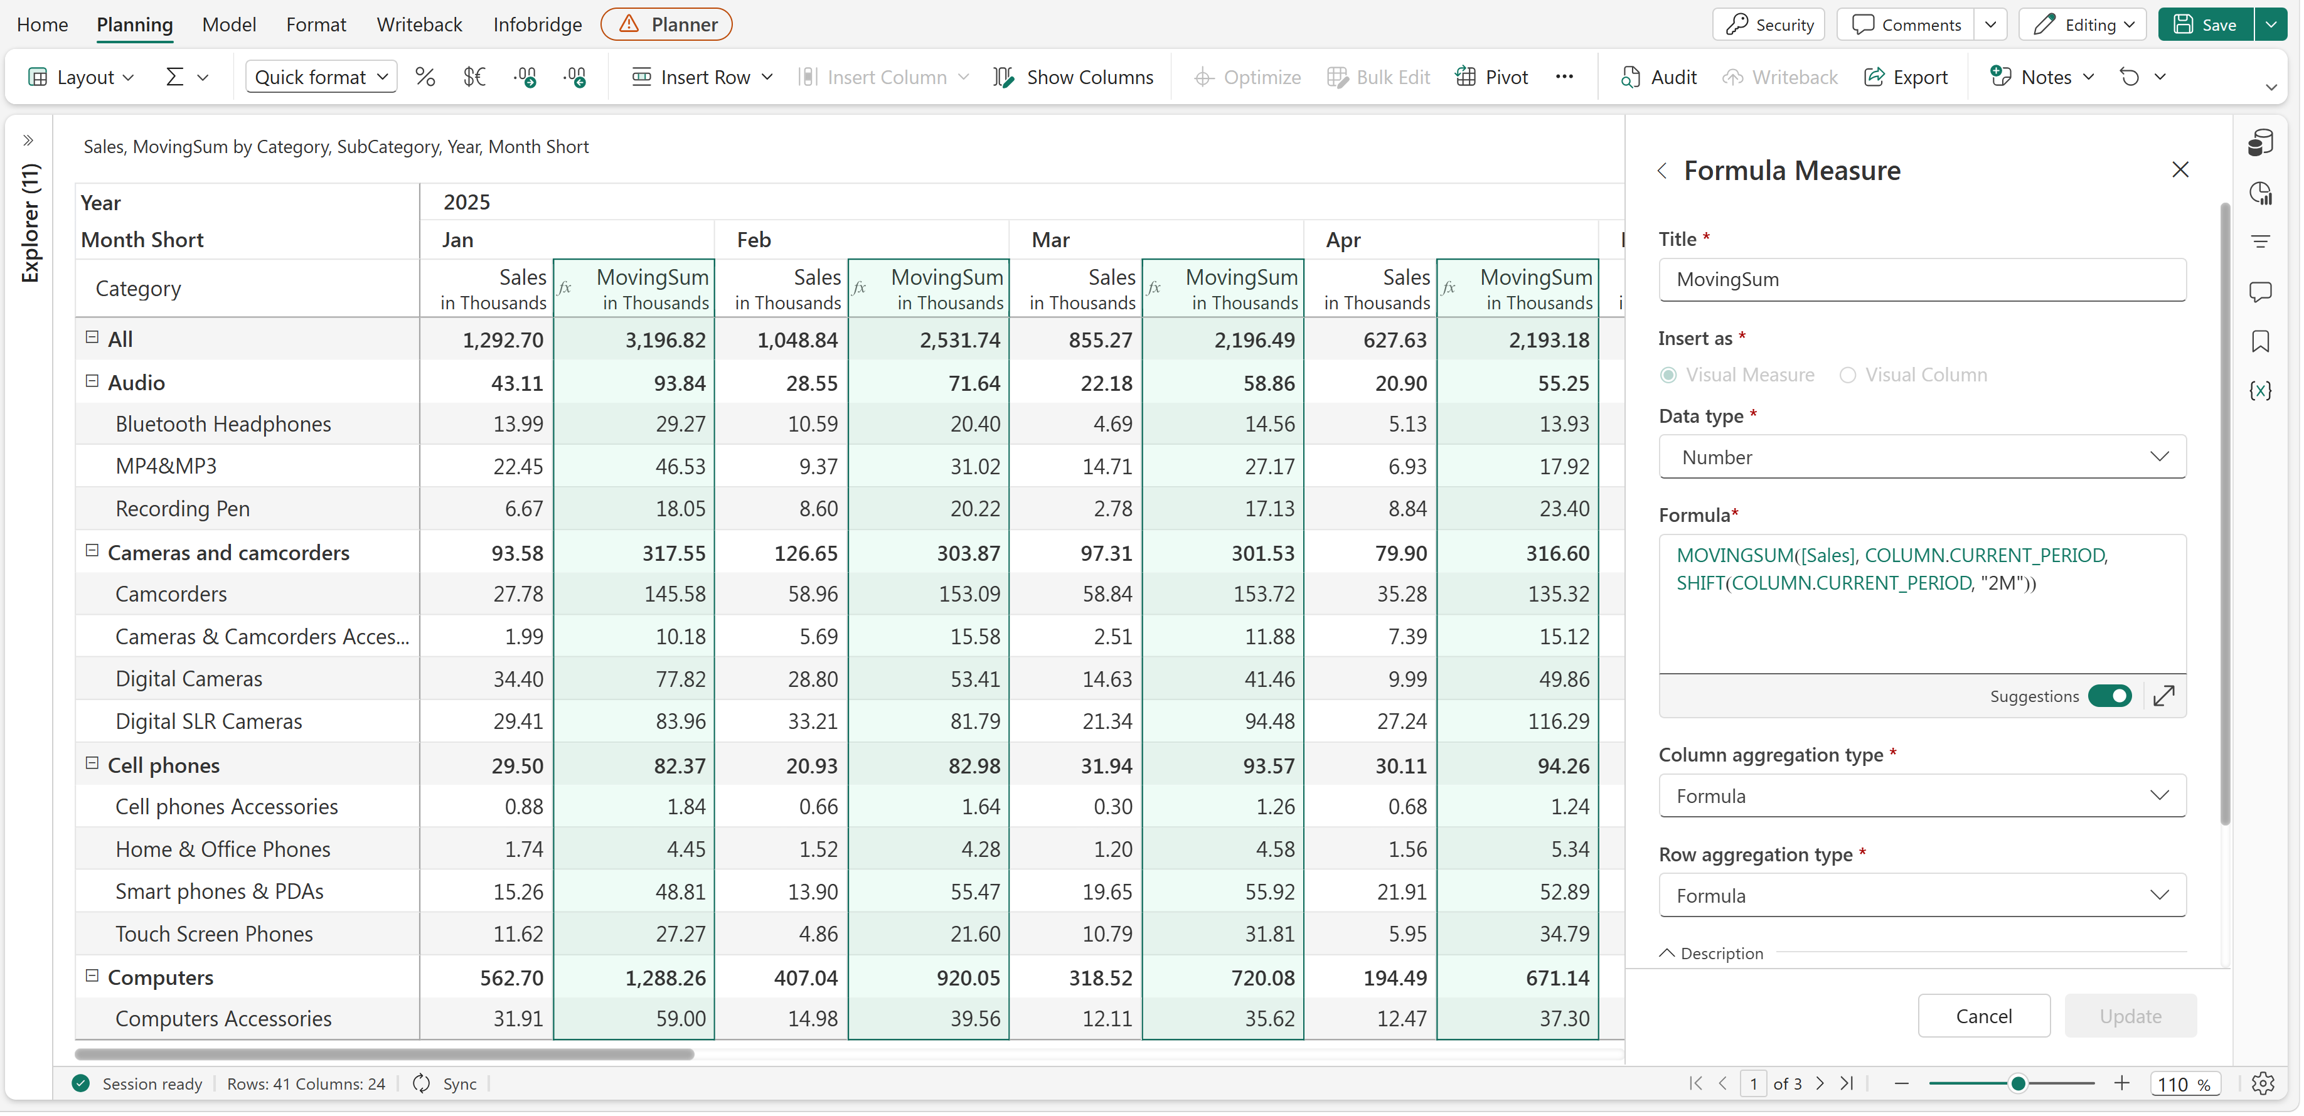
The following example uses COLUMN.CURRENT_PERIOD with the MOVINGSUM and SHIFT functions to calculate the total sales from the current period through the next two months.
MOVINGSUM([Sales], COLUMN.CURRENT_PERIOD, SHIFT(COLUMN.CURRENT_PERIOD, "2M"))
The COLUMN.CURRENT_PERIOD specifies the start of the calculation range, and SHIFT(COLUMN.CURRENT_PERIOD, "2M") specifies the end of the range. When the current period is January 2025, the moving sum includes the sales for January, February, and March. As the calculation moves across the report, the date range updates automatically for each column.
COLUMN.DATE
The COLUMN.DATE identifier returns the date derived from the date hierarchy of the current column. Use this identifier to retrieve the date represented by a column header, such as Year, Quarter, or Month, and use it in calculations or display it in a measure.
Syntax
COLUMN.DATE
Example
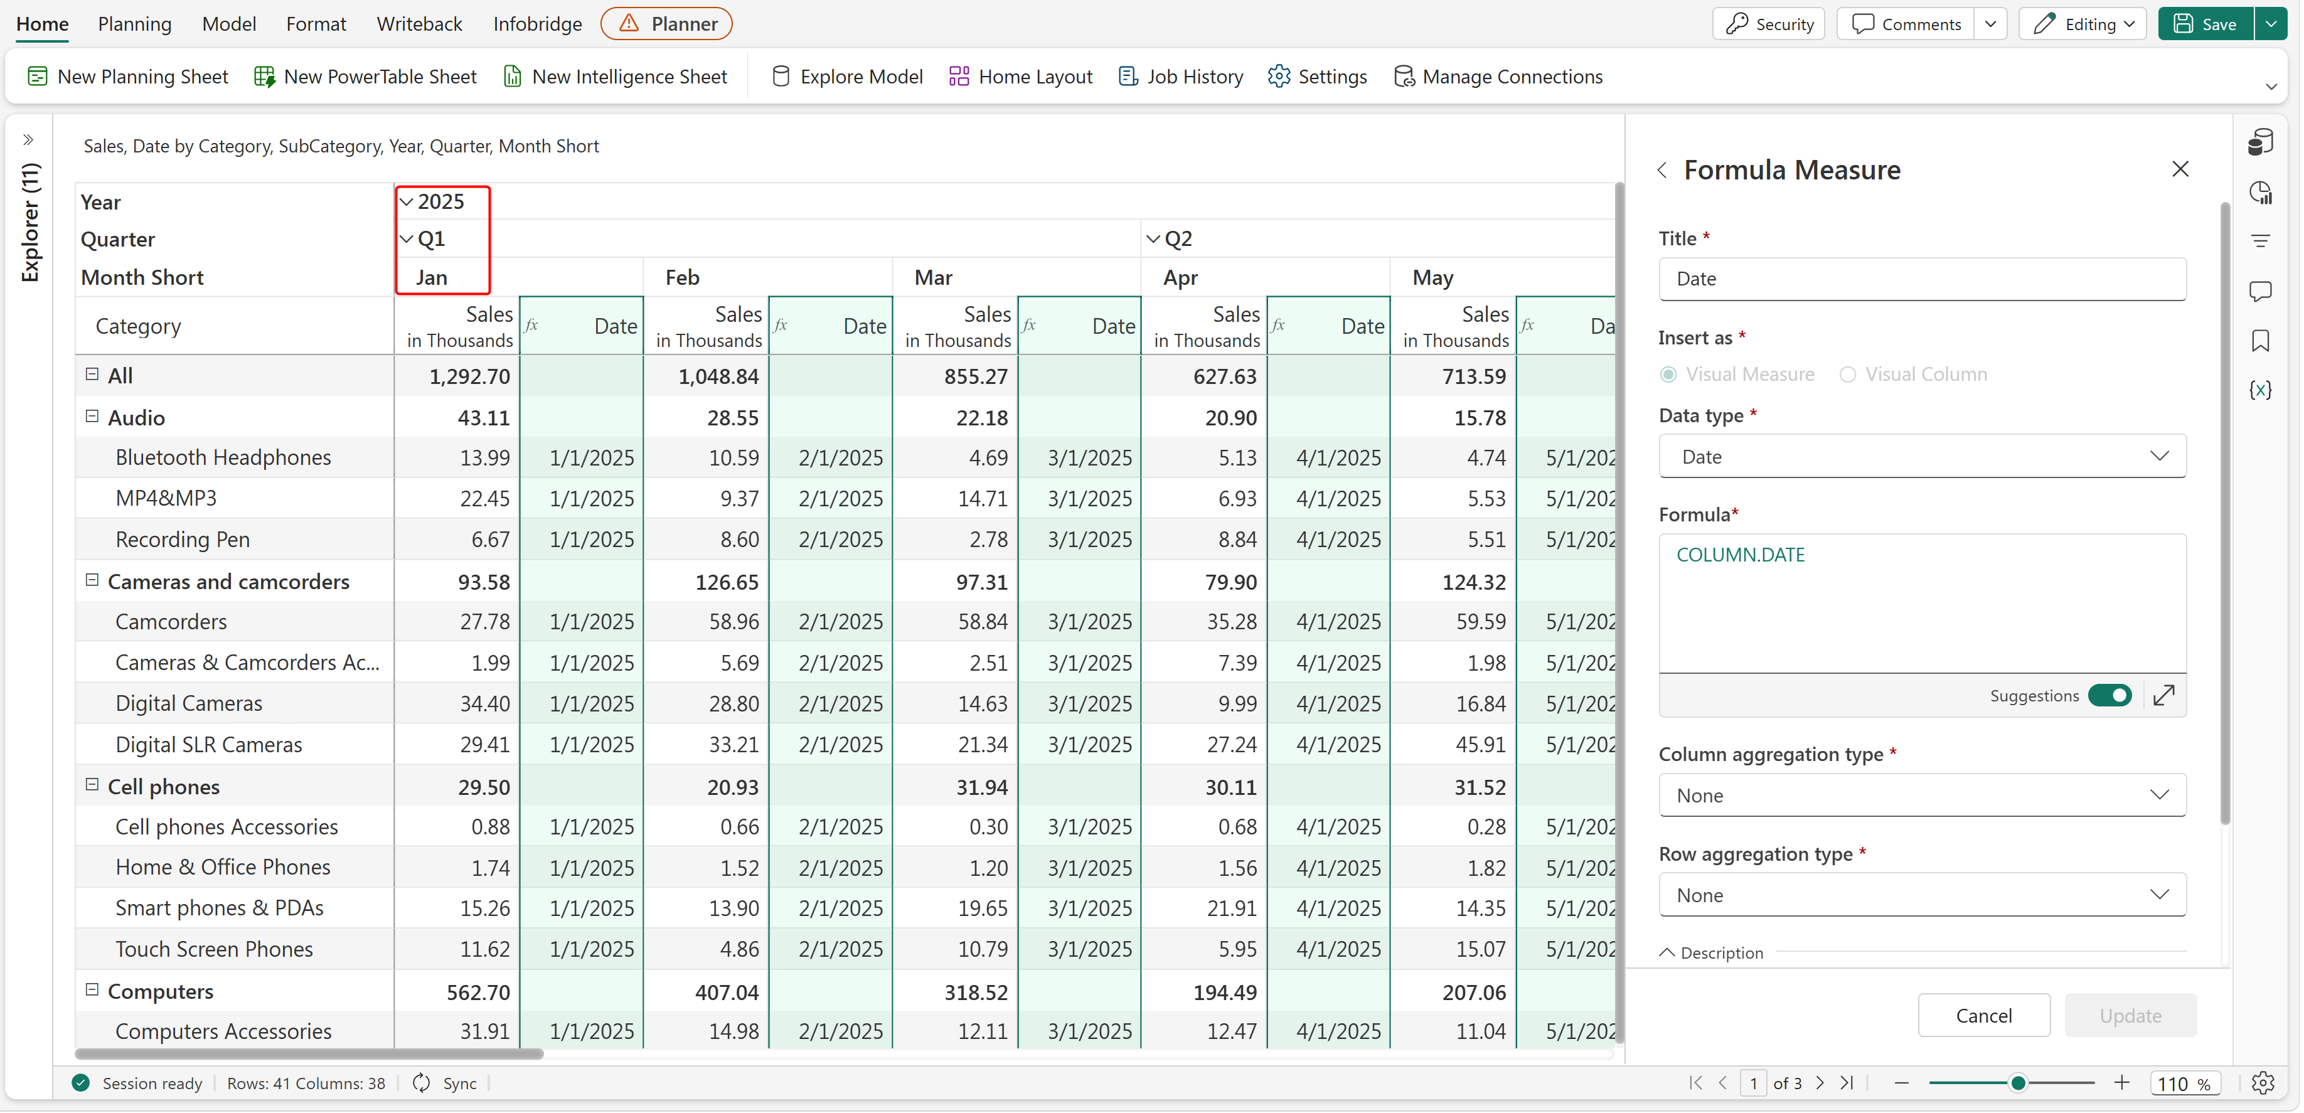
The following example creates a measure that returns the date represented by the current column's date hierarchy.
COLUMN.DATE
When the column hierarchy contains date members such as Year, Quarter, and Month, the identifier returns the corresponding date for the current column.
Note
COLUMN.DATE can only be used with column hierarchies that are based on date dimensions. If the current column doesn't represent a date hierarchy, the identifier doesn't return a valid date.
COLUMN.GROUP_INDEX
The GROUP_INDEX identifier returns the position of the current column within a column group. You can use this identifier in both calculated measures and calculated rows to retrieve the index of the current column.
Syntax
COLUMN.GROUP_INDEX
Examples
COLUMN.GROUP_INDEX
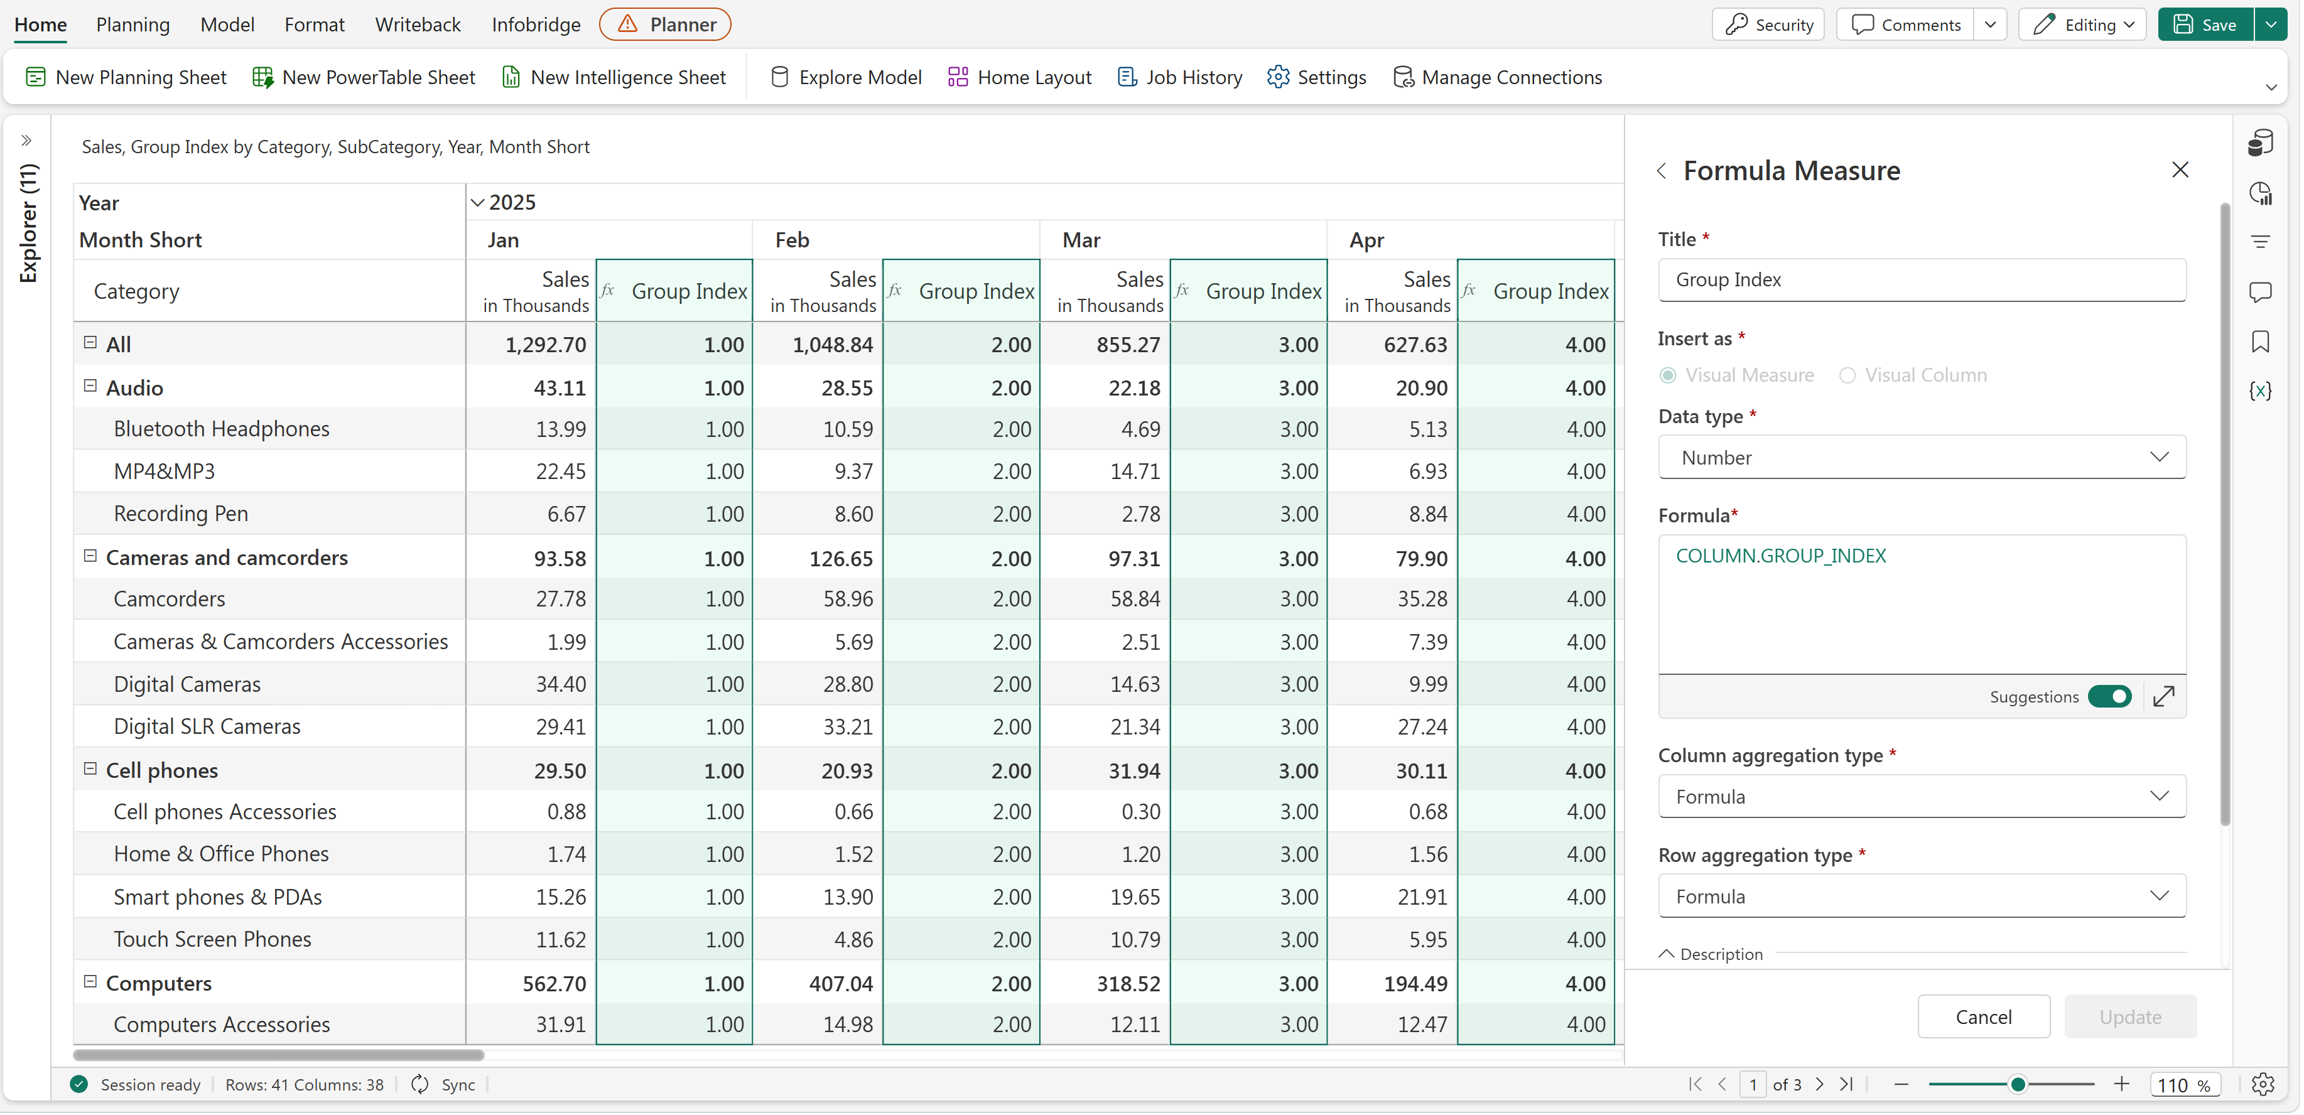
Insert a Formula Measure and use the COLUMN.GROUP_INDEX identifier in the formula. The measure returns the position of each column within the column group.
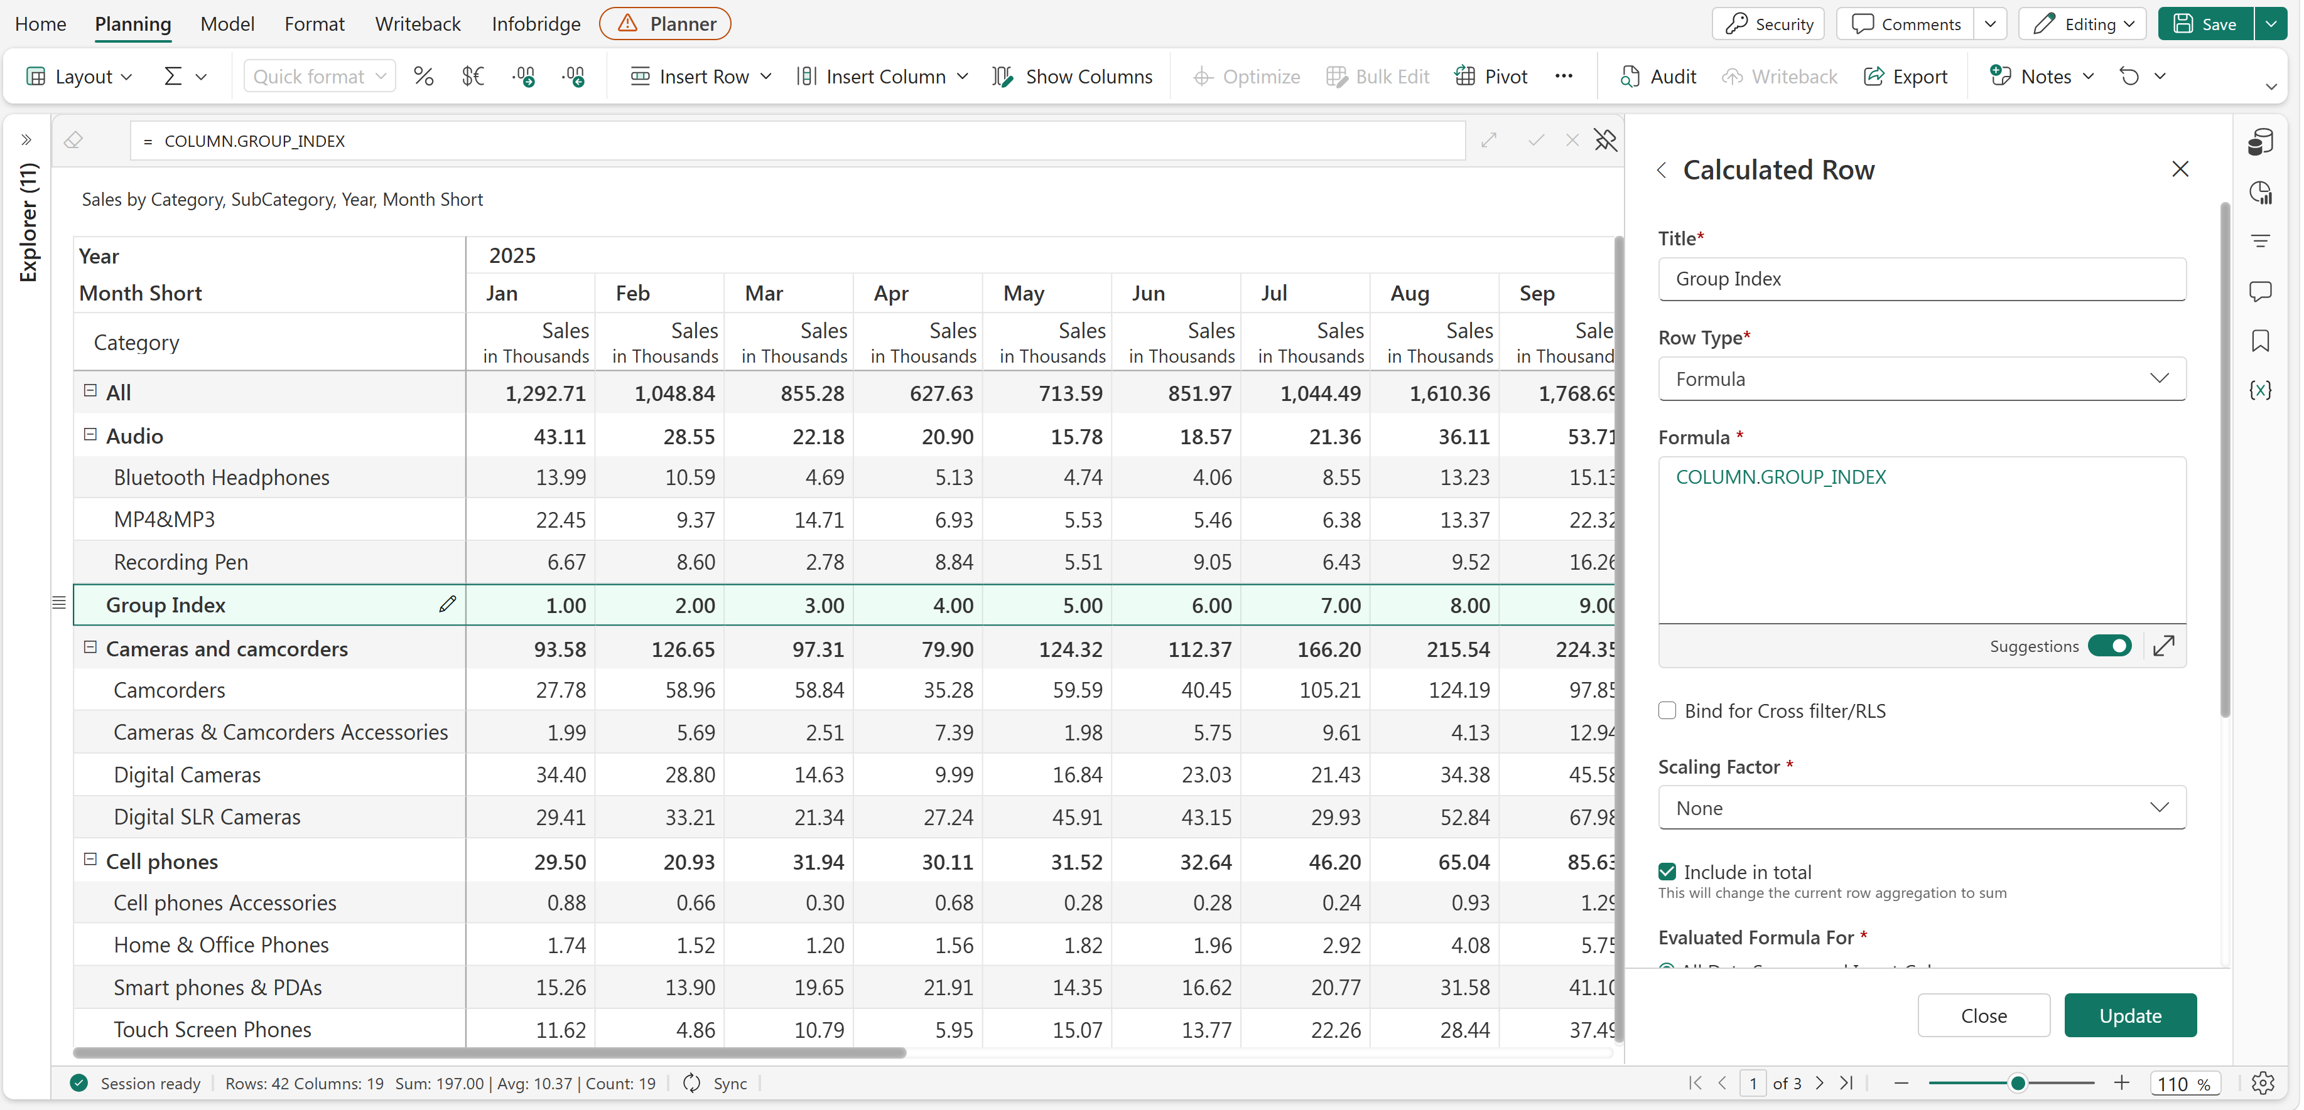
Insert a Formula Row from Insert Row and use the COLUMN.GROUP_INDEX identifier in the formula. The calculated row returns the position of each column within the column group.
COLUMN.LEVEL
The COLUMN.LEVEL identifier returns the level of the current column in a column hierarchy. Use it to identify the hierarchy level of each column and to perform calculations based on the column position.
Syntax
COLUMN.LEVEL
Example
COLUMN.LEVEL
In this example, the column hierarchy contains Year, Quarter, and Month levels. The identifier returns a numeric value that represents the current column level. For example:
- Year returns
1. - Quarter returns
2. - Month returns
3.
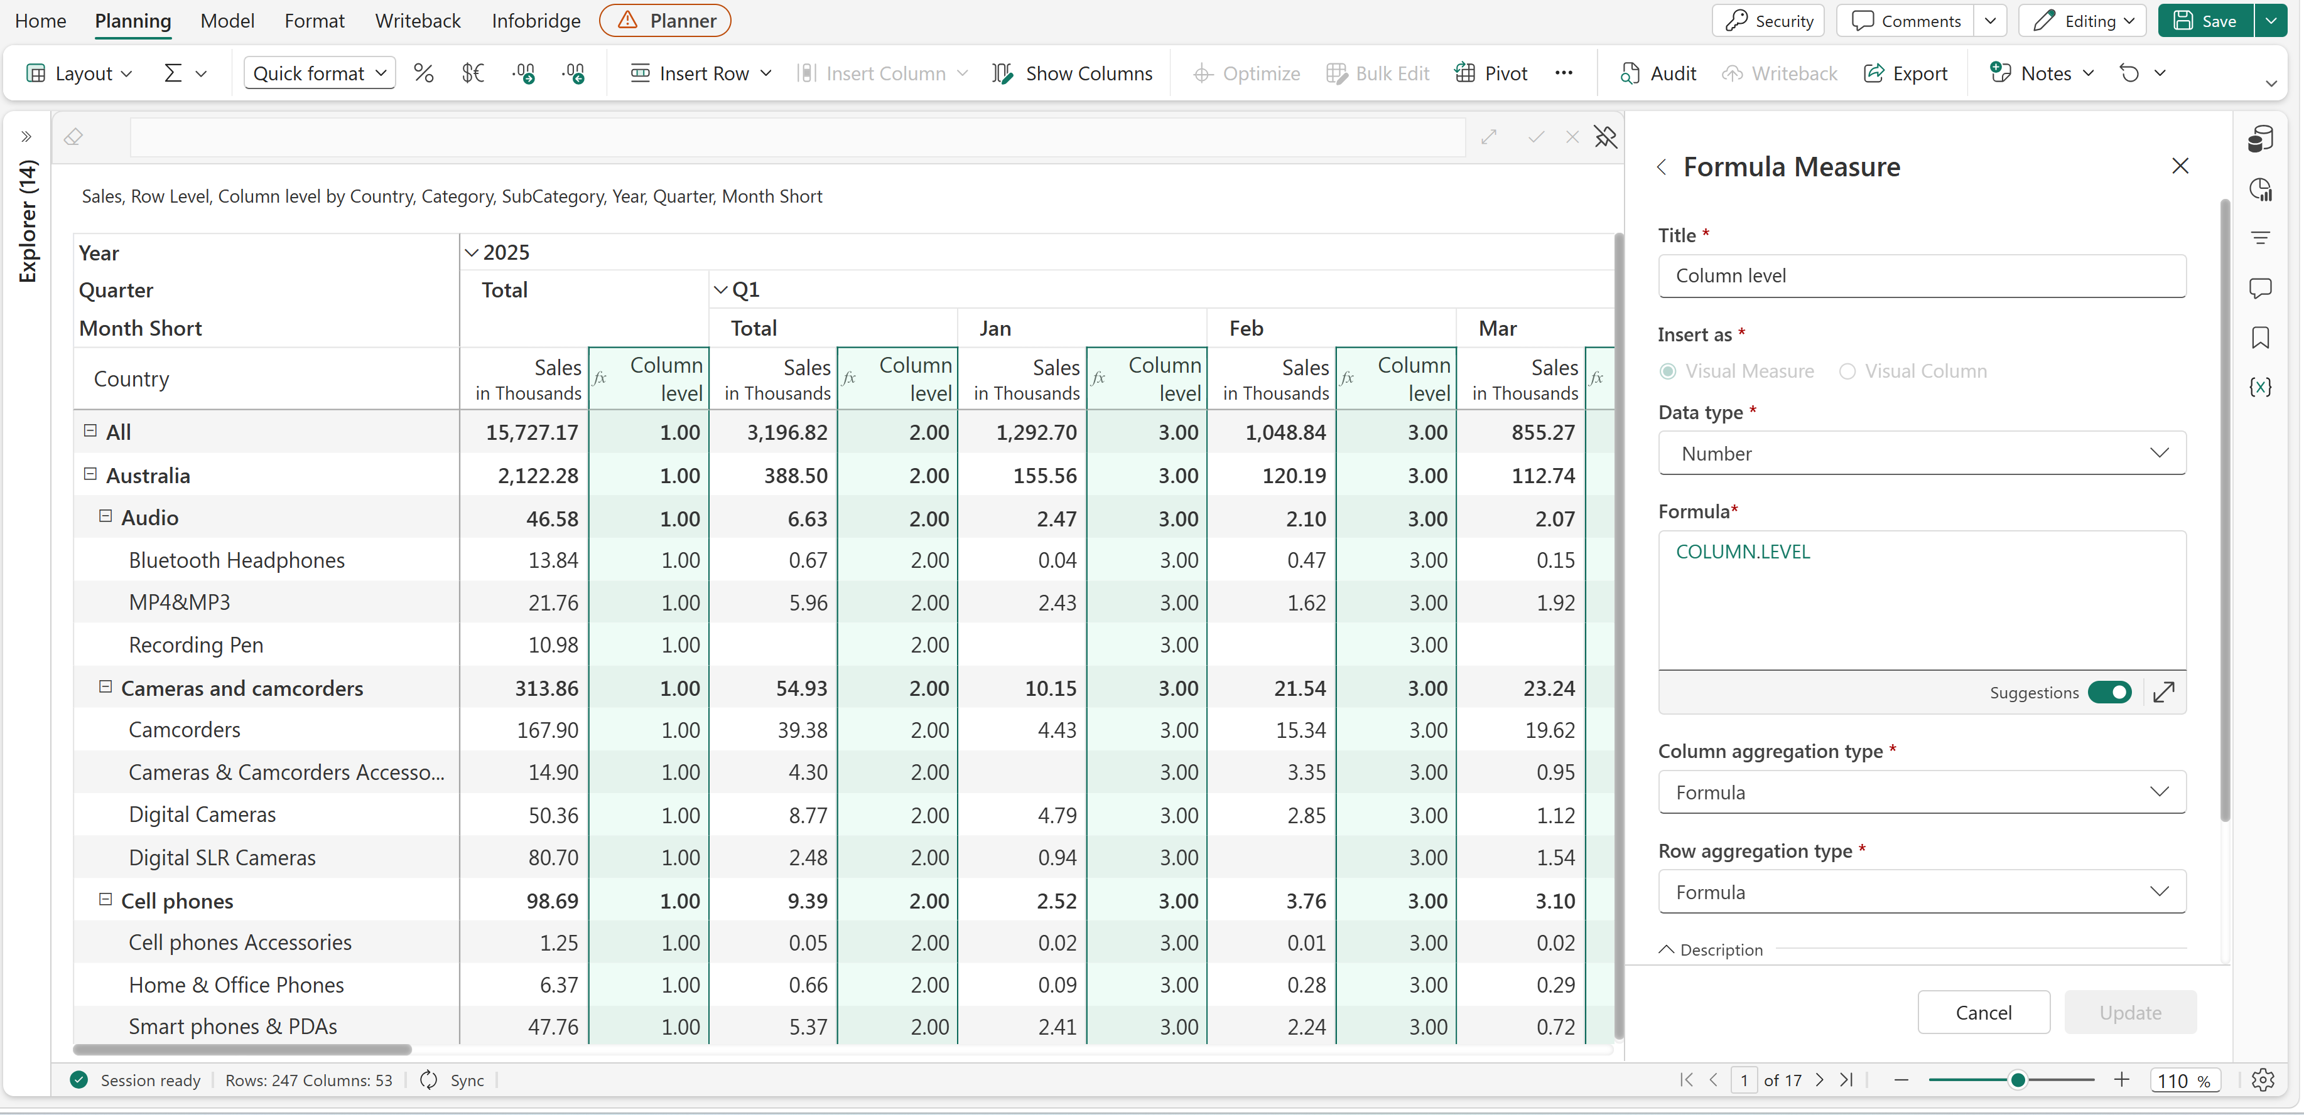
You can use the returned level in formulas to perform different calculations or apply conditional logic based on the current column hierarchy level.
COLUMN.PARENT
The COLUMN.PARENT identifier returns the immediate parent of the current column in a column hierarchy. Use this identifier to reference higher-level members, such as a quarter from a month or a year from a quarter. To navigate multiple hierarchy levels, chain the identifier. For example, COLUMN.PARENT.PARENT returns the grandparent of the current column.
Syntax
COLUMN.PARENT.[<Measure>]
To reference higher hierarchy levels, chain the identifier:
COLUMN.PARENT.PARENT.[<Measure>]
Examples
Example 1: Calculate monthly contribution to the quarterly total
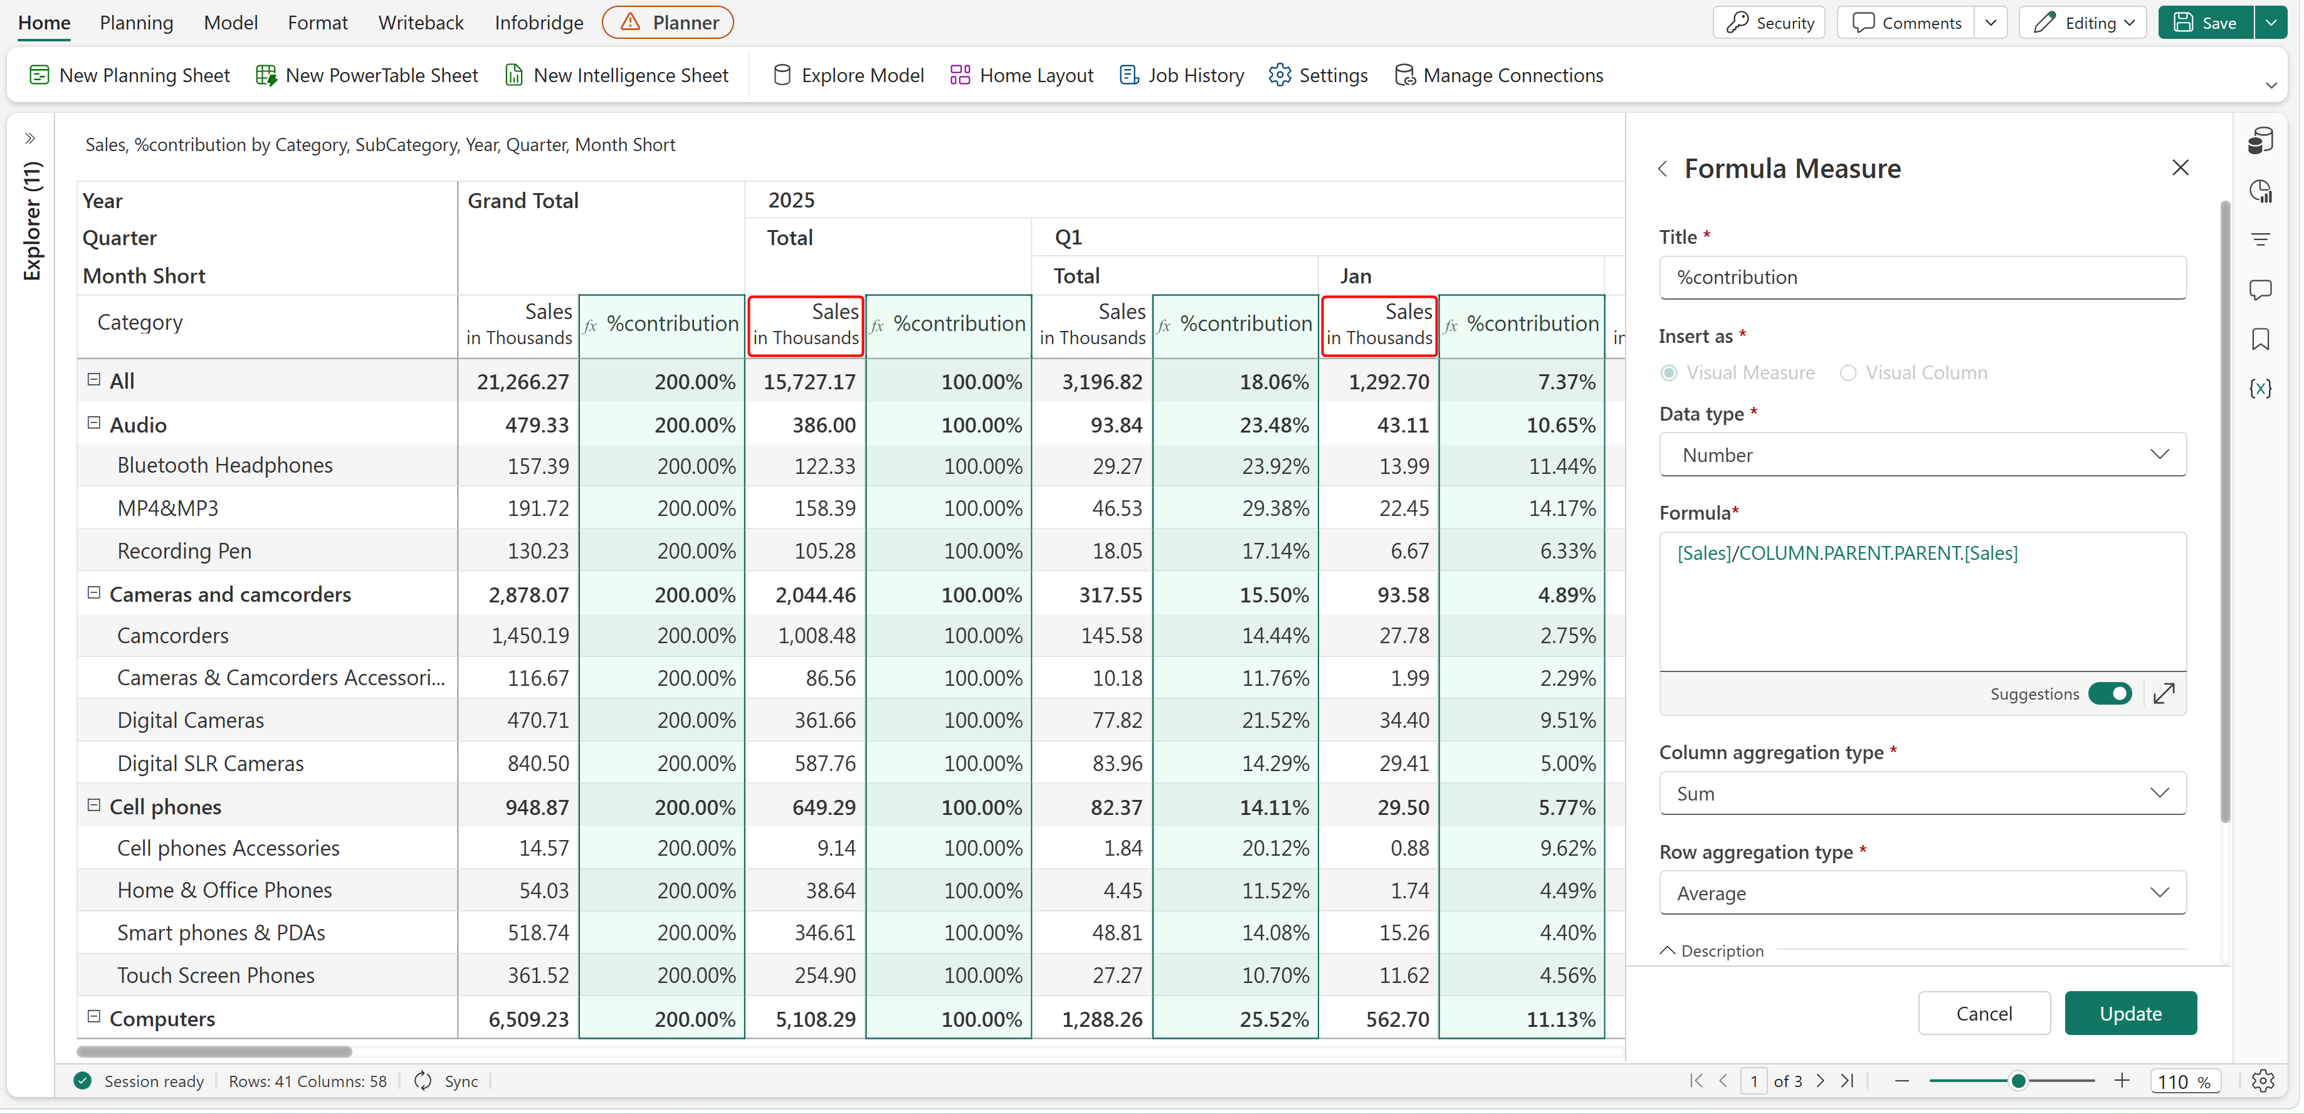
The following example calculates the percentage contribution of a month's sales to the total sales for its quarter by dividing the current Sales value by the Sales value of its immediate parent column.
[Sales] / COLUMN.PARENT.[Sales]
In this example, January is the current column and Q1 is its immediate parent. The formula calculates January's contribution to the total sales for Q1. For example, if January sales are 1,292.70 and Q1 sales are 3,196.82, the result is 40.43%.
![Screenshot of a planning sheet with the Formula Measure panel showing the %contribution formula using COLUMN.PARENT.[Sales].](../media/planning-reference-formulas/identifiers/column-parent.png#lightbox)
Example 2: Calculate monthly contribution to the annual total
The following example calculates the percentage contribution of a month's sales to the total sales for the year by dividing the current Sales value by the Sales value of the grandparent column.
[Sales] / COLUMN.PARENT.PARENT.[Sales]
In this example, January is the current column, Q1 is its parent, and 2025 is the grandparent. The formula calculates January's contribution to the annual sales total by referencing the Year column through COLUMN.PARENT.PARENT.
DESCENDANTS
The DESCENDANTS identifier returns an array containing the values of all descendant members of the referenced hierarchy member, including all child levels down to the leaf level. Because the identifier returns an array, you must use it with an aggregate function, such as SUM, MIN, MAX, or AVERAGE, to return a single value.
Syntax
[HierarchyMember].DESCENDANTS
Example
The following example uses the MIN function with the DESCENDANTS identifier to return the minimum sales value from all descendant members of the Audio category.
MIN([Audio].DESCENDANTS)
The DESCENDANTS identifier returns the sales values for all descendant members of the Audio category, including Bluetooth Headphones, Recording Pen, and MP4&MP3. The MIN function evaluates the returned array and displays the smallest value.
![Screenshot of a planning grid with a Descendants calculated row and the Calculated Row pane showing the MIN([Audio].DESCENDANTS) formula.](../media/planning-reference-formulas/identifiers/descendants.png#lightbox)
FORECAST.CLOSED_END
The CLOSED_END identifier returns the end date of the closed forecast for the referenced forecast. Use this identifier to retrieve the date through which the forecast is closed and use it in calculations or display it in a measure.
Syntax
[Forecast].CLOSED_END
Example
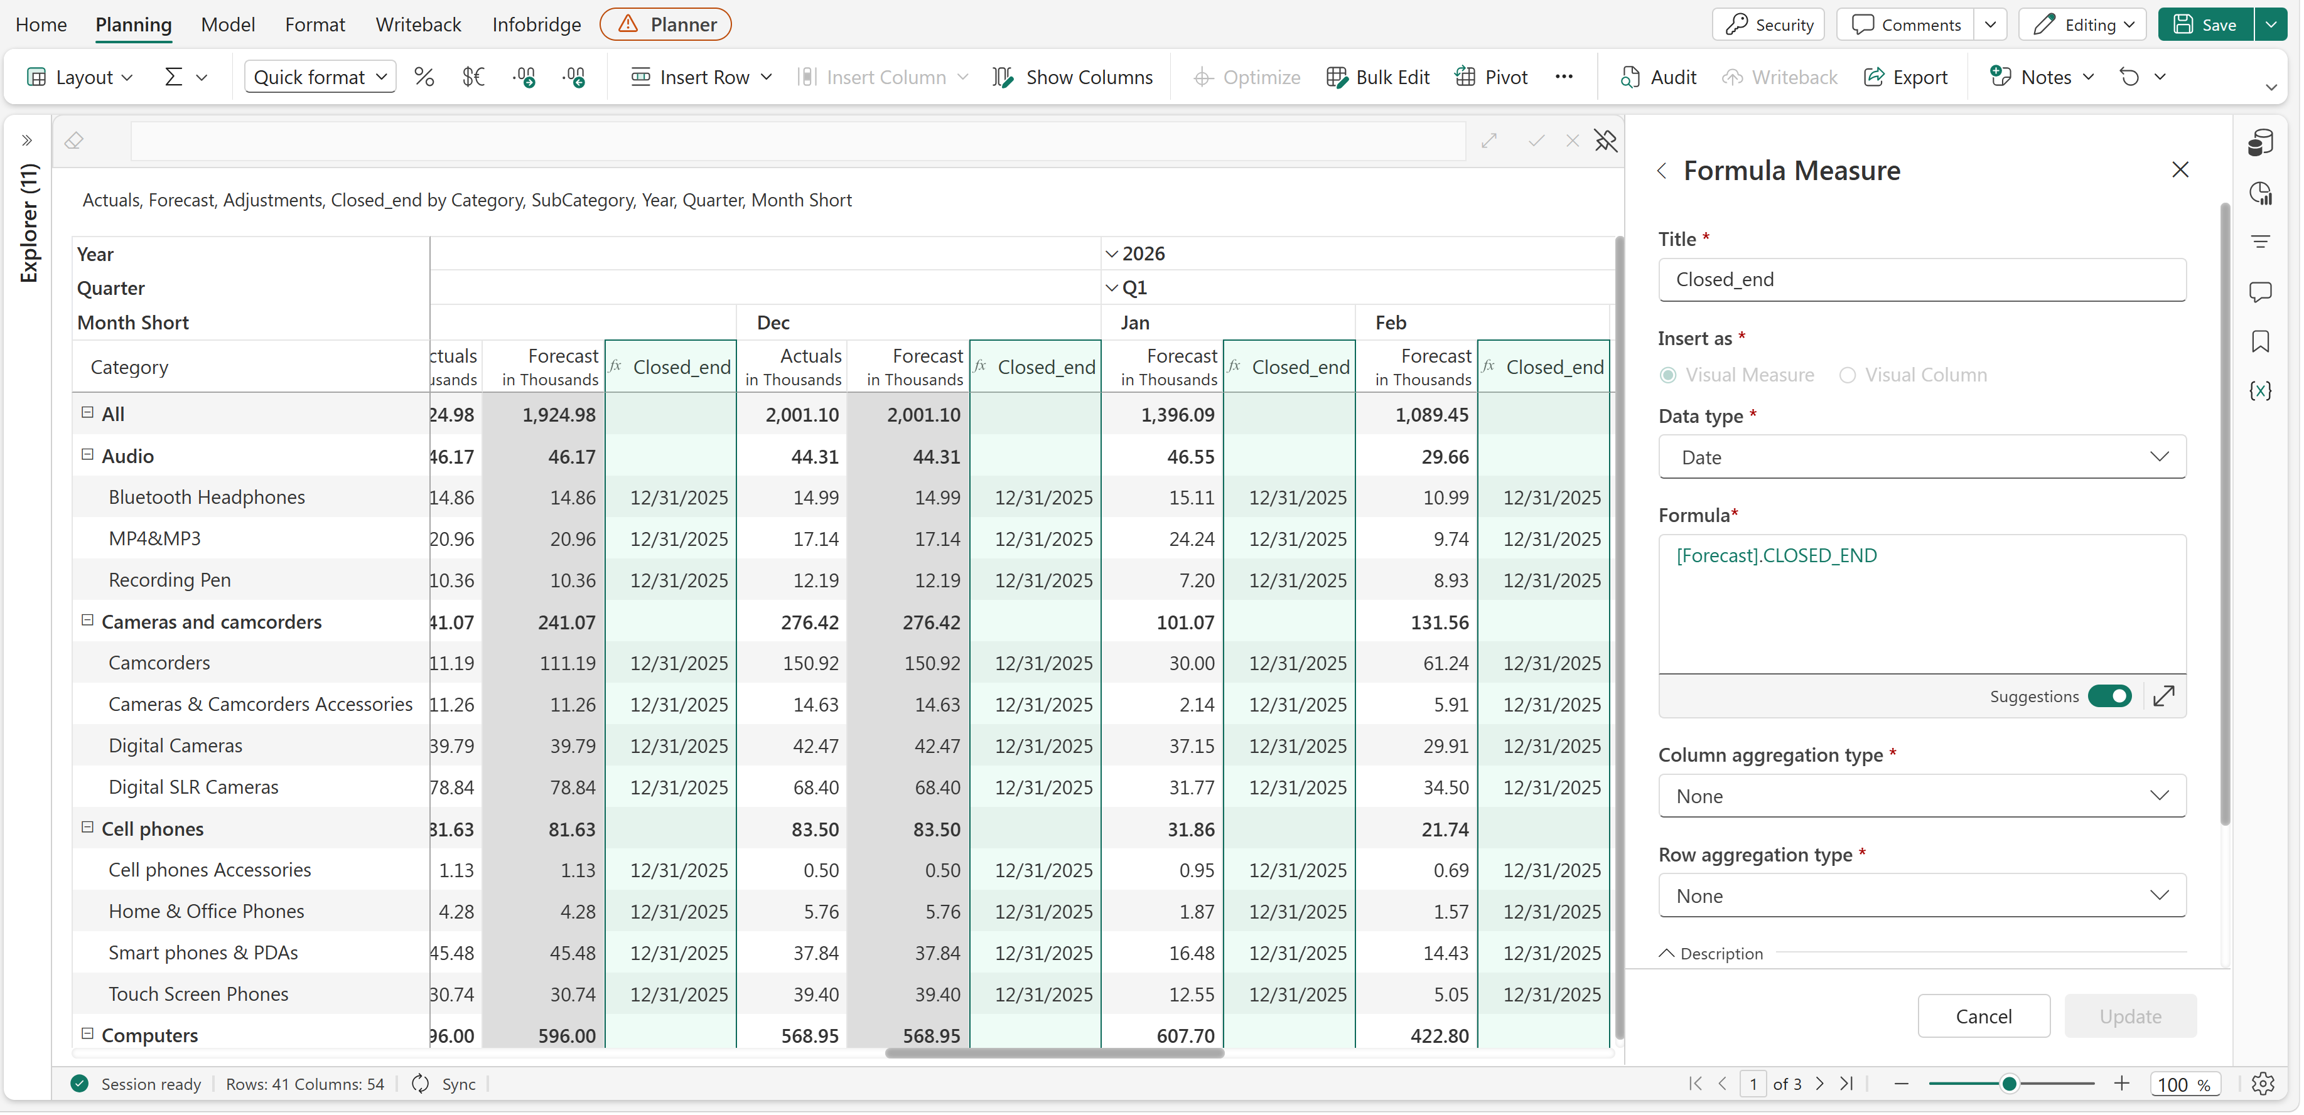
The following example returns the end date of the closed forecast for the Forecast measure.
[Forecast].CLOSED_END
The forecast is closed through December 2025. Therefore, the identifier returns 12/31/2025 for each period in the report.
FORECAST.CLOSED_START
The CLOSED_START identifier returns the start date of the closed forecast period for the referenced forecast. Use this identifier to determine the first date included in the closed forecast.
Syntax
[Forecast].CLOSED_START
Example
The following example returns the start date of the closed forecast period for the Forecast measure.
[Forecast].CLOSED_START
For the referenced forecast, the closed forecast period begins on January 1, 2025. Therefore, the identifier returns 1/1/2025, indicating the first date included in the closed forecast period.
![Screenshot of the Formula Measure pane with formula [Forecast].CLOSED_START and a Closed_Start column showing 1/1/2025.](../media/planning-reference-formulas/identifiers/forecast-closedstart.png#lightbox)
FORECAST.OPEN_END
The OPEN_END identifier returns the end date of the open forecast period for the referenced forecast. Use this identifier to determine the last date included in the open forecast.
Syntax
[Forecast].OPEN_END
Example
The following example returns the end date of the open forecast period for the Forecast measure.
[Forecast].OPEN_END
The open forecast period ends on December 31, 2027. Therefore, the identifier returns 12/31/2027, indicating the last date included in the open forecast period.
![Screenshot of the Formula Measure pane with formula [Forecast].OPEN_END and grid columns showing 12/31/2027.](../media/planning-reference-formulas/identifiers/forecast-openend.png#lightbox)
FORECAST.OPEN_START
The OPEN_START identifier returns the start date of the open forecast period for the referenced forecast. Use this identifier to determine the first date included in the open forecast.
Syntax
[Forecast].OPEN_START
Example
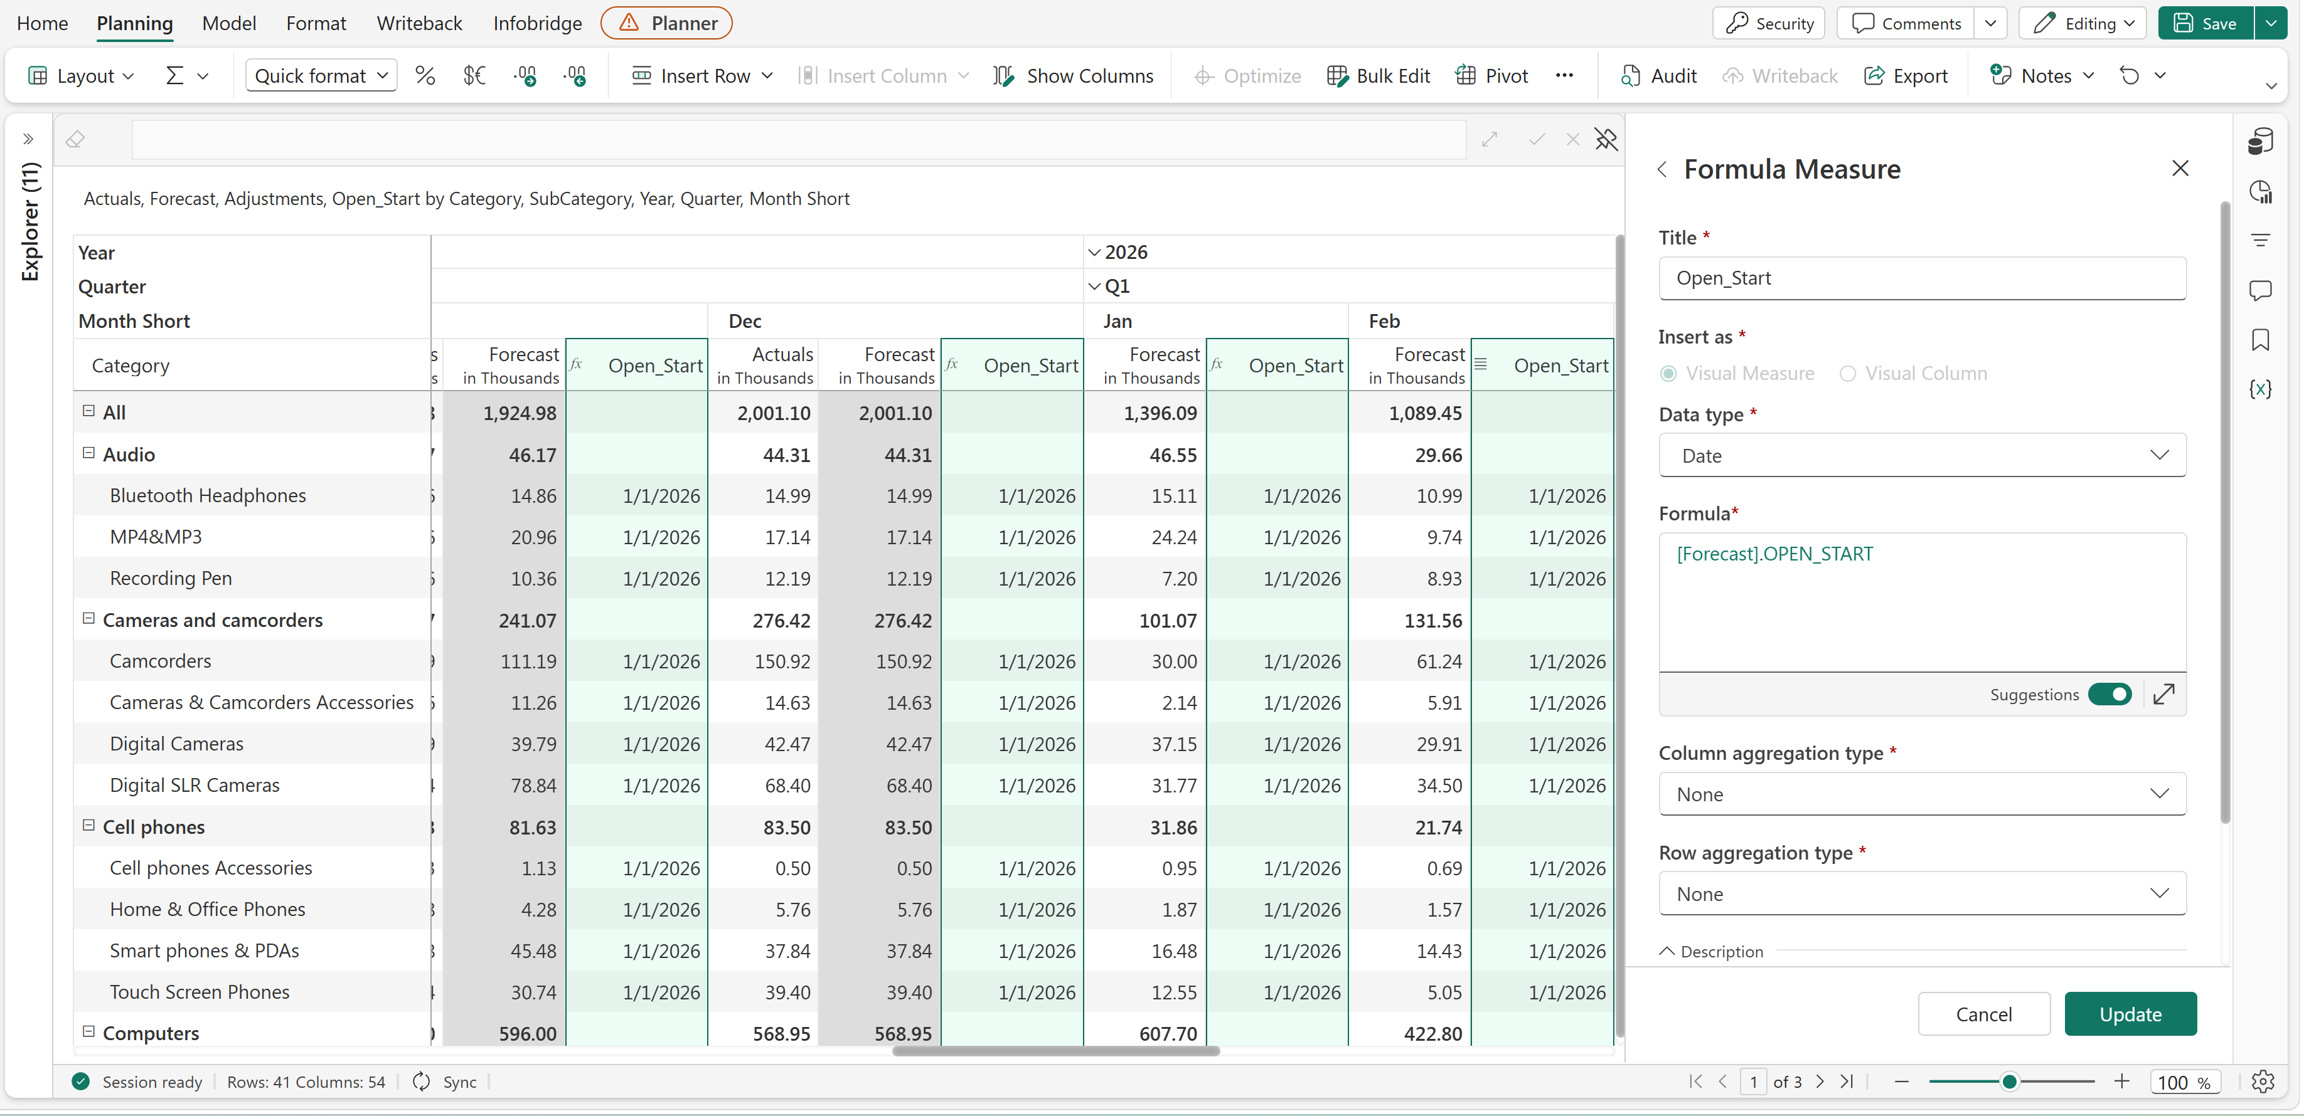
The following example returns the start date of the open forecast period for the Forecast measure.
[Forecast].OPEN_START
The open forecast period begins on January 1, 2026. Therefore, the identifier returns 1/1/2026, indicating the first date included in the open forecast period.
HAS
The HAS function checks whether the specified value exists in one or more columns. Use this function with formula columns and data input columns, such as Single Select and Multi-select.
Syntax
HAS([column1, [column2], ...], searchvalue)
Arguments
[column1, [column2], ...]: A list of columns to search. The list must contain at least one column.searchvalue: The value to search for in the specified columns.
Return value
Returns TRUE if the specified value is found in any of the specified columns. Otherwise, returns FALSE.
Example
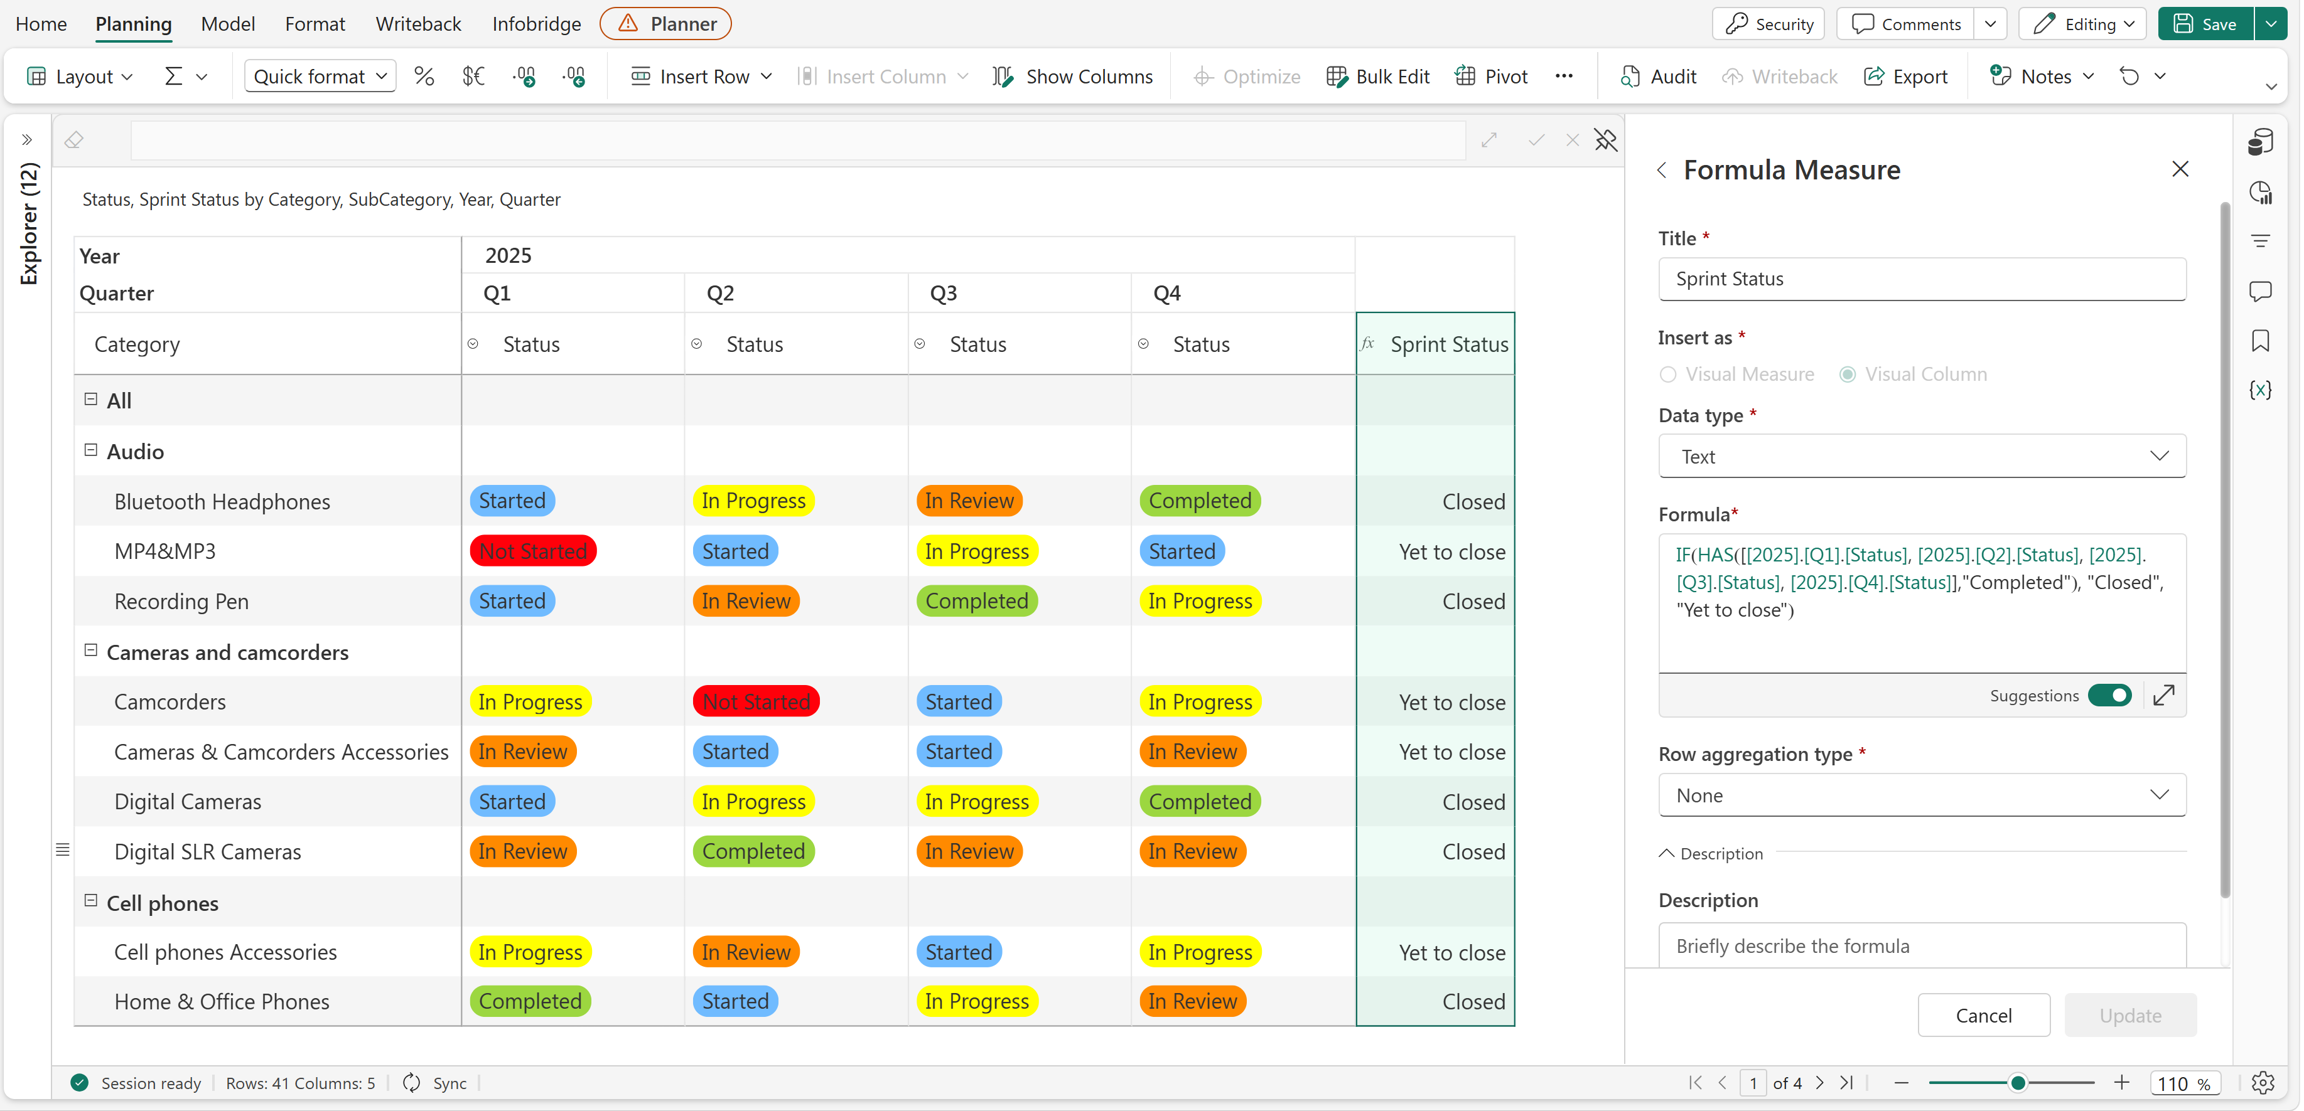
The following example checks whether the value Completed exists in the project status columns for the four quarters. The HAS function evaluates the status values and, if any quarter contains Completed, the IF function returns Closed. Otherwise, it returns Yet to close.
IF(HAS([[2025].[Q1].[Status], [2025].[Q2].[Status], [2025].[Q3].[Status], [2025].[Q4].[Status]], "Completed"), "Closed", "Yet to close")
HAS_ALL
The HAS_ALL function checks whether all the specified values exist in one or more columns. You can use this function with formula columns and data input columns, such as Single Select and Multi-select.
Syntax
HAS_ALL([column1, [column2], ...], [searchvalue1, [searchvalue2], ...])
Arguments
[column1, [column2], ...]: A list of columns to search. The list must contain at least one column.[searchvalue1, [searchvalue2], ...]: A list of values to search for. The list must contain at least one value.
Return value
Returns TRUE if all the specified values are found in the specified columns. Otherwise, returns FALSE.
Example
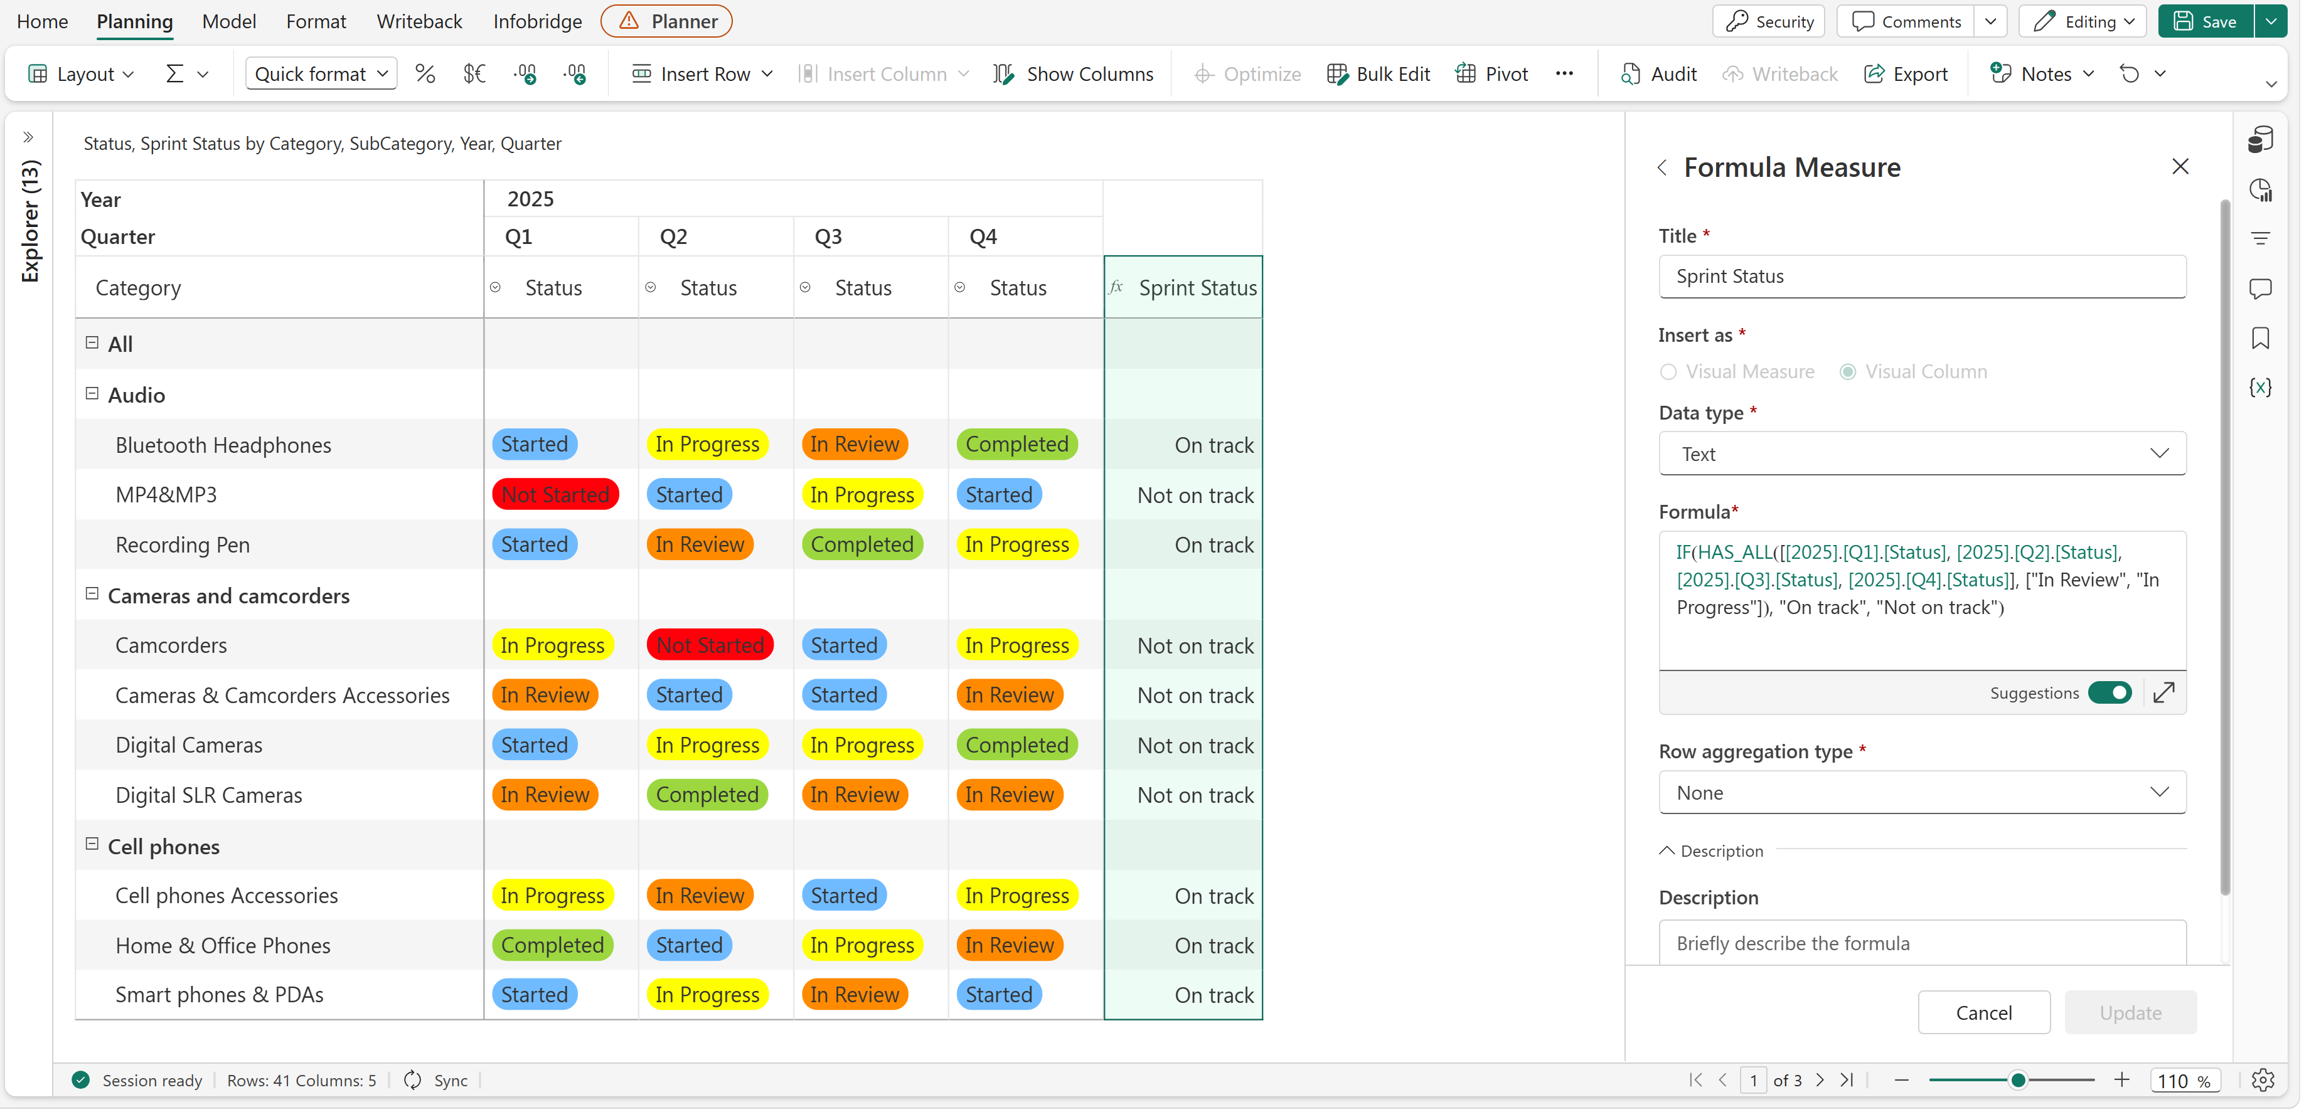
The following example checks whether the values In Review and In Progress exist in the project status columns for the four quarters. The HAS_ALL function evaluates the status values and, if both values are found, the IF function returns On track. Otherwise, it returns Not on track.
IF(HAS_ALL([[2025].[Q1].[Status], [2025].[Q2].[Status], [2025].[Q3].[Status], [2025].[Q4].[Status]], ["In Review", "In Progress"]), "On track", "Not on track")
HAS_SOME
The HAS_SOME function checks whether one or more of the specified values exist in one or more columns. You can use this function with formula columns and data input columns, such as Single Select and Multi-select.
Syntax
HAS_SOME([column1, [column2], ...], [searchvalue1, [searchvalue2], ...])
Arguments
[column1, [column2], ...]: A list of columns to search. The list must contain at least one column.[searchvalue1, [searchvalue2], ...]: A list of values to search for. The list must contain at least one value.
Return value
Returns TRUE if one or more of the specified values are found in the specified columns. Otherwise, returns FALSE.
Example
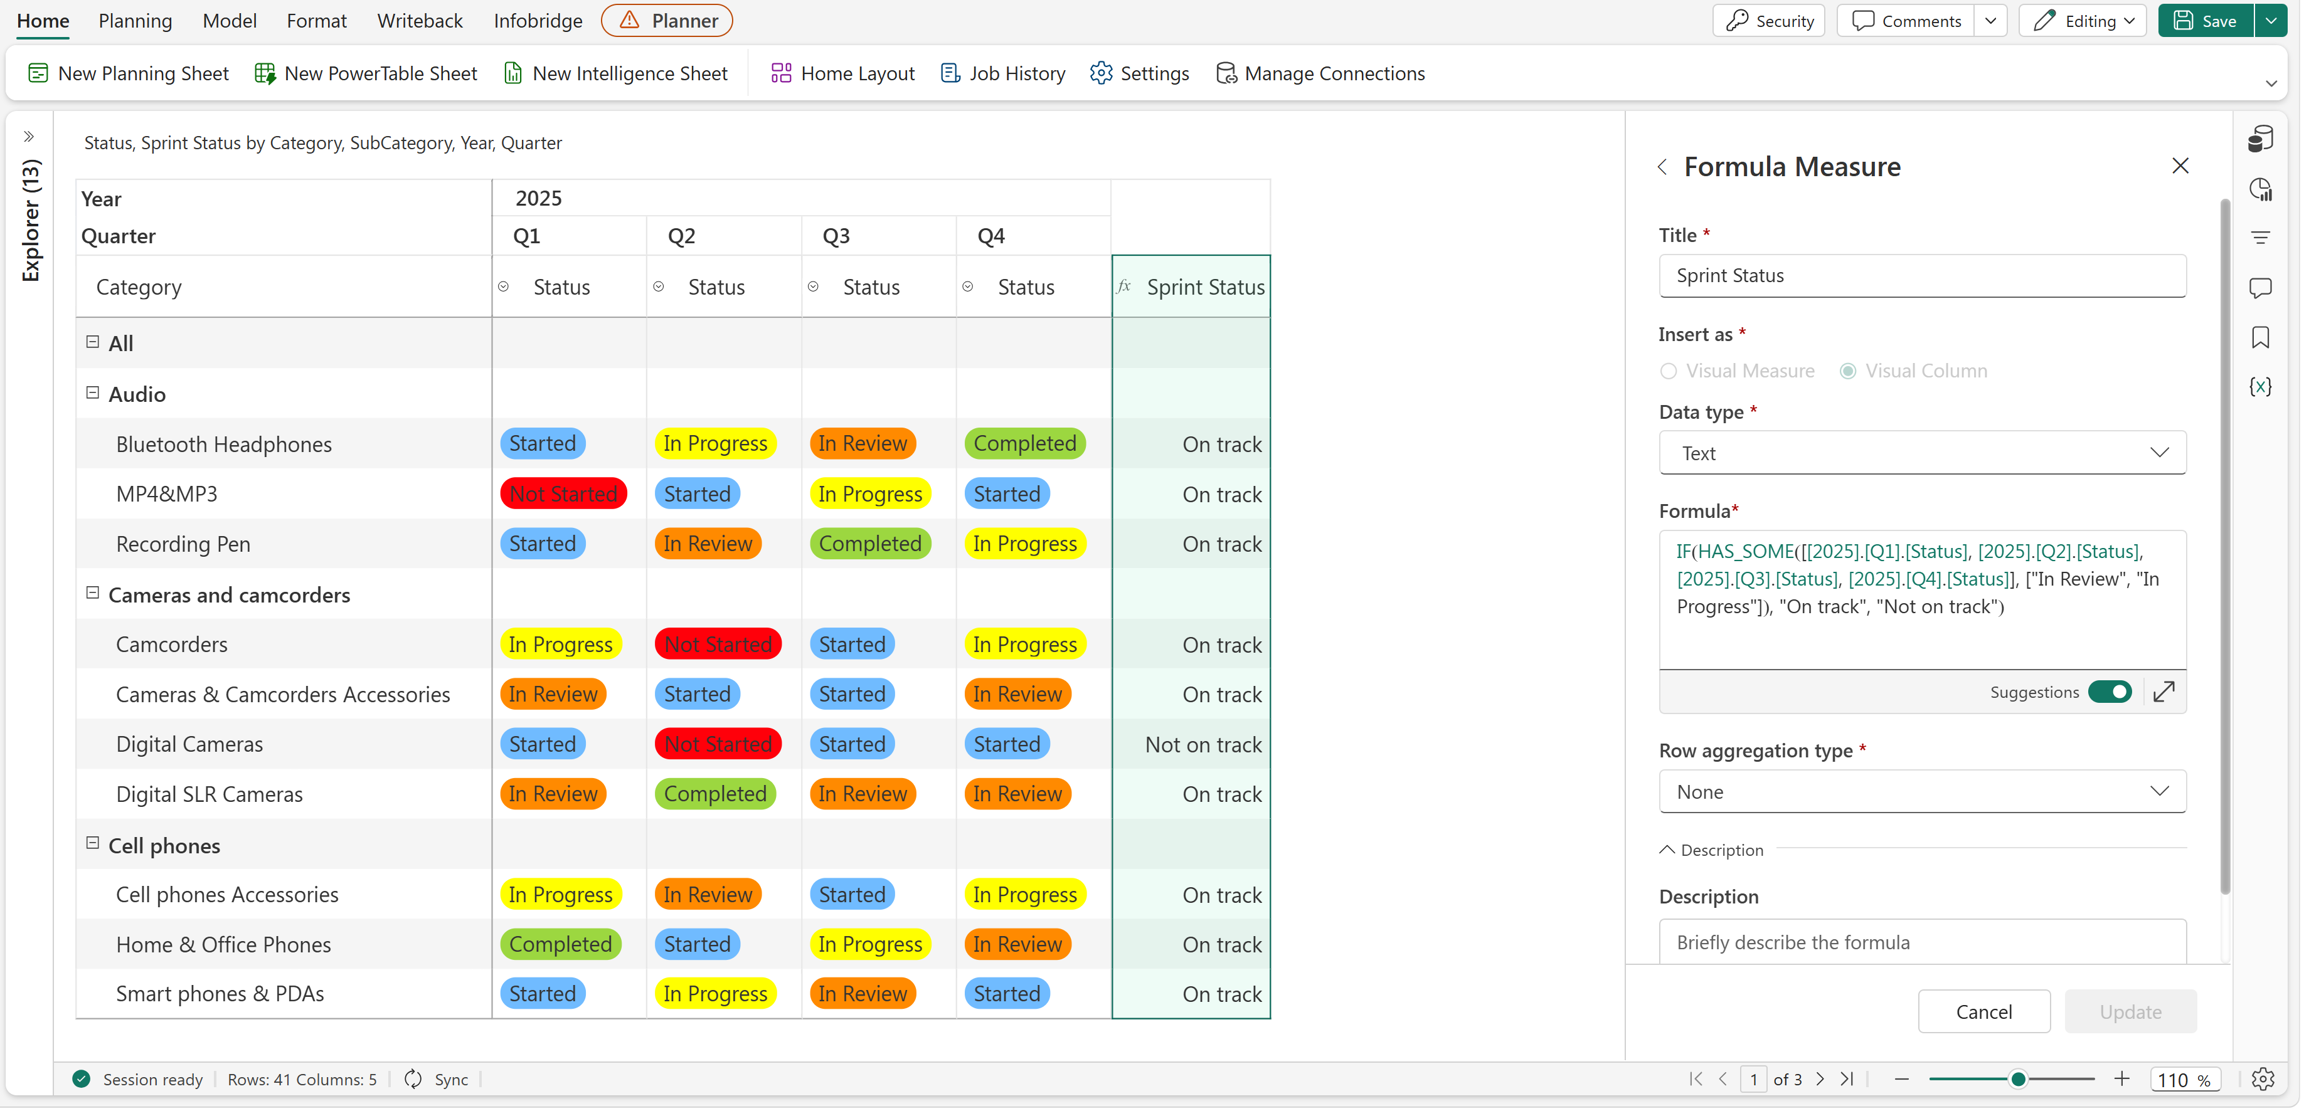
The following example checks whether the values In Review or In Progress exist in the project status columns for the four quarters. If either value is found in any quarter, the HAS_SOME function returns TRUE, and the IF function returns On track. Otherwise, it returns Not on track.
IF(HAS_SOME([[2025].[Q1].[Status], [2025].[Q2].[Status], [2025].[Q3].[Status], [2025].[Q4].[Status]], ["In Review", "In Progress"]), "On track", "Not on track")
LEAVES
The LEAVES identifier returns the values of all leaf nodes under the selected member as an array. Use this identifier with an aggregate function, such as SUM, MIN, MAX, or AVERAGE, to return a single value.
Syntax
<Member>.LEAVES
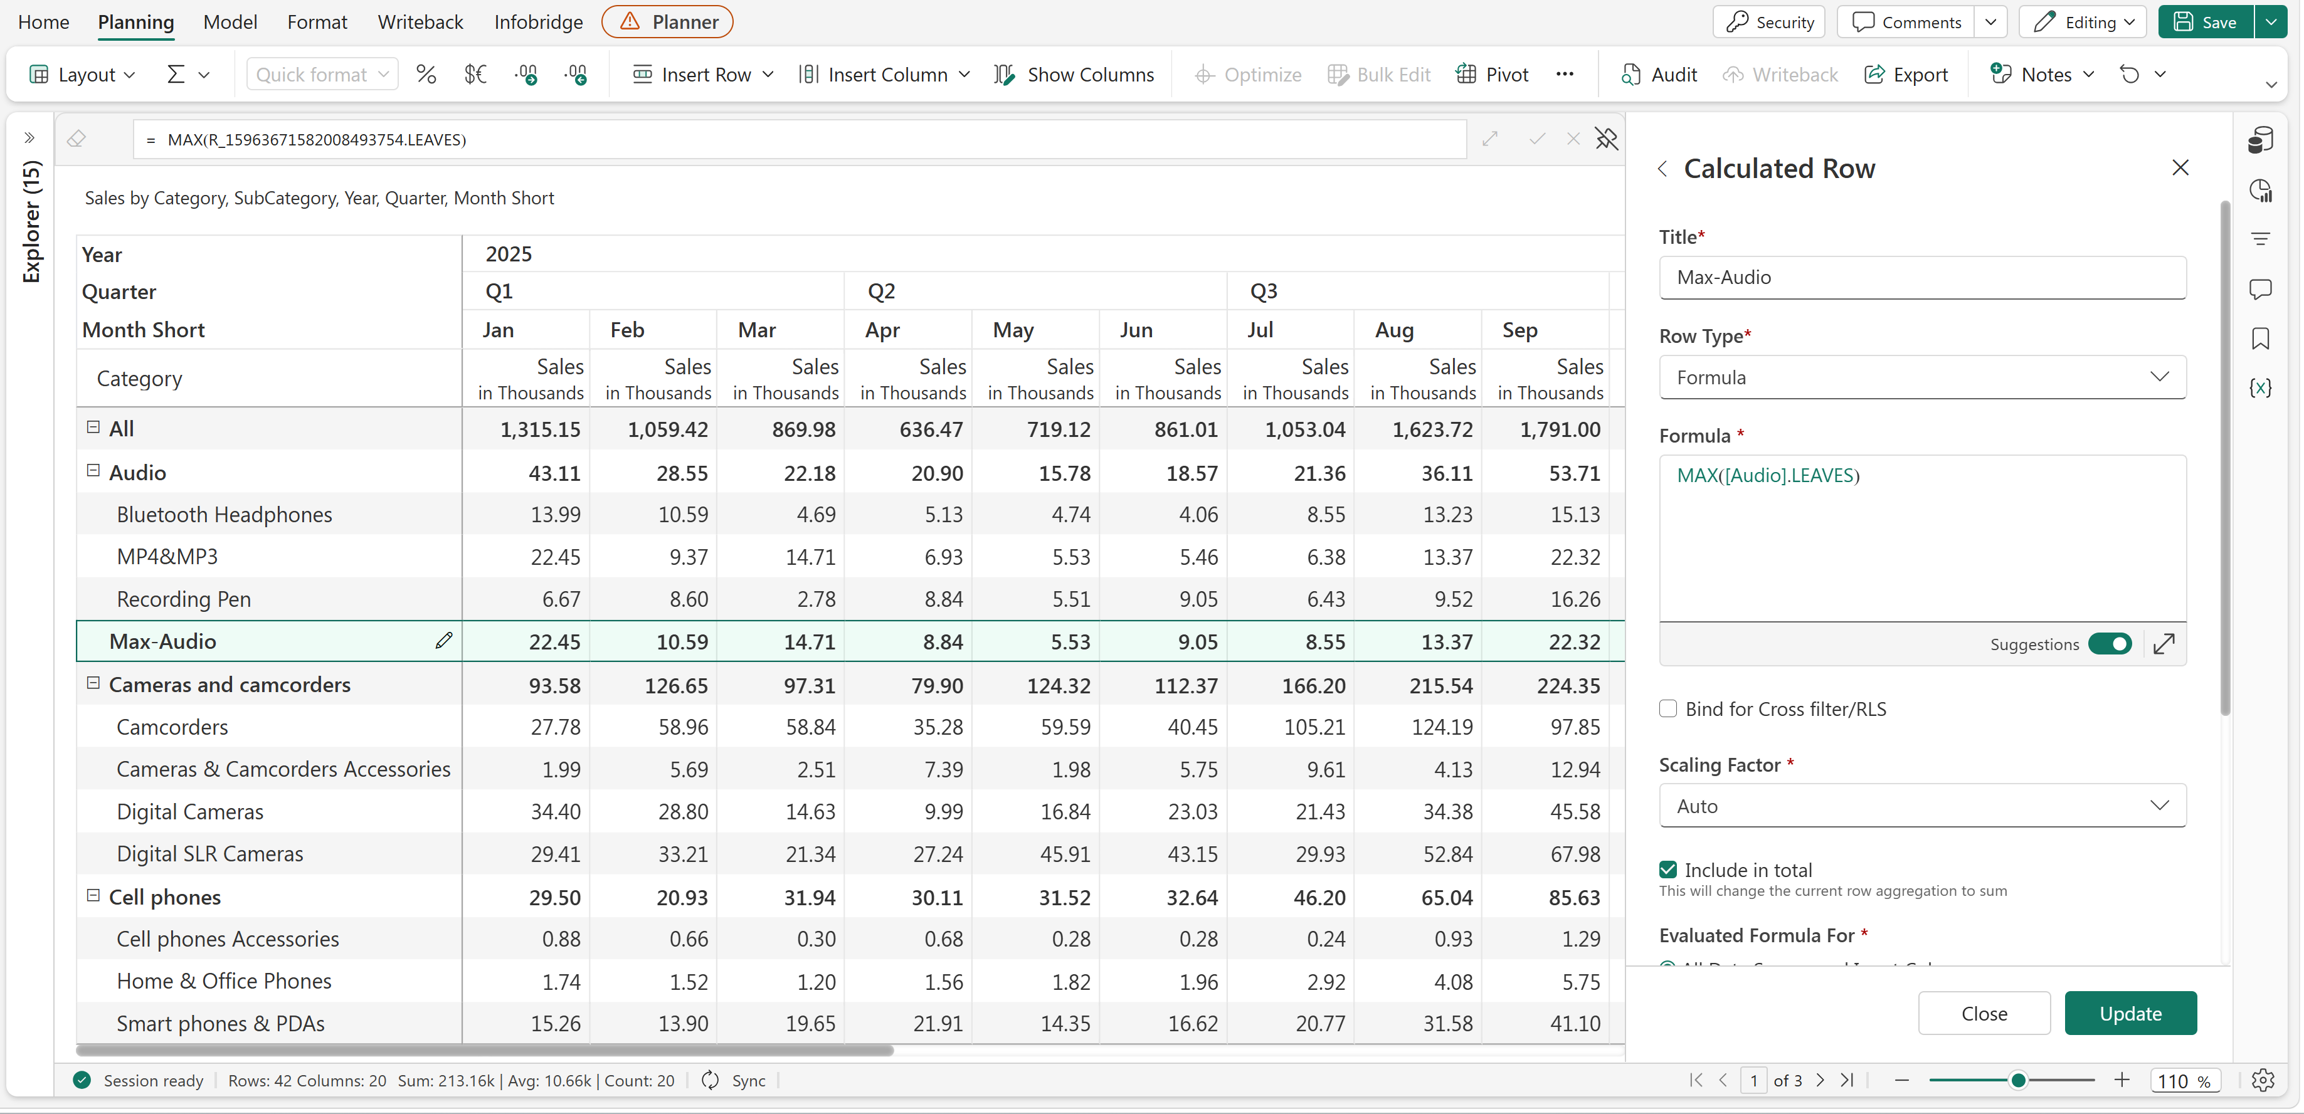
Example
MAX([Audio].LEAVES)
This formula returns the maximum value among all leaf nodes under Audio. The calculated row displays the maximum sales value for each period across all leaf-level members in the Audio hierarchy.
Difference between LEAVES and DESCENDANTS
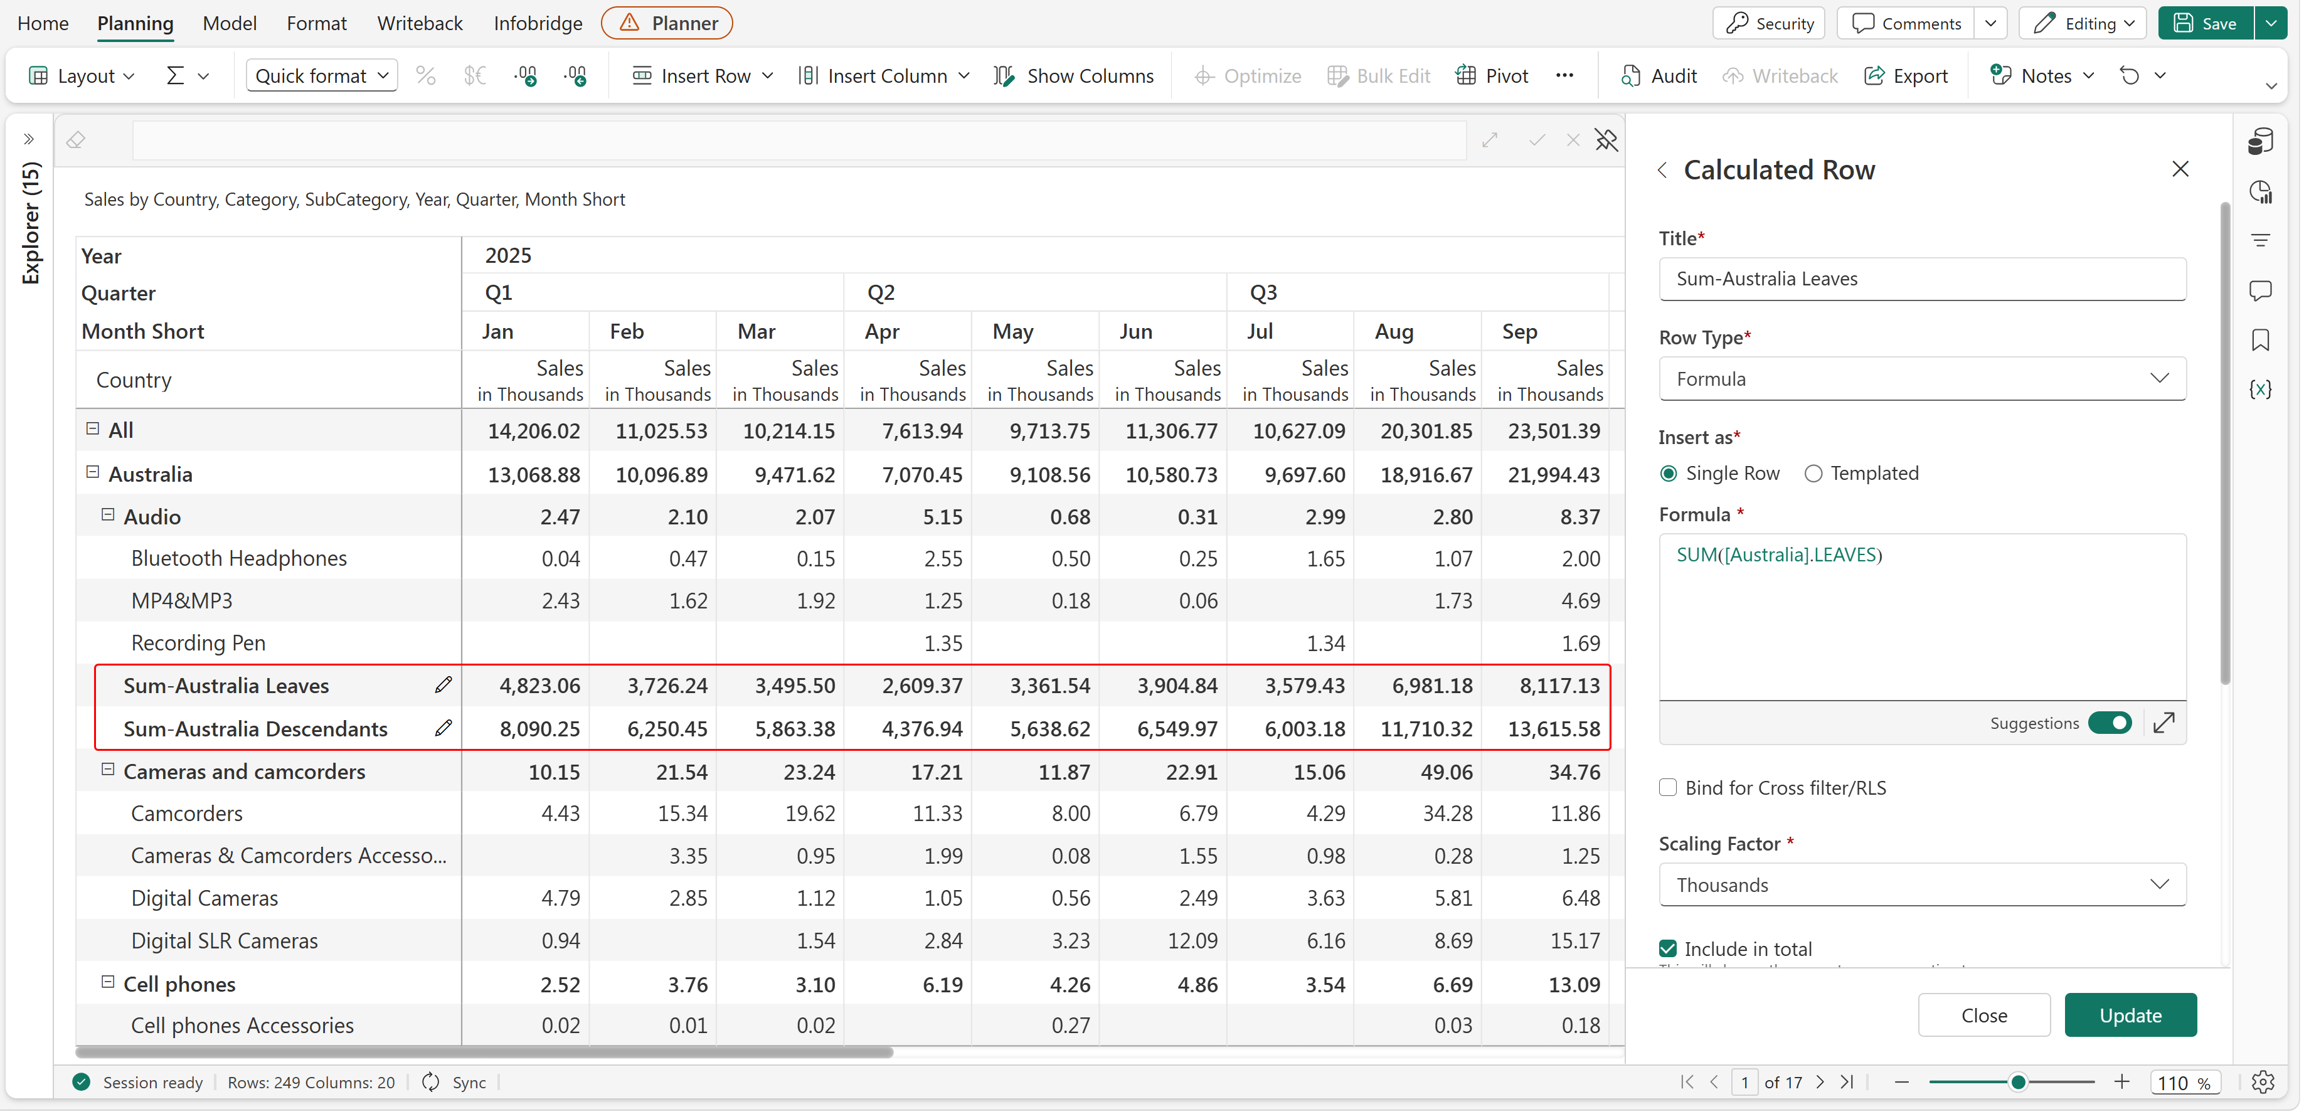
LEAVES and DESCENDANTS return different sets of members.
DESCENDANTSreturns all descendant members under the selected member, including intermediate hierarchy levels and leaf-level members.LEAVESreturns only the leaf-level members under the selected member.
For example, if Australia contains the hierarchy Audio > Bluetooth Headphones, MP4&MP3, Recording Pen, then:
Australia.DESCENDANTSreturns Audio, Bluetooth Headphones, MP4&MP3, and Recording Pen.Australia.LEAVESreturns Bluetooth Headphones, MP4&MP3, and Recording Pen only.
MATCH
The MATCH function checks whether the specified value exactly matches the value in a column.
Syntax
MATCH(column, searchvalue)
Arguments
column: The column to search.searchvalue: The value to search for in the specified column.
Return value
Returns TRUE if the specified value exactly matches the value in the column. Otherwise, returns FALSE.
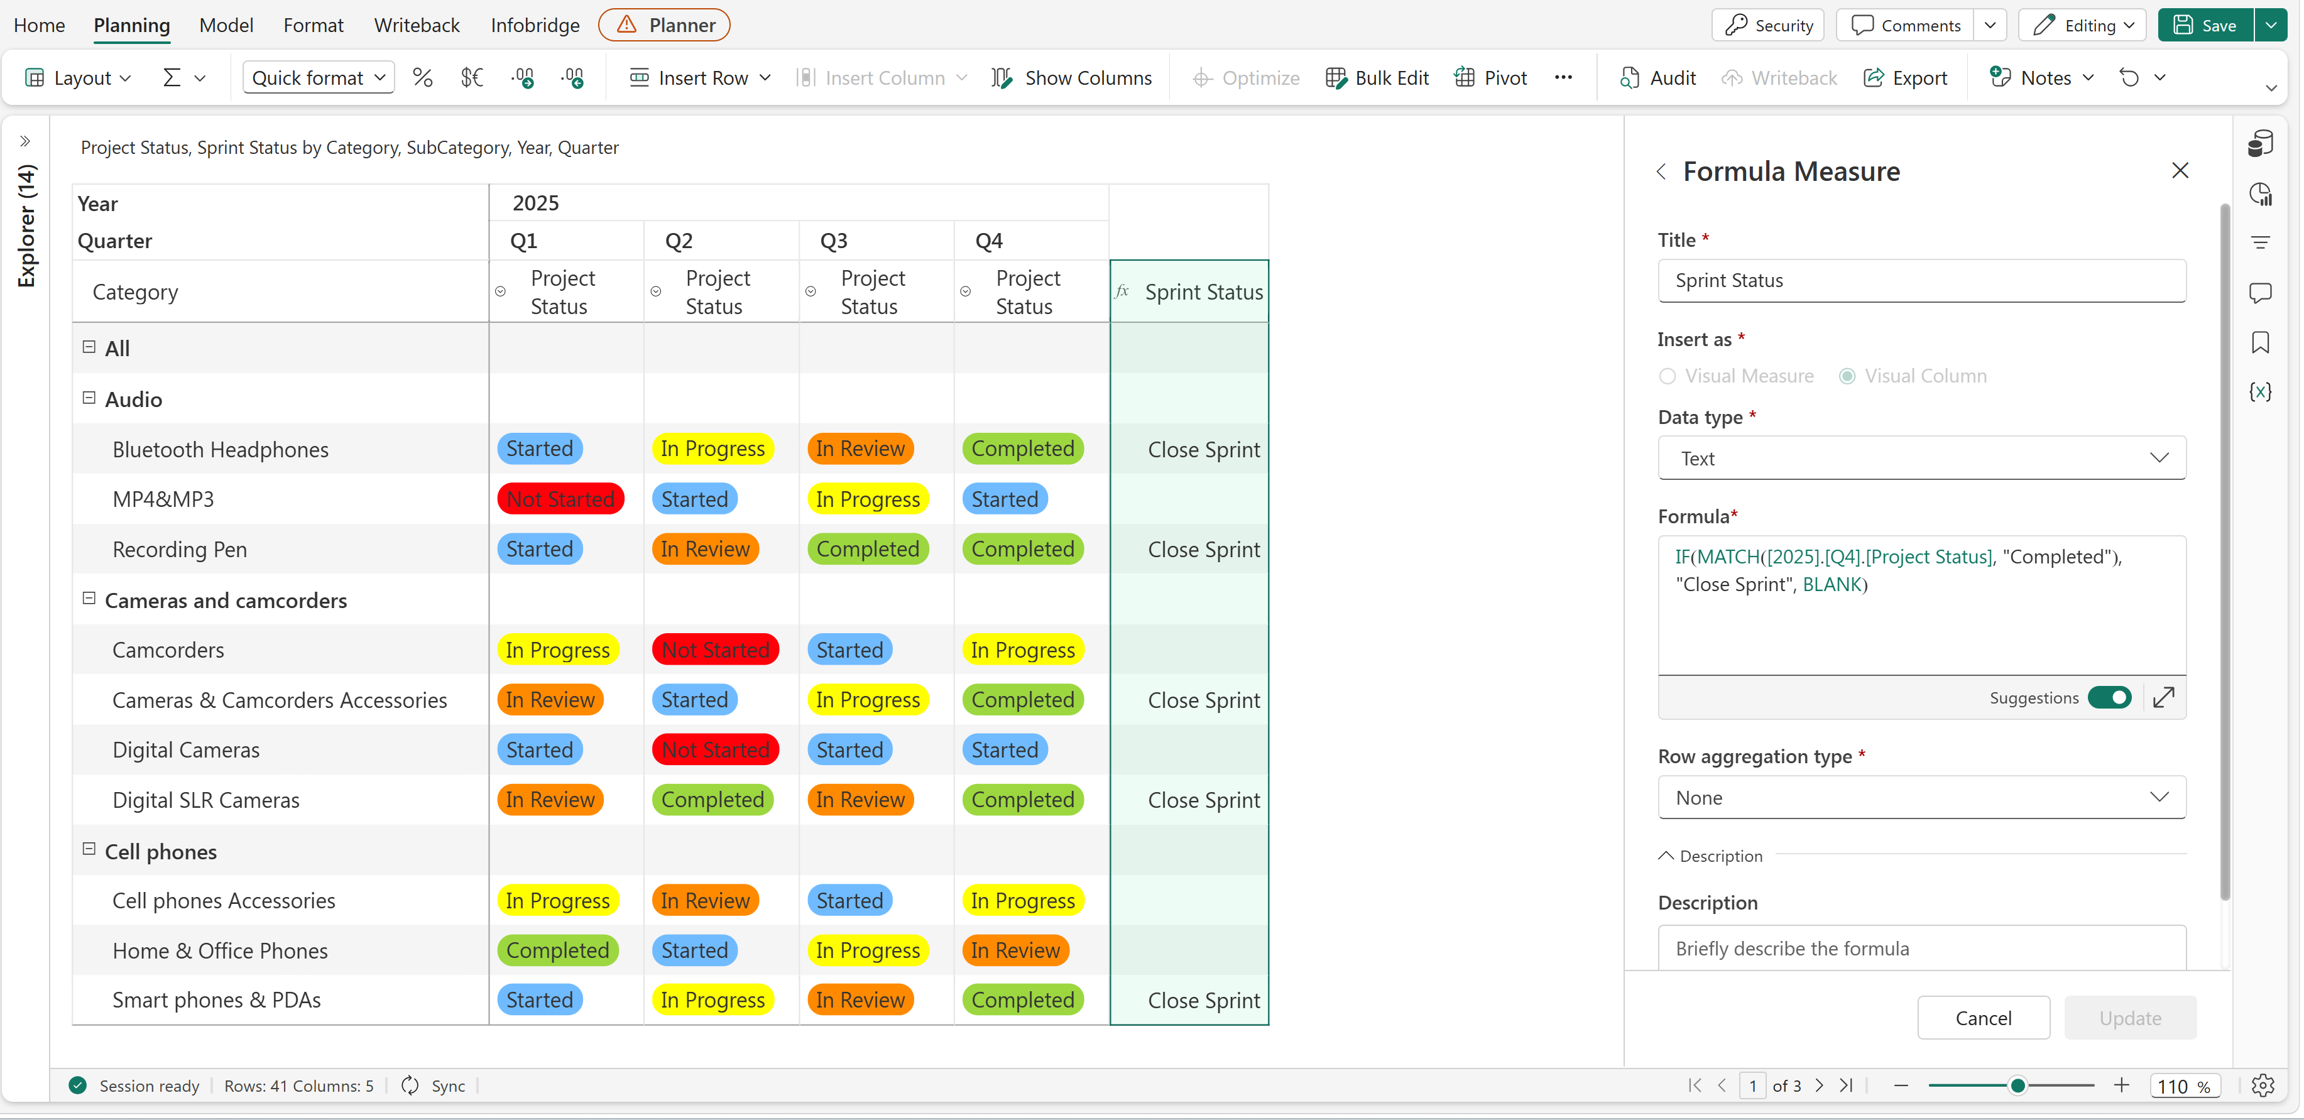
Example
IF(MATCH([2025].[Q4].[Project Status], "Completed"), "Close Sprint", BLANK)
In this example, the MATCH function compares the value in the Q4 Project Status column with Completed. If the values match exactly, the IF function returns Close Sprint; otherwise, it returns BLANK.
MAXDATE
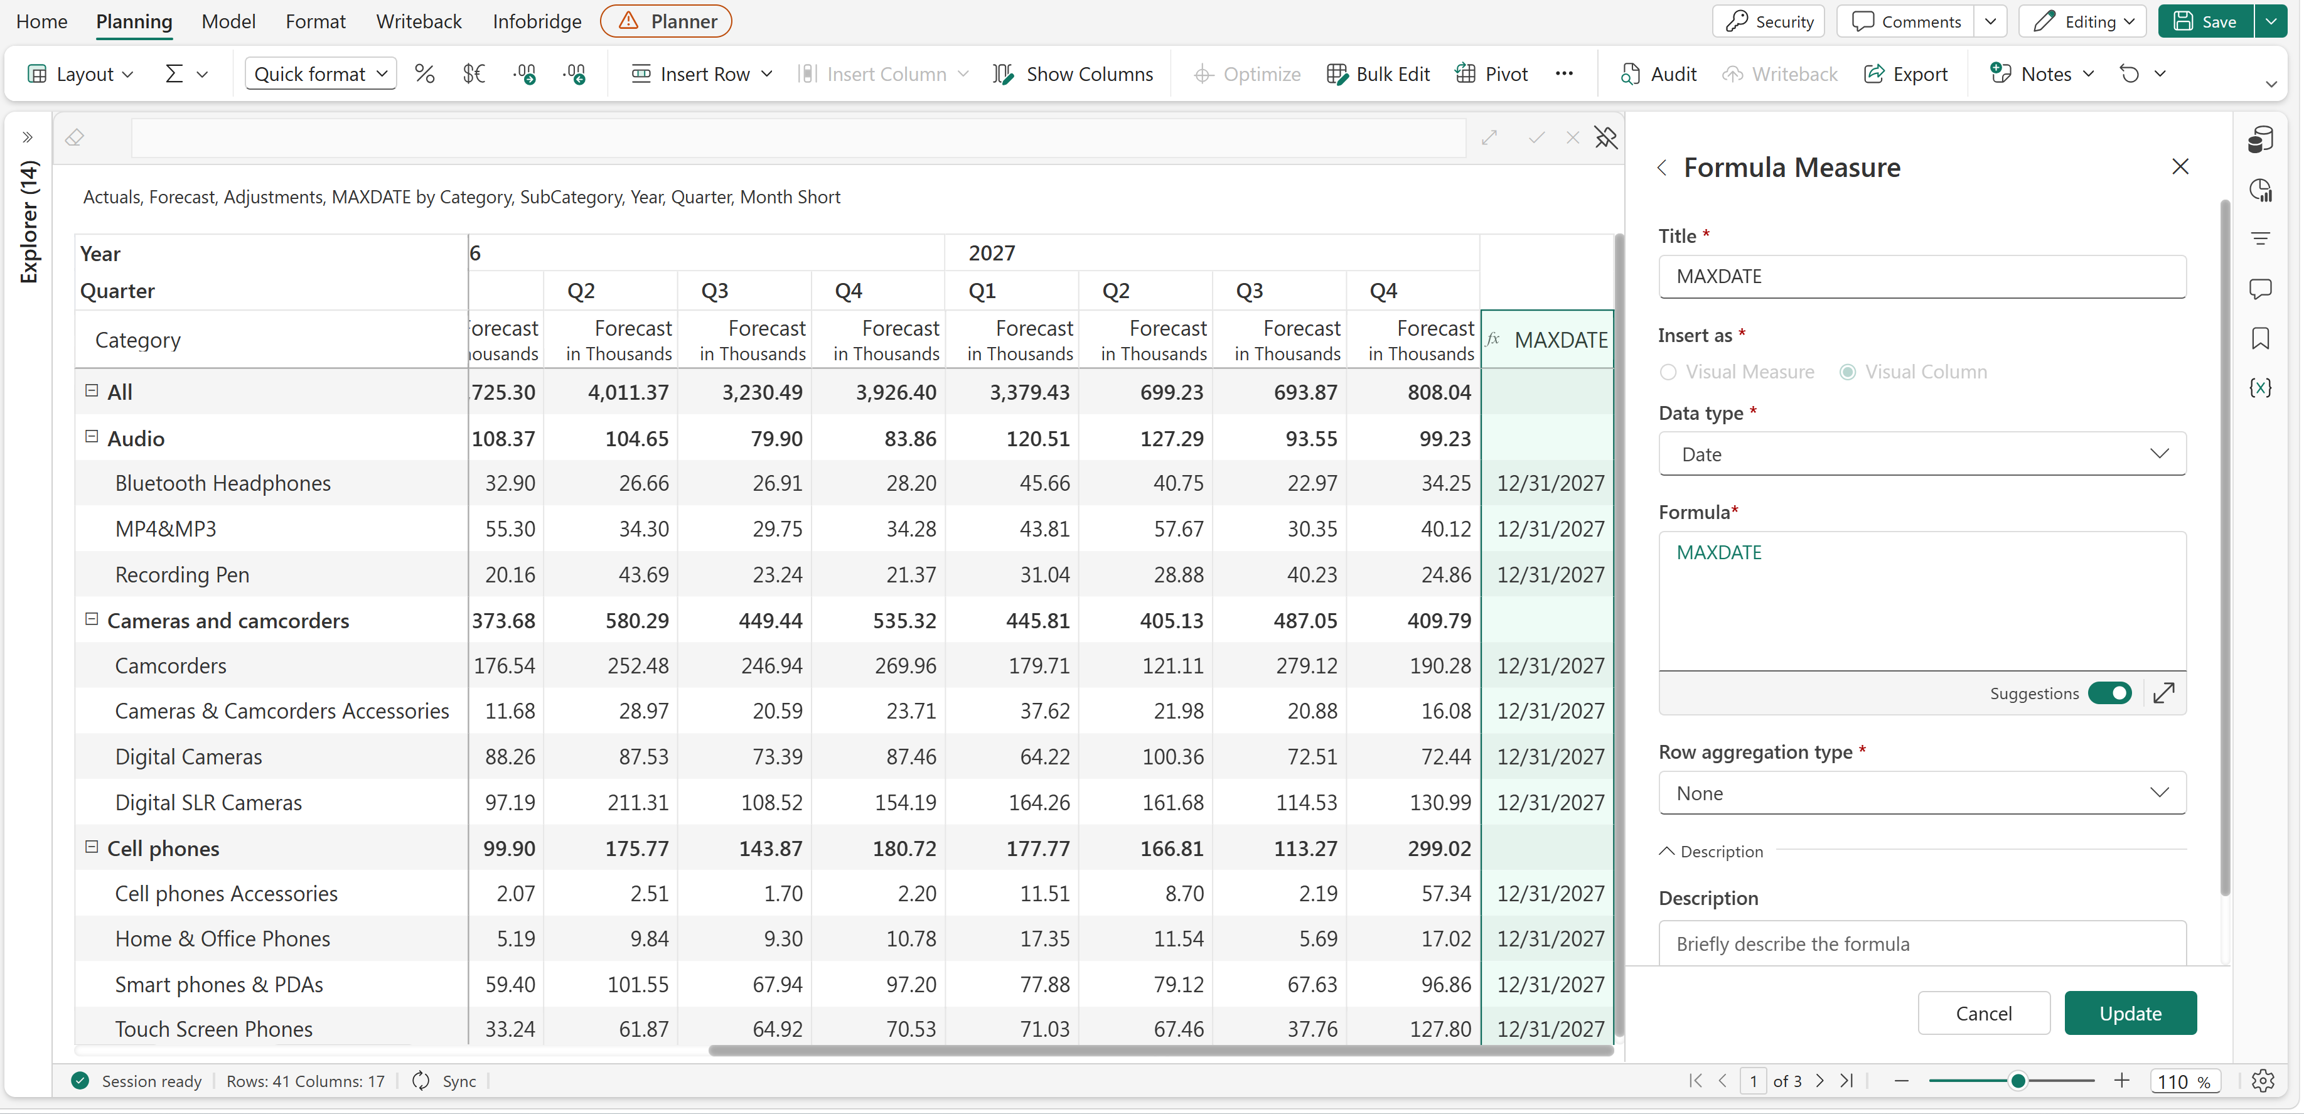
The MAXDATE identifier returns the latest date available in the column header.
Syntax
MAXDATE
Example
MAXDATE
In this example, the report contains forecast data through 2027, so the MAXDATE identifier returns 12/31/2027 for every row.
MEMBERS
The MEMBERS identifier returns the values of all immediate child members as an array. Use this identifier with an aggregate function, such as SUM, MIN, MAX, or AVERAGE, to return a single value.
Syntax
<Member>.MEMBERS
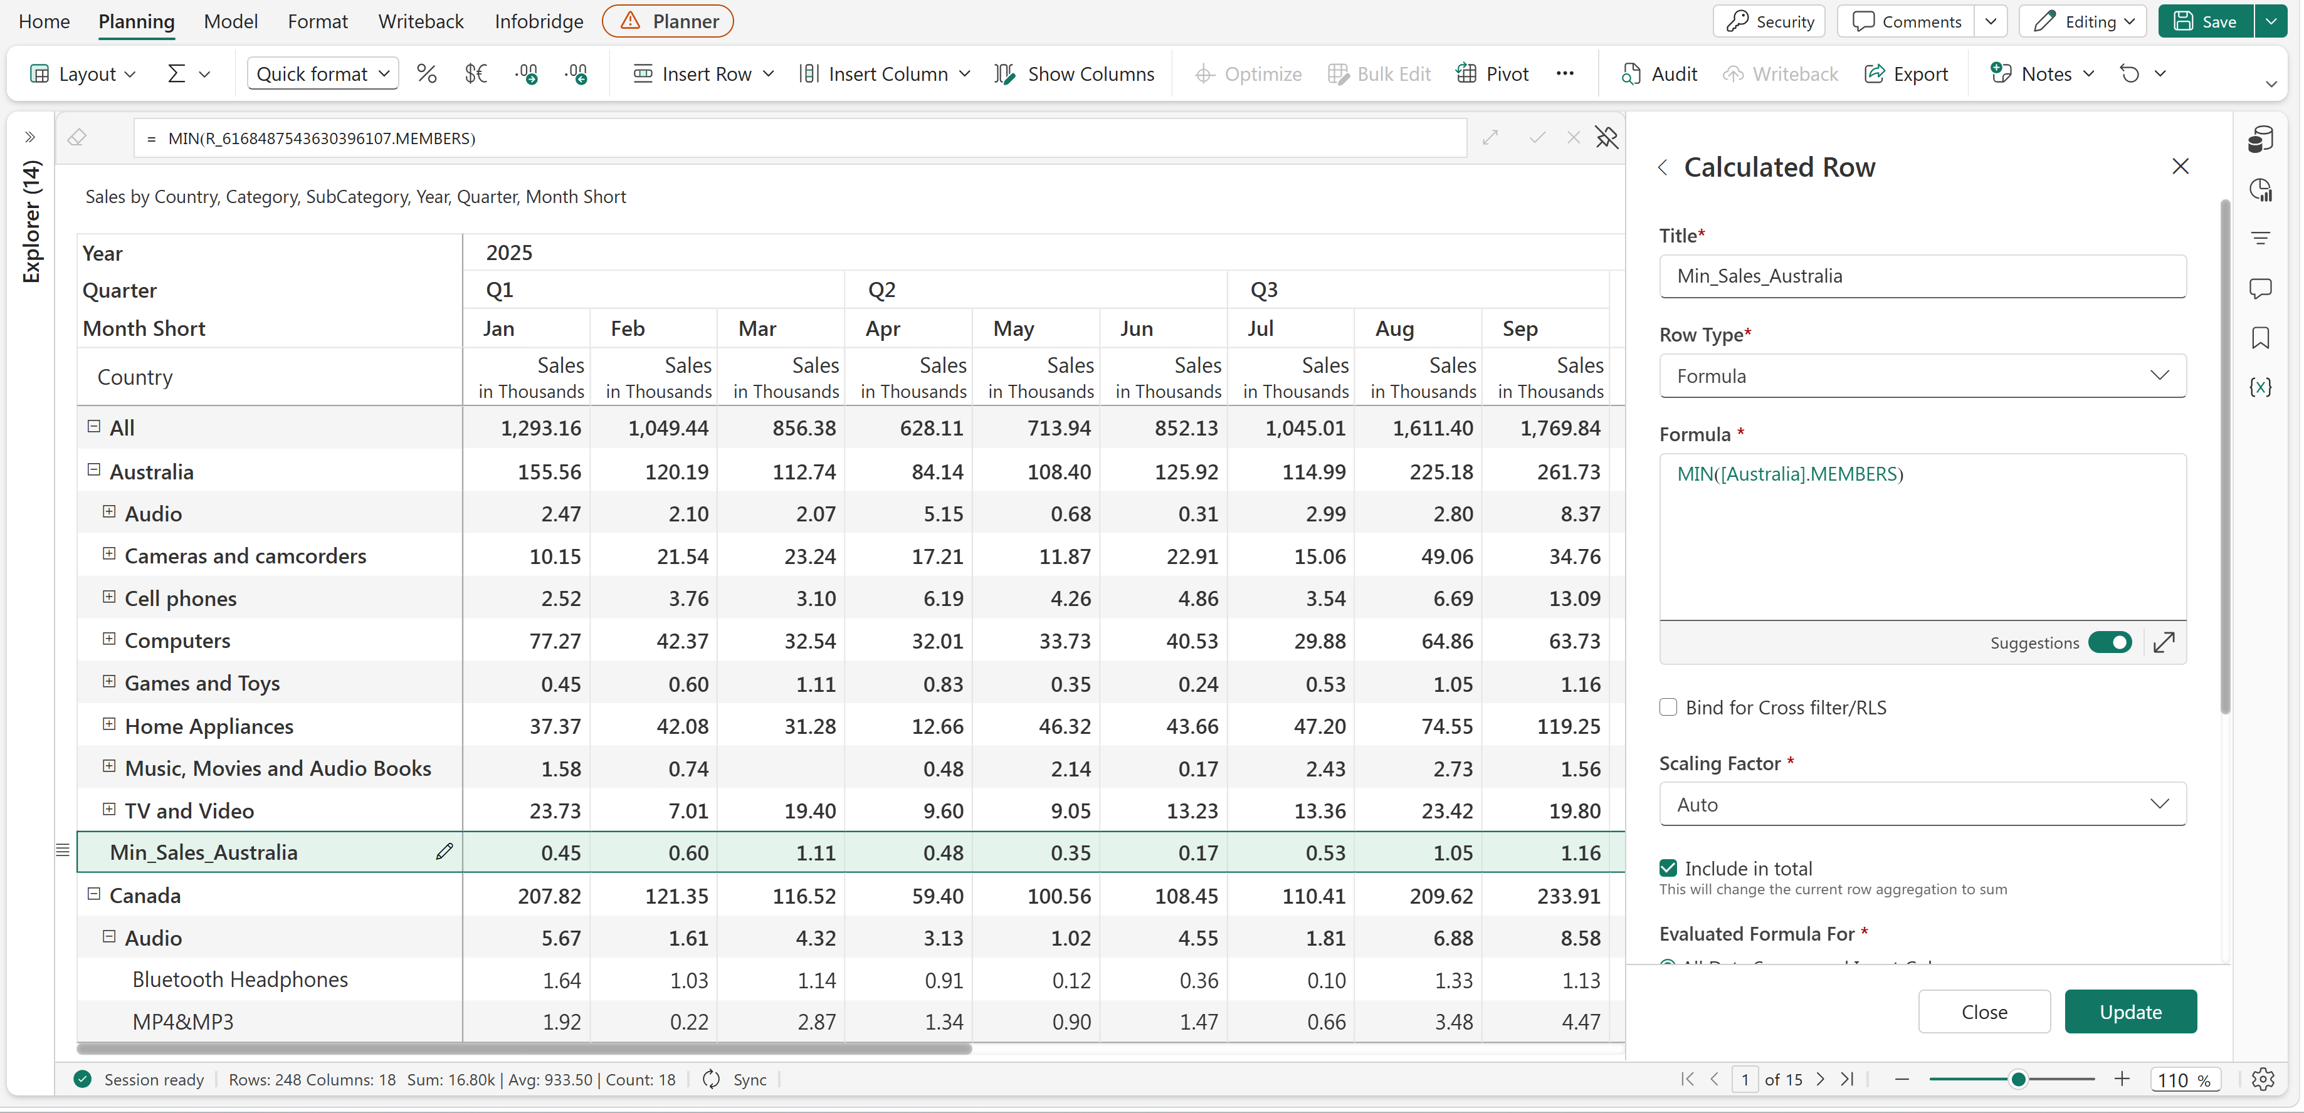
Example
MIN([Australia].MEMBERS)
In this example, the formula returns the minimum value among the immediate child members of Australia. The immediate child members are the product categories under Australia, and the calculated row displays the minimum sales value for each month across those categories.
MINDATE
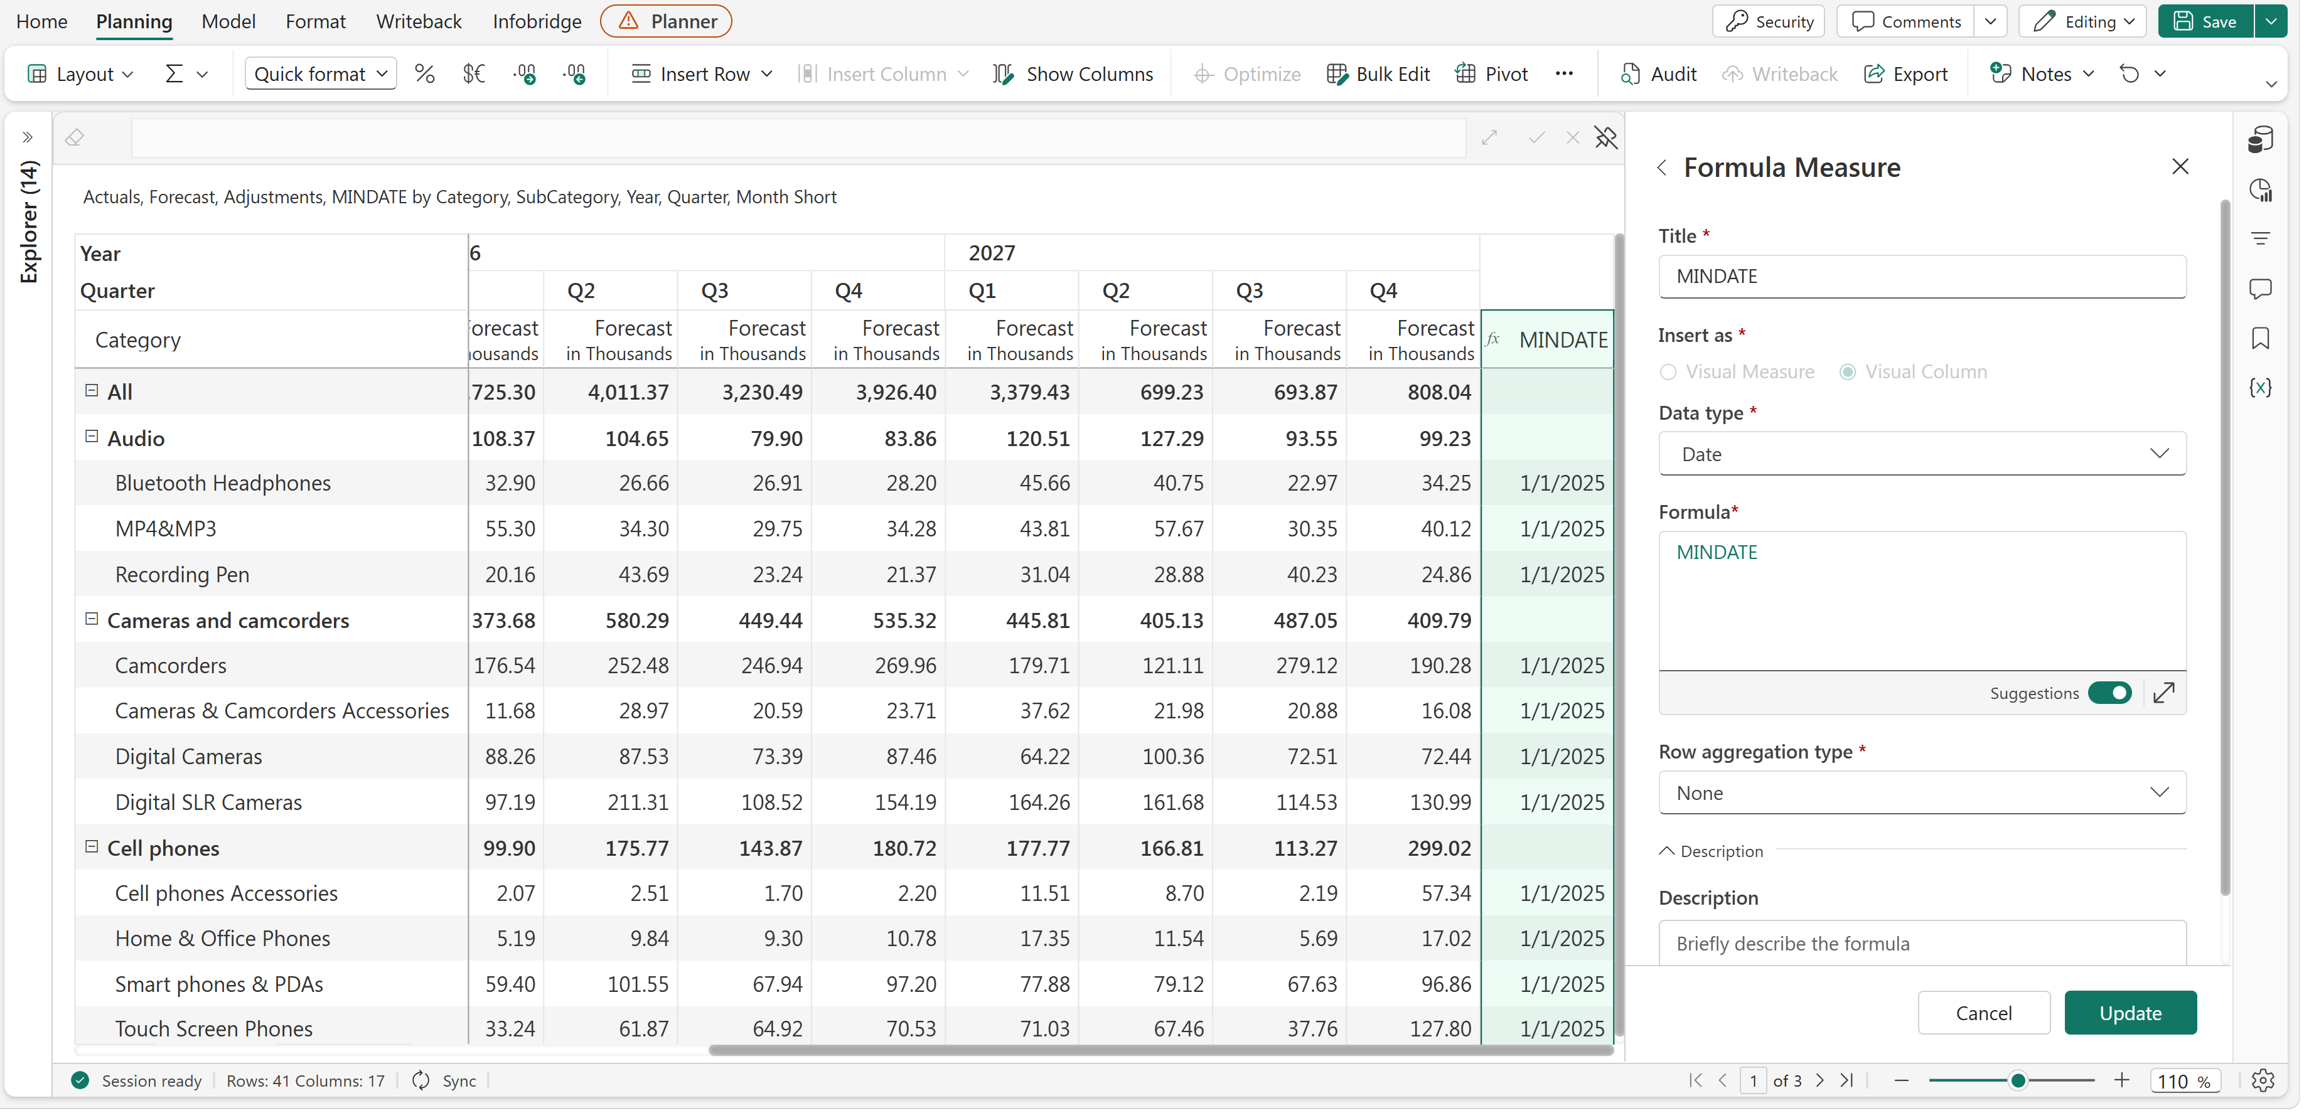
The MINDATE identifier returns the earliest date available in the column header.
Syntax
MINDATE
Example
MINDATE
In this example, the report contains Actuals data from 2025 and forecast data through 2027, so the MINDATE identifier returns 1/1/2025 for every row.
RELATIVE
The RELATIVE identifier converts an absolute cell or column reference into a relative reference.
Syntax
Cell reference
RELATIVE(cell_reference)
Column reference
[column].RELATIVE(offset)
Arguments
Cell reference
cell_reference: The cell reference to convert to a relative reference.
Column reference
column: The column reference.offset: The relative position of the target column. Use a negative value to reference a previous column and a positive value to reference a subsequent column.
Return value
Returns the value from the cell or column at the relative position.
Note
Relative references are resolved based on the original report layout. If you reorder columns, the calculation continues to use the original column positions. Relative column references are supported only for visual measures.
Examples
Cell reference
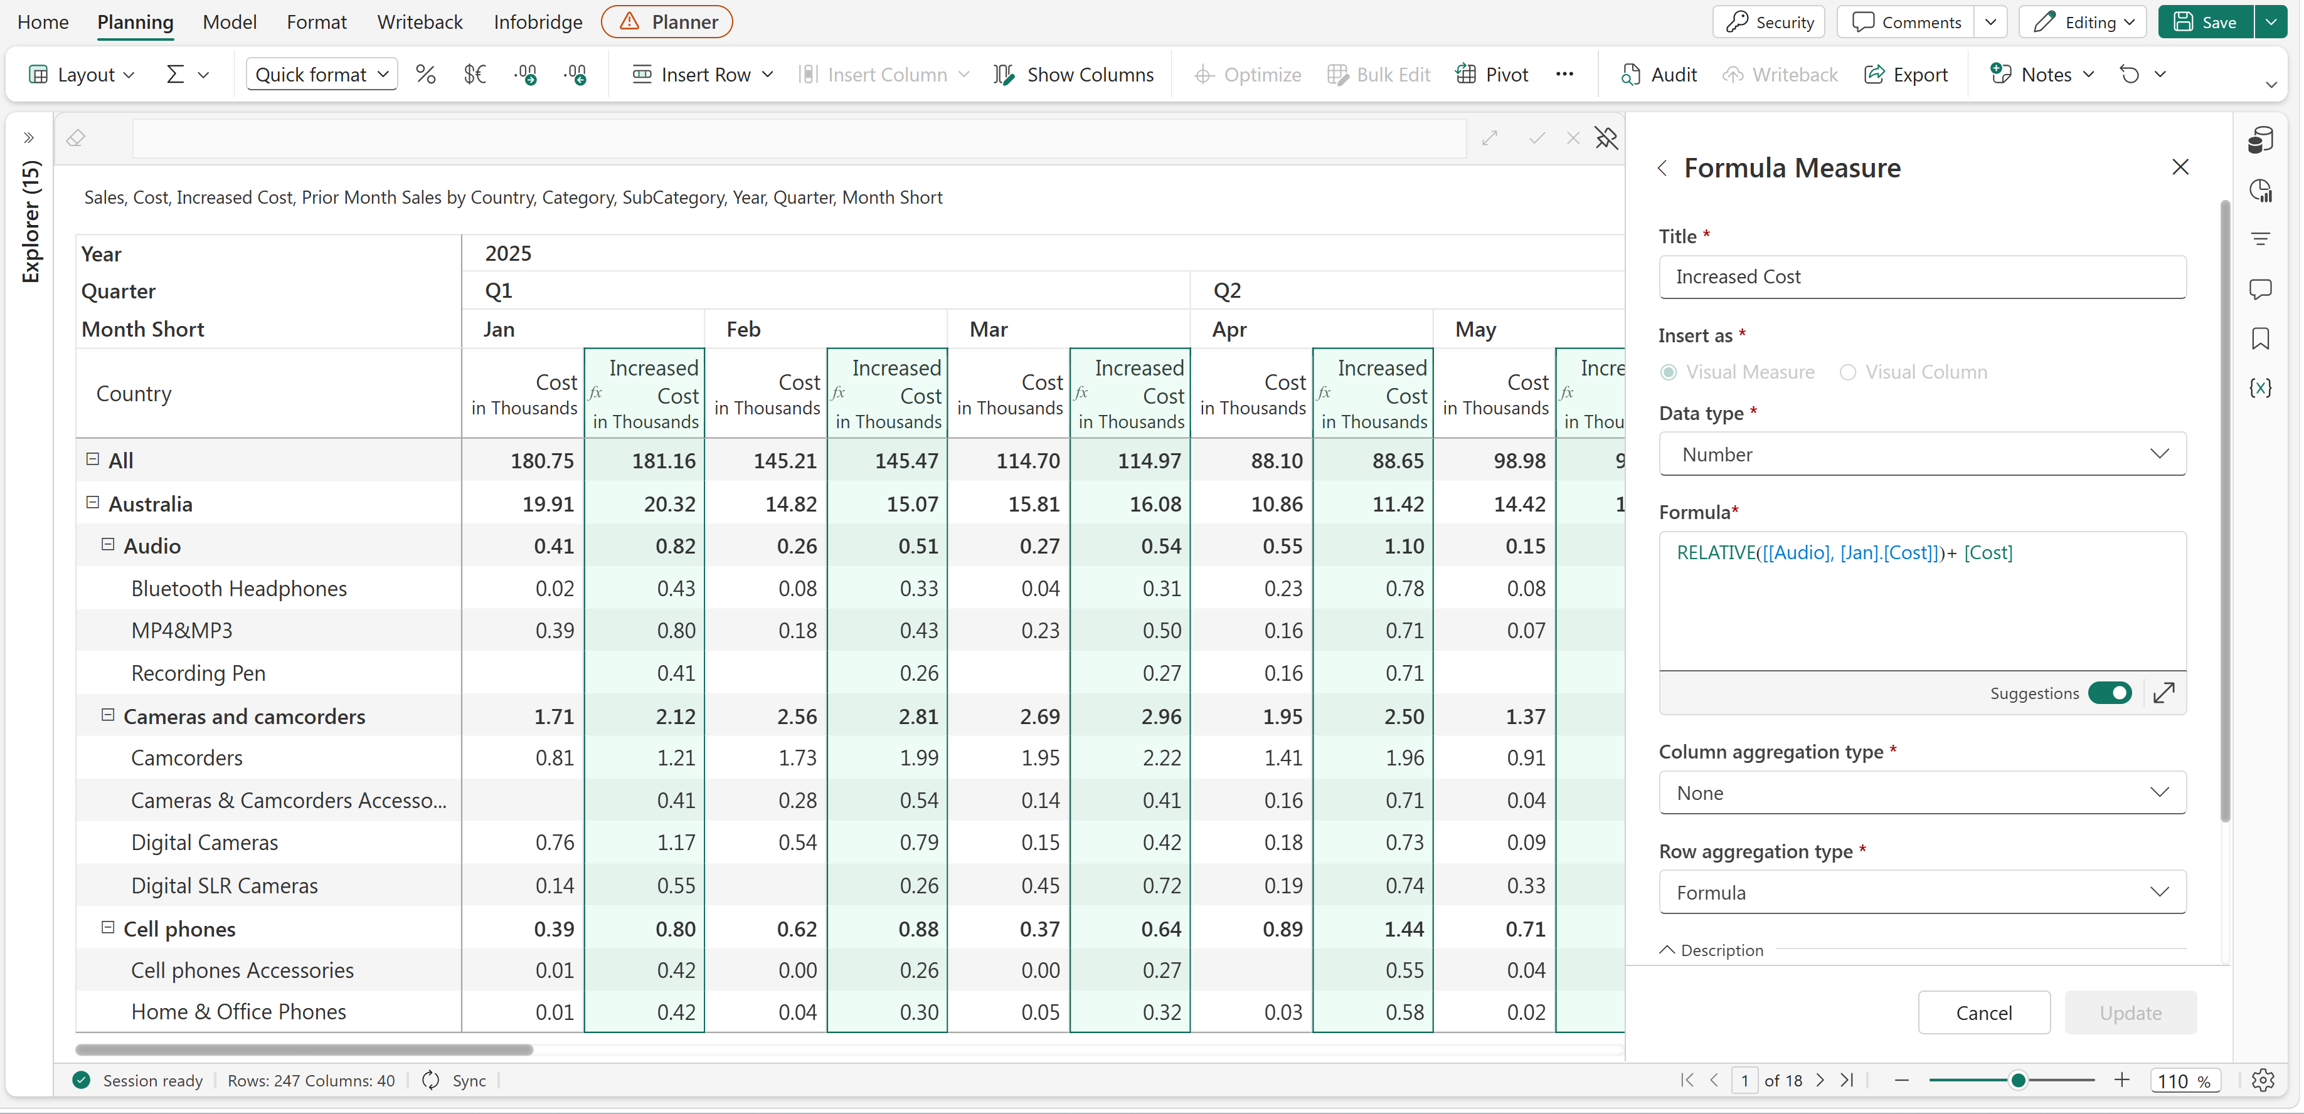
RELATIVE([[Audio], [Jan].[Cost]]) + [Cost]
This formula converts the absolute reference to the January Cost value for Audio into a relative reference. Although the formula references January, it automatically retrieves the corresponding month's Audio Cost for each column and adds it to the current row's Cost value.
For example, in the April column, the formula adds April Audio Cost to the current Cost value. Likewise, in the January column, it adds January Audio Cost to the current Cost value.
Column reference
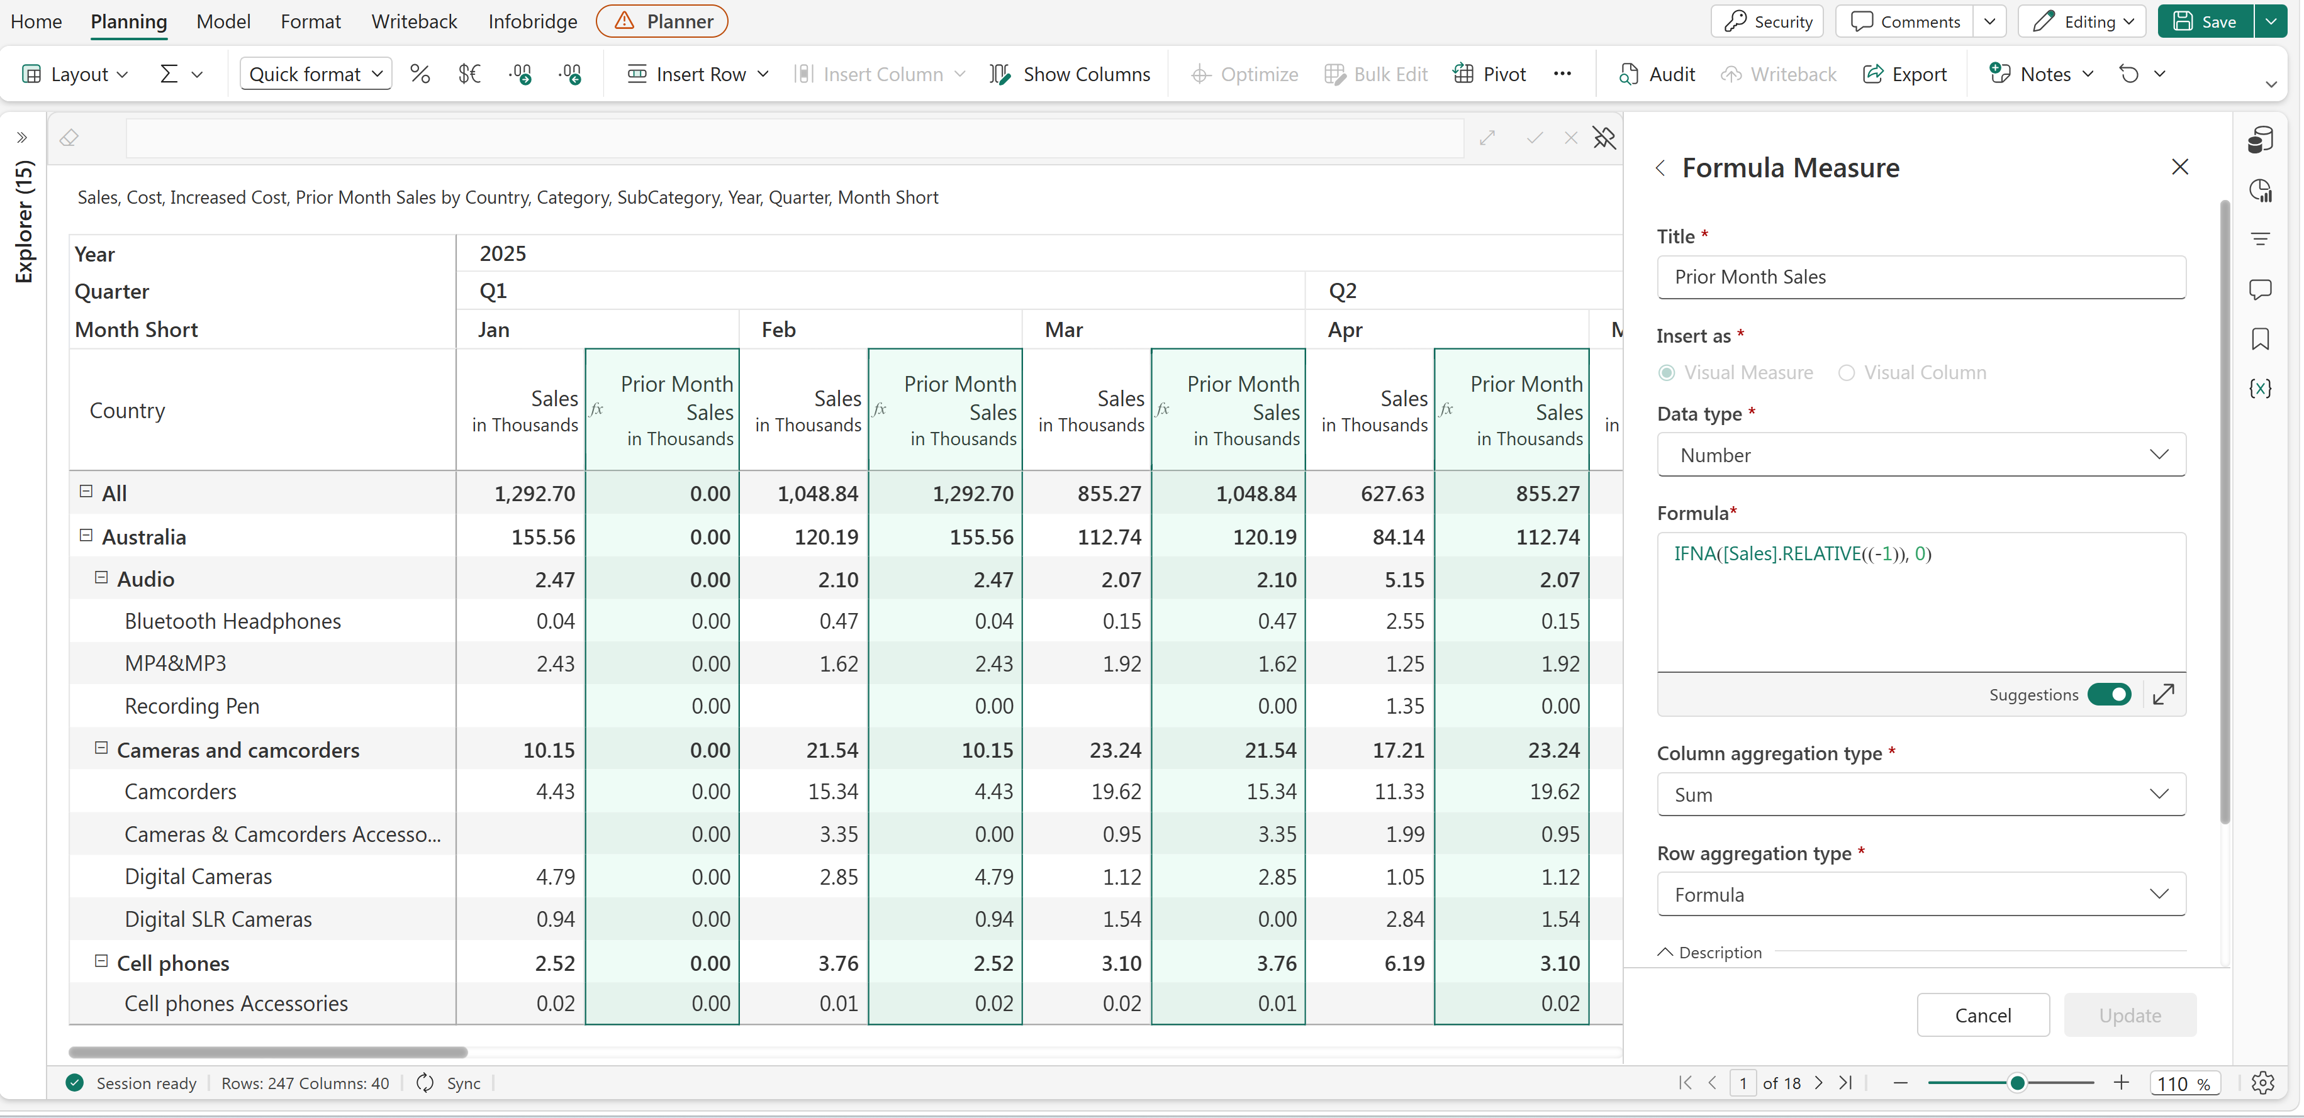
IFNA([Sales].RELATIVE(-1), 0)
This formula returns the value from the previous Sales column. Since January has no preceding month, IFNA returns 0. For all subsequent months, the formula returns the Sales value from the previous month, which you can use to calculate month-over-month variance.
RELATIVE_COLUMN
The RELATIVE_COLUMN identifier returns the value from a column relative to the current column. Use it to retrieve values from previous columns in a report.
Syntax
[Row].RELATIVE_COLUMN(offset)
Arguments
[Row]: Reference to a row.offset: The number of columns relative to the current column. Use a negative value to reference a previous column.
Return value
Returns the value from the relative column for the specified row.
Example
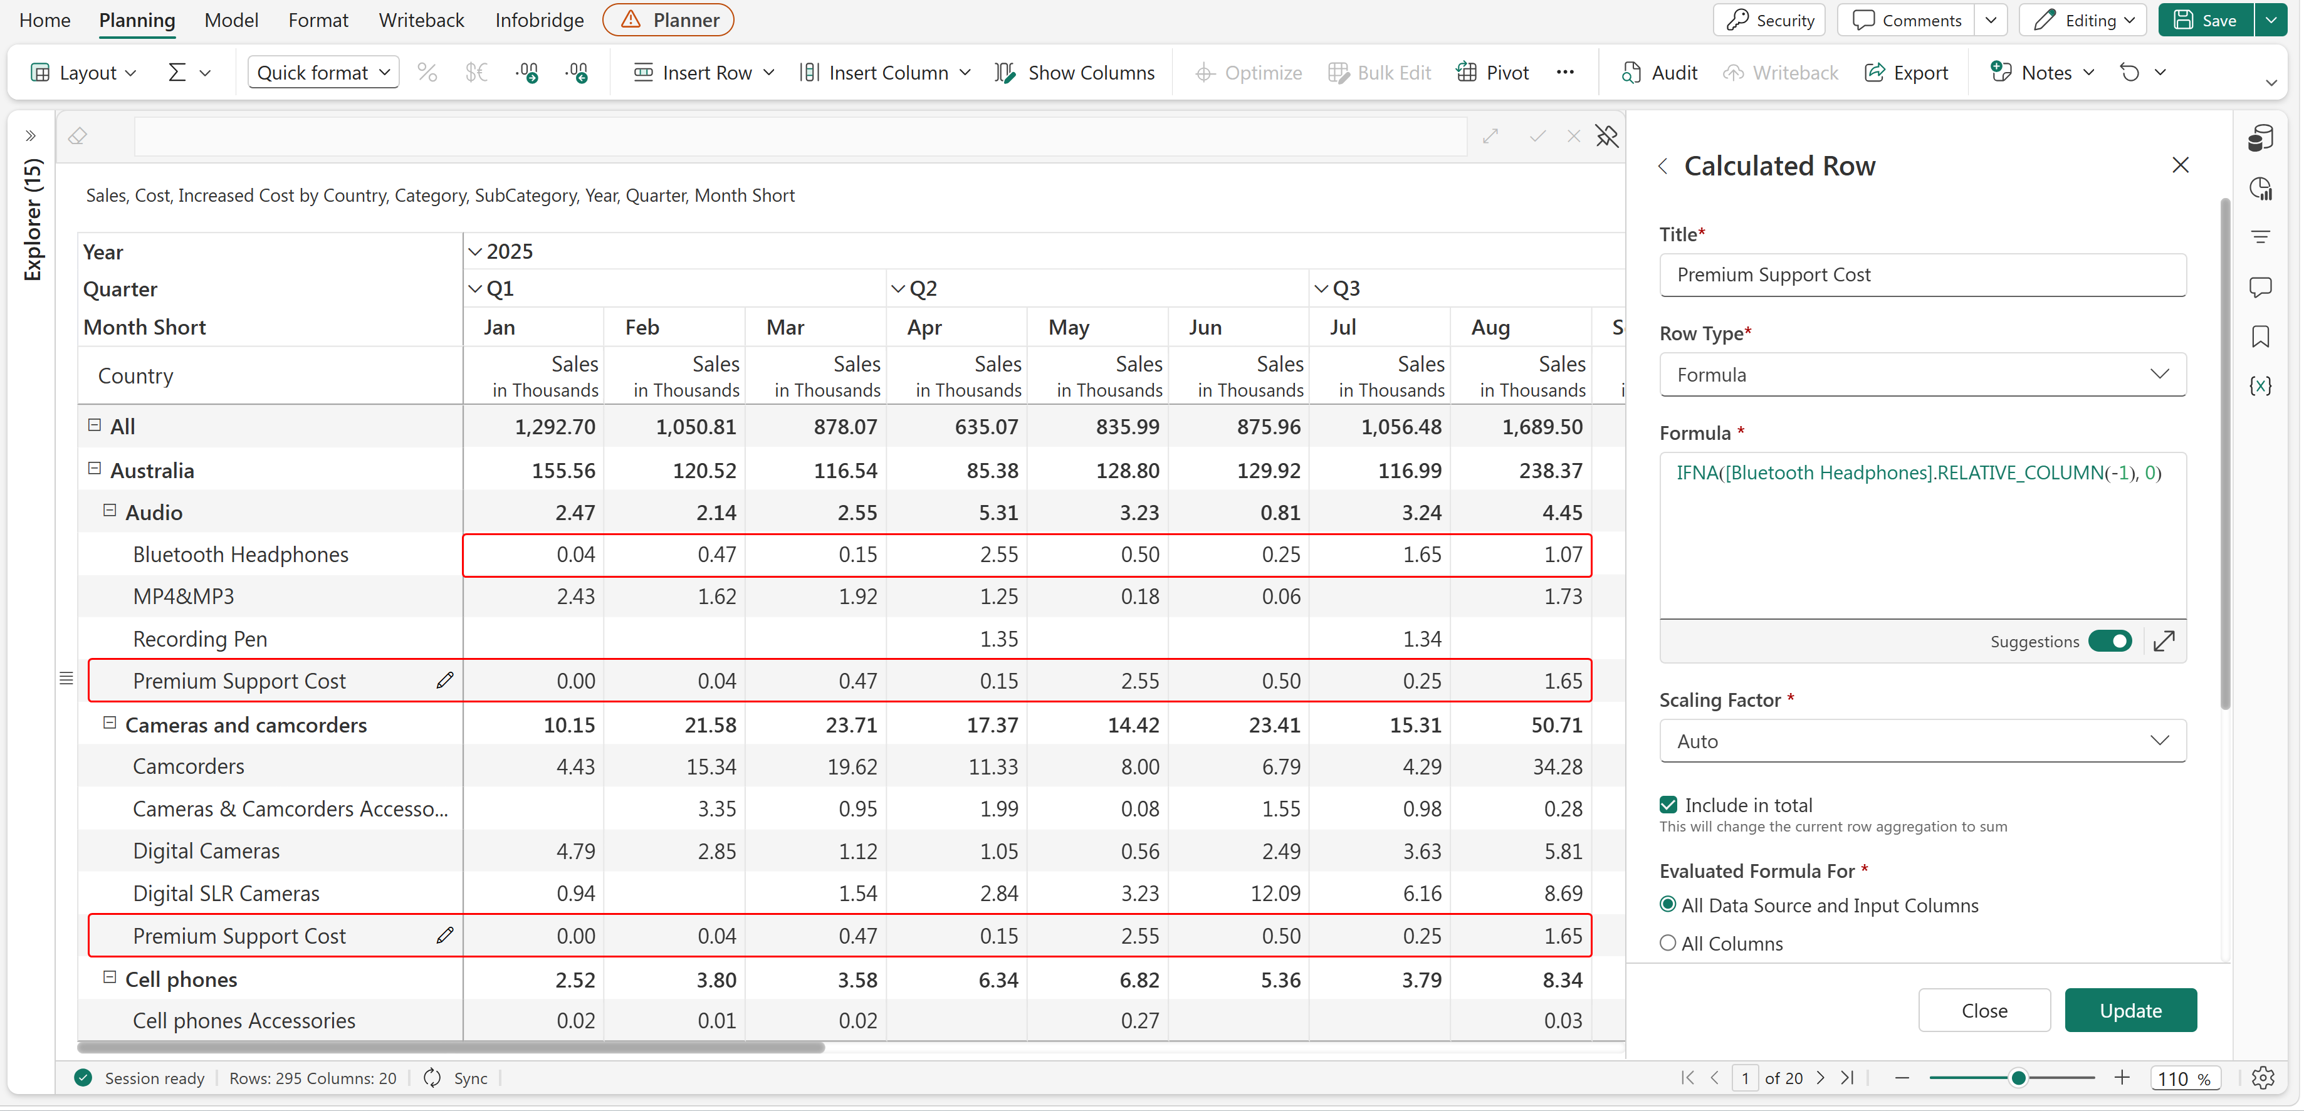
IFNA([Bluetooth Headphones].RELATIVE_COLUMN(-1), 0)
The following example creates a Premium Support Cost calculated row that displays the previous month's Bluetooth Headphones value for each month. Since the formula uses RELATIVE_COLUMN(-1), each month's value is copied from the immediately preceding month. IFNA returns 0 for January because there is no previous month's value available. Because the formula is added as a template row, the Premium Support Cost row is automatically inserted under every category in the row hierarchy.
ROW.LEVEL
The ROW.LEVEL identifier returns the level of the current row in a row hierarchy. It can be used to identify the hierarchy level of each row and apply calculations or formatting based on the row position.
Syntax
ROW.LEVEL
Example
ROW.LEVEL
In this example, the row hierarchy contains All, Country/Region, Category, and Subcategory levels. The identifier returns a numeric value representing the current row level. For example:
- All returns
1. - Country/Region returns
2. - Category returns
3. - Subcategory returns
4.
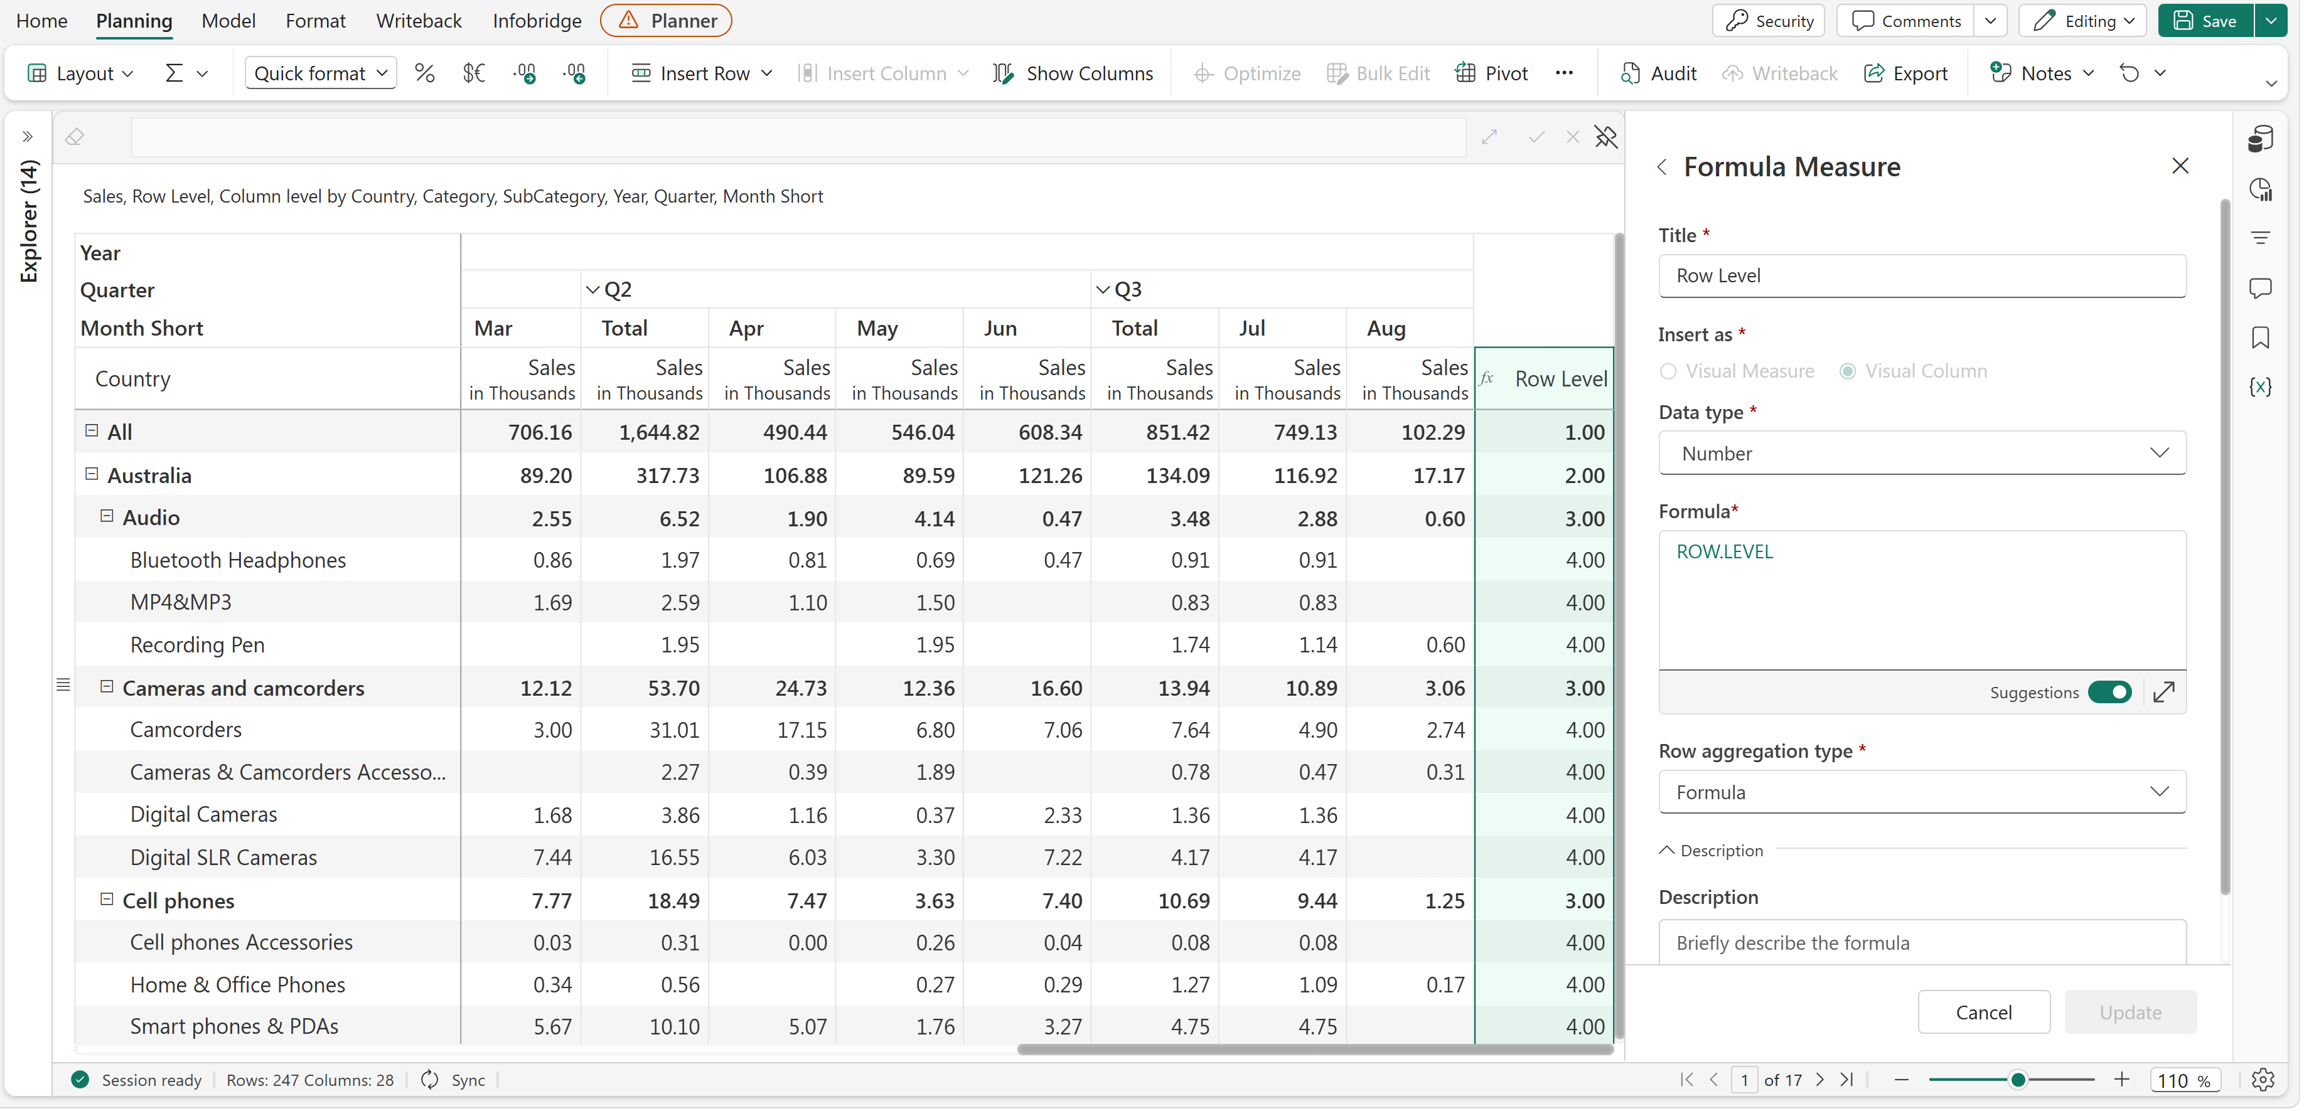
You can use the returned level in conditional formulas to apply different calculations or formatting for each hierarchy level.
ROW.PARENT
The ROW.PARENT identifier returns the parent row of the current row. You can chain the identifier to refer to higher levels in the hierarchy, such as the grandparent using ROW.PARENT.PARENT.
Syntax
ROW.PARENT
Example
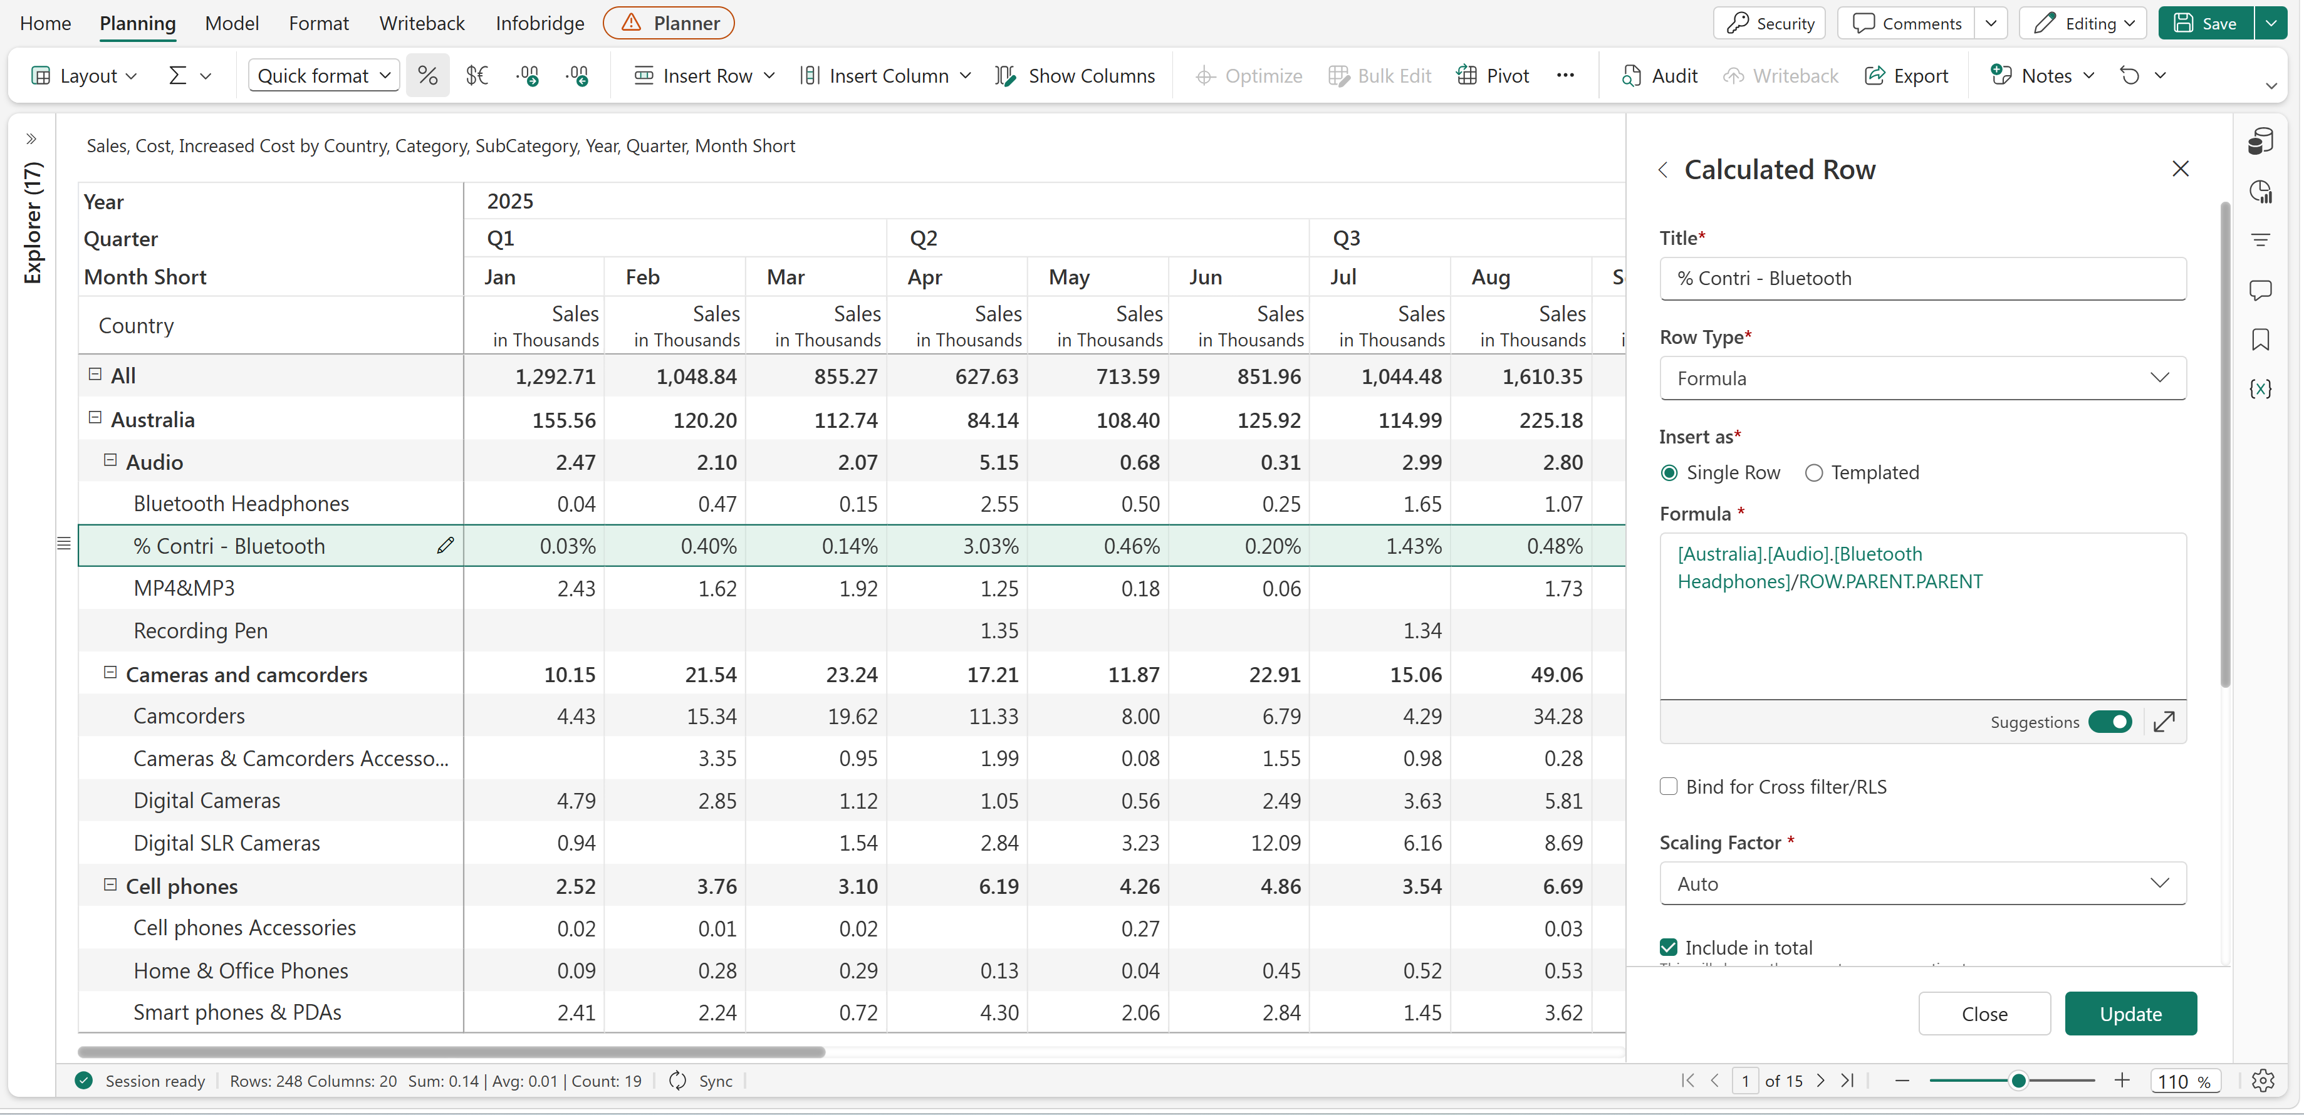
[Australia].[Audio].[Bluetooth Headphones] / ROW.PARENT.PARENT
In this example, the calculated row is inserted below Bluetooth Headphones. The ROW.PARENT.PARENT identifier refers to the Australia row, which is the grandparent of the current row. The formula divides the Bluetooth Headphones sales by the corresponding Australia sales to calculate its percentage contribution.
For January, the Bluetooth Headphones sales are 0.04, Australia sales are 155.56, and the resulting contribution is 0.03%.
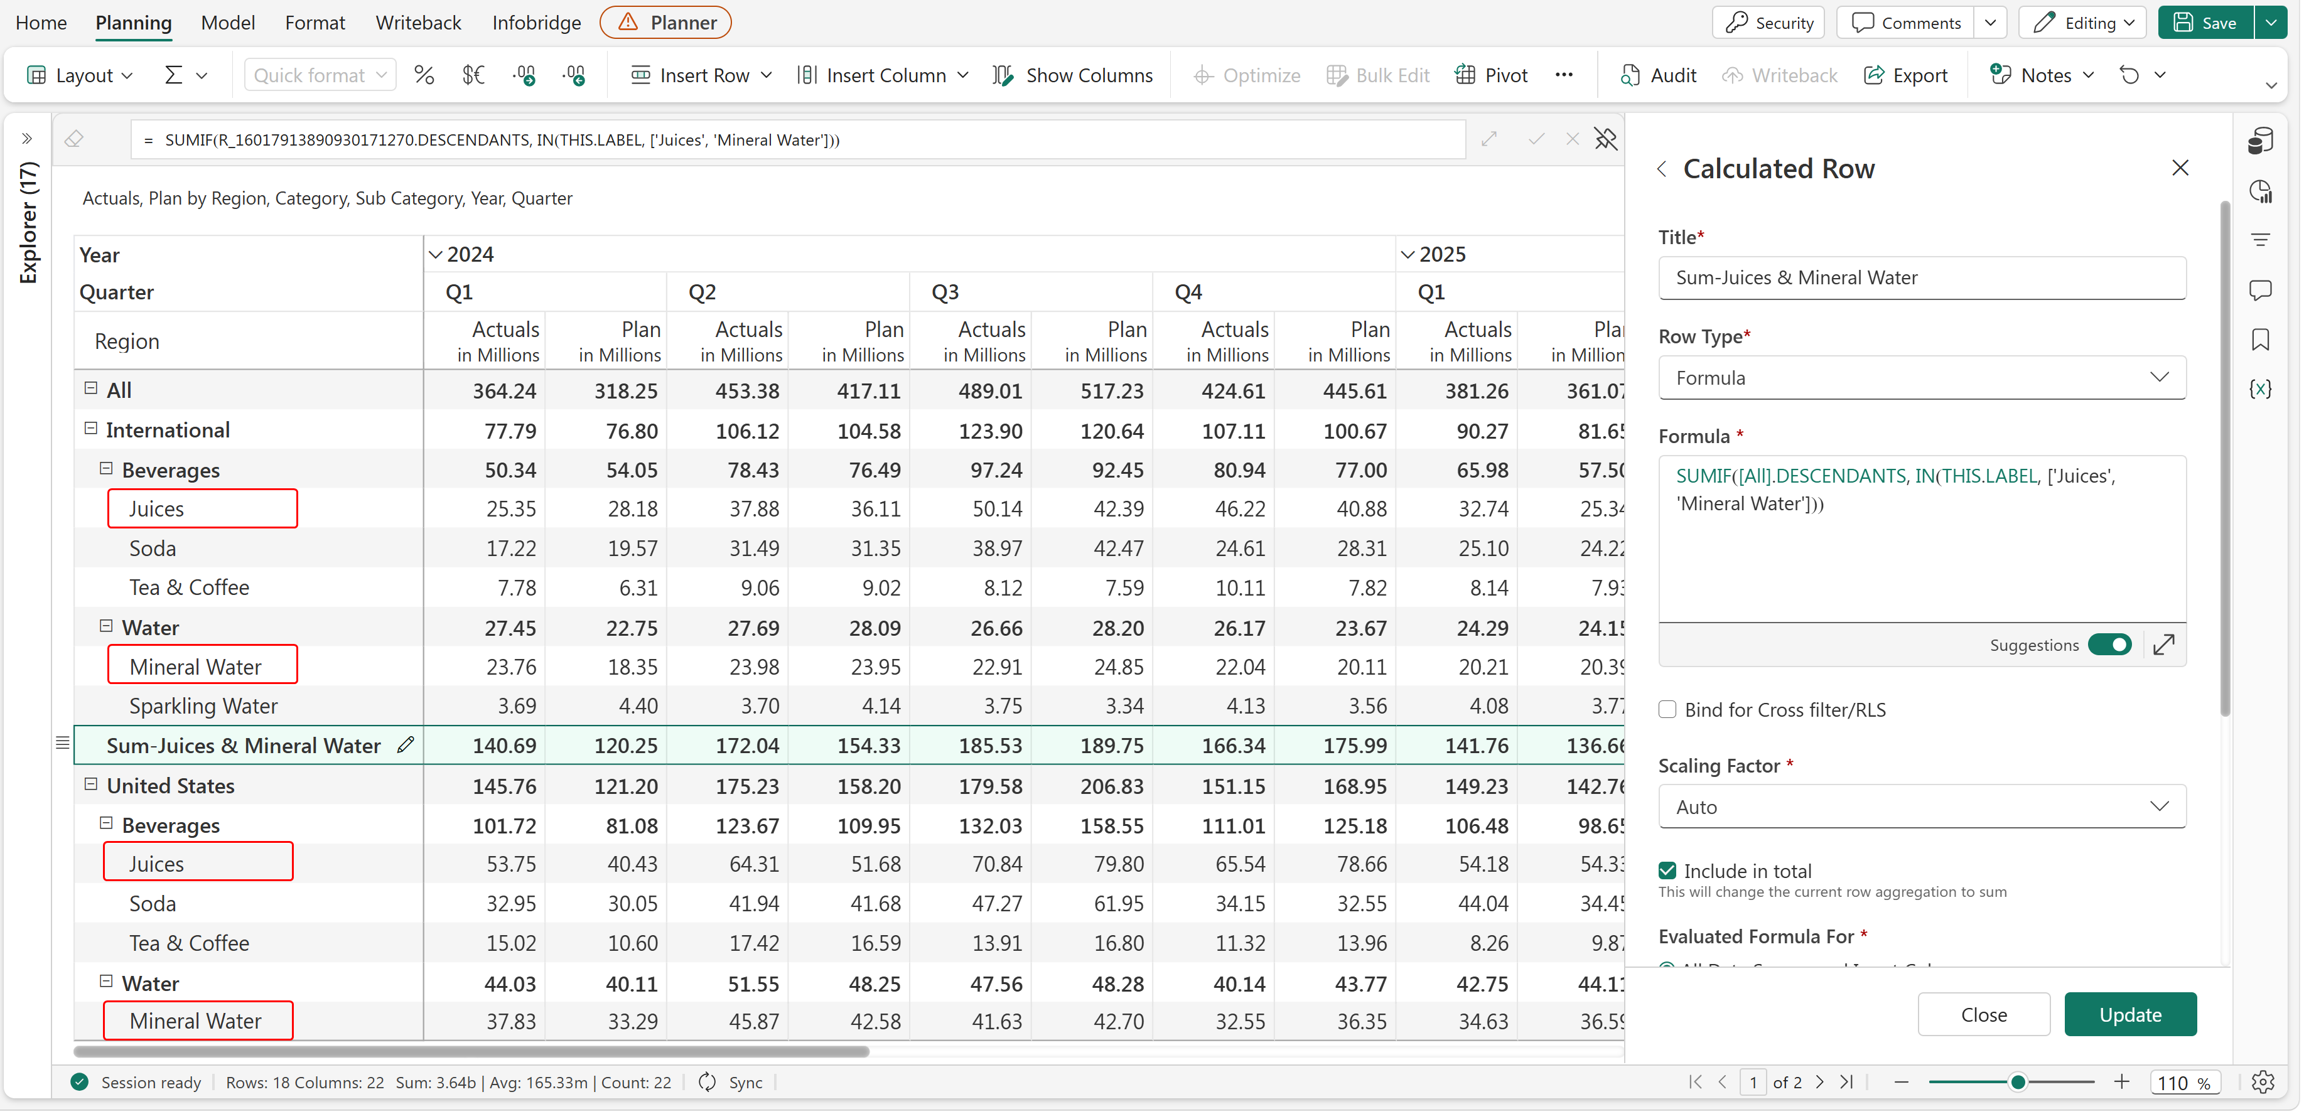
THIS.LABEL
The THIS.LABEL identifier returns the labels of the current row hierarchy. When the report contains multiple hierarchy levels, use THIS.LABEL to access the label at each level and perform conditional calculations based on row names.
Syntax
THIS.LABEL
Example
SUMIF([All].DESCENDANTS, IN(THIS.LABEL, ['Juices', 'Mineral Water']))
In this example, use THIS.LABEL with the IN function to identify the rows whose labels are Juices or Mineral Water. The SUMIF function then evaluates only the matching rows from the descendants of the All member and returns the combined value for those rows. This approach enables you to perform calculations based on row labels instead of explicitly referencing individual row members.