Note
Access to this page requires authorization. You can try signing in or changing directories.
Access to this page requires authorization. You can try changing directories.
Aggregation and statistical functions let you summarize, evaluate, and analyze numerical data in reports. These functions are commonly used to calculate averages, counts, minimum and maximum values, rankings, and sorted results.
In planning, aggregation and statistical functions help you create calculations for scenarios such as performance analysis, trend evaluation, ranking comparisons, and statistical reporting.
AVERAGE
The AVERAGE function returns the average (arithmetic mean) of a set of values by adding all the numbers together and dividing the result by the total count of values. The arguments can be numeric values or references. This function is commonly used to analyze trends, compare performance, and summarize datasets by providing a representative value.
Syntax
AVERAGE(value1, [value2], ...)
Arguments
value1: The first number or reference to average.value2, ...(optional): Additional numbers or references to average.
Return value
Returns the arithmetic mean of the specified values.
Example
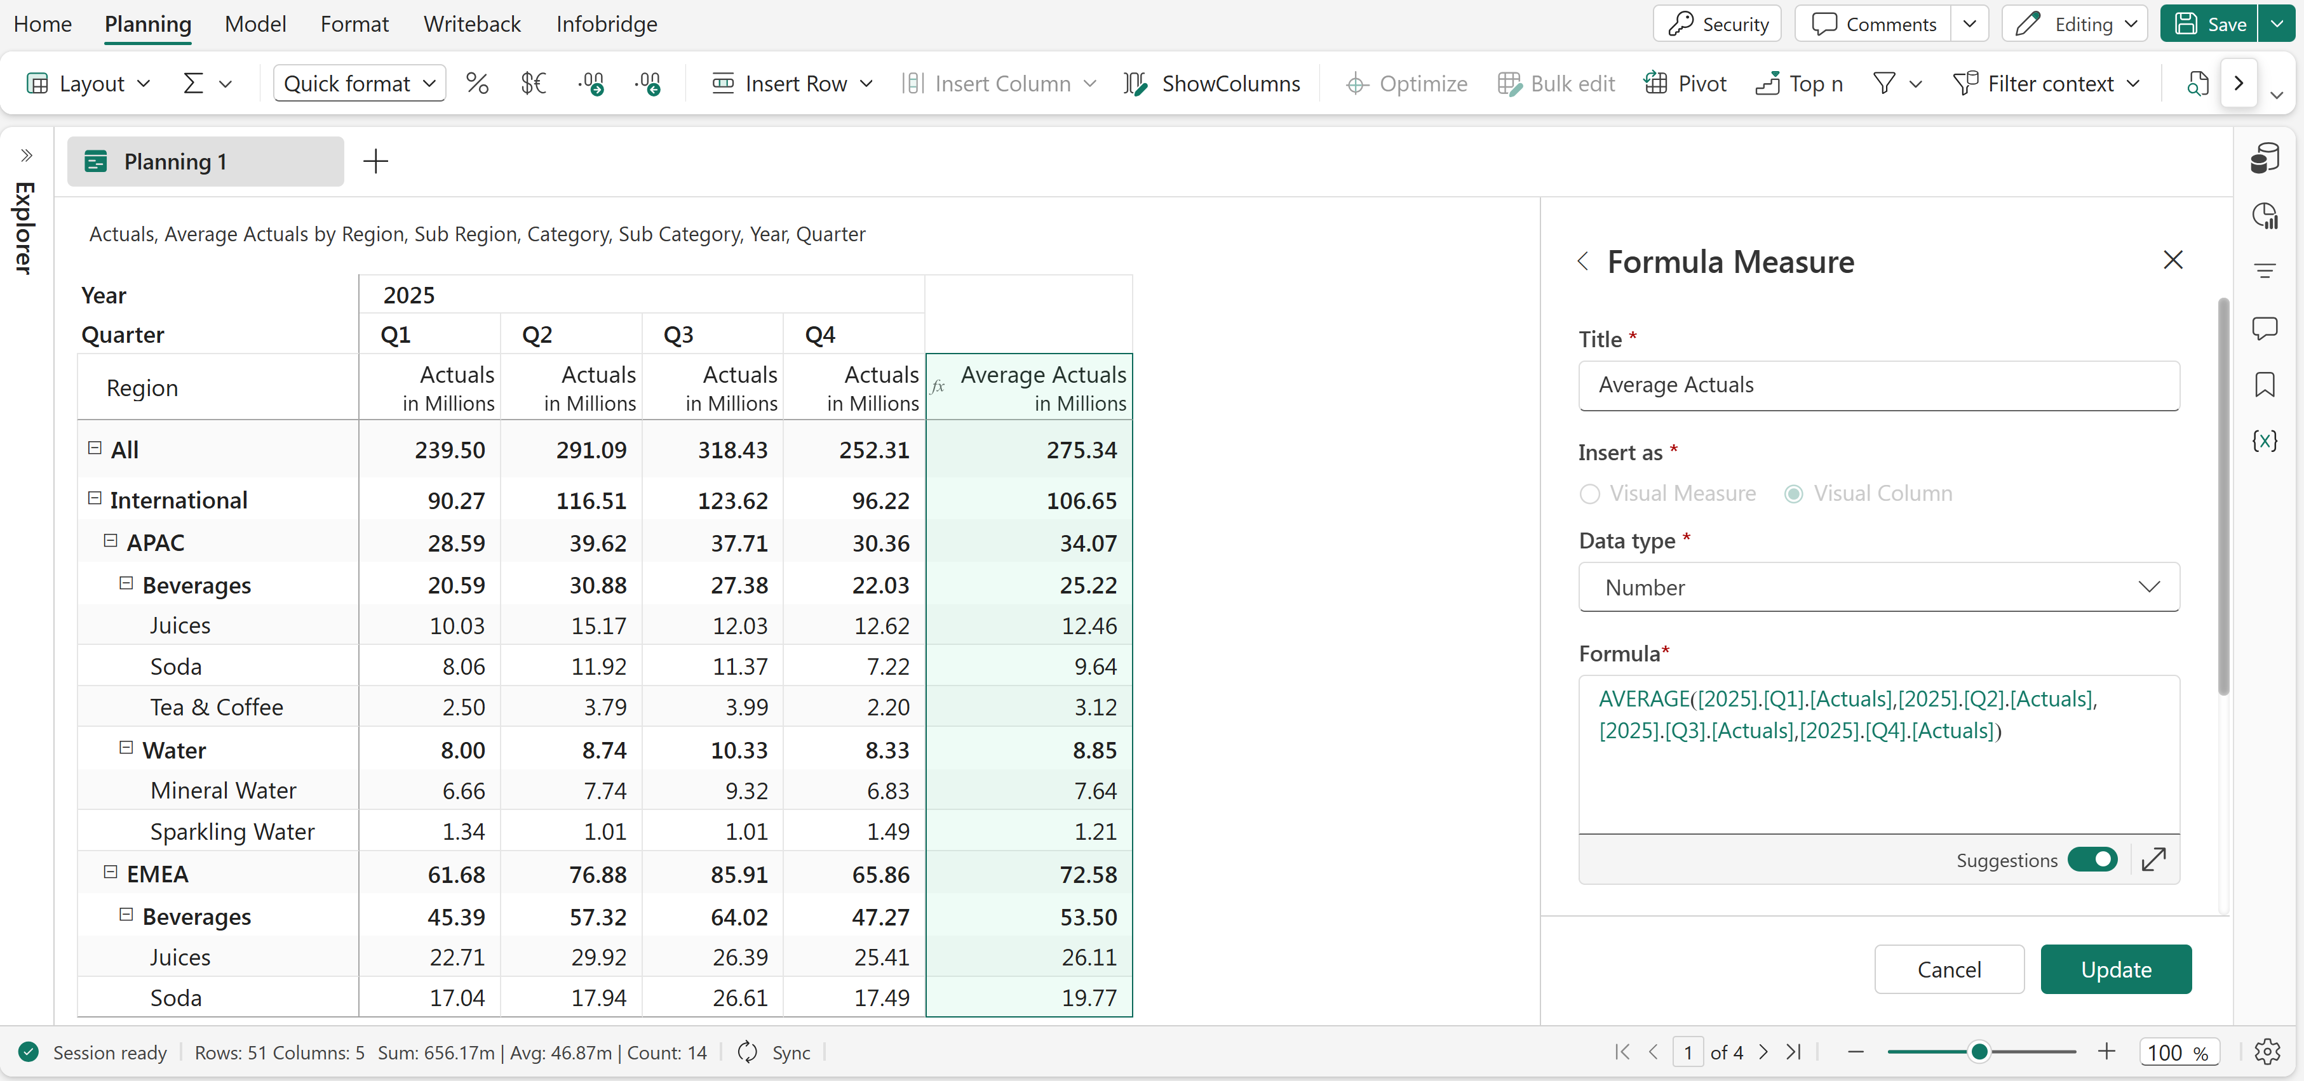
AVERAGE(2025.Q1.Actuals, 2025.Q2.Actuals, 2025.Q3.Actuals, 2025.Q4.Actuals)
In this example, the Average Actuals measure is created using the AVERAGE function. It returns the average of the Actuals across the four quarters of 2025.
Excel equivalent
AVERAGEEXNEG
The AVERAGEEXNEG function returns the average (arithmetic mean) of a set of values while excluding negative numbers from the calculation. The arguments can be numeric values or references. This function is commonly used when negative values shouldn't affect the overall average, such as in performance metrics, financial analyses, or data quality evaluations.
Syntax
AVERAGEEXNEG(value1, [value2], ...)
Arguments
value1: The first number or reference to average.value2, ...(optional): Additional numbers or references to average.
Return value
Returns the arithmetic mean of the specified values, excluding negative numbers.
Example
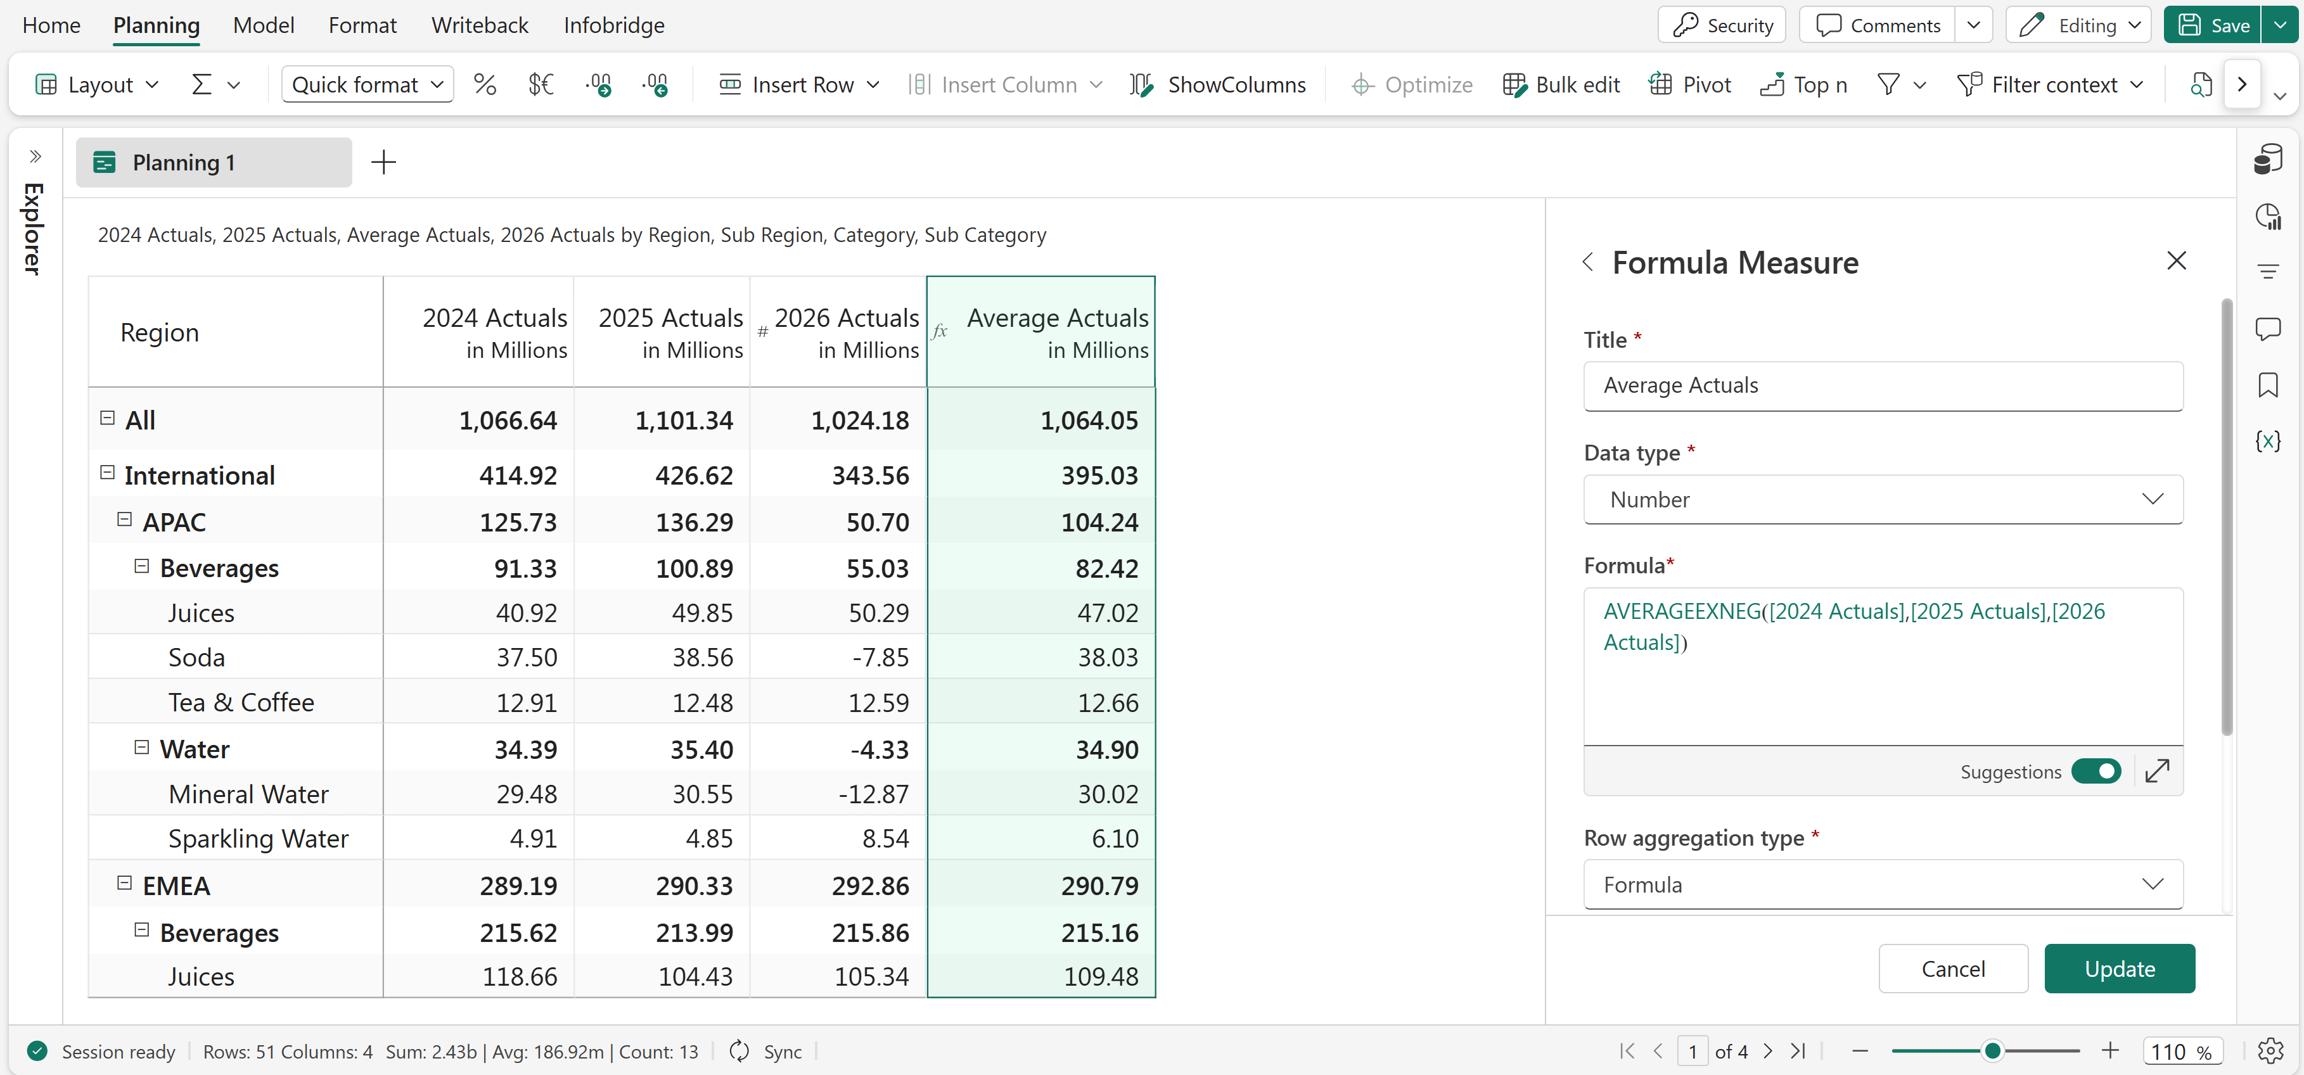
AVERAGEEXNEG(2024 Actuals, 2025 Actuals, 2026 Actuals)
In this example, the AVERAGEEXNEG function is used to calculate the average of the 2024 Actuals, 2025 Actuals, and 2026 Actuals while excluding negative values from the calculation.
Excel equivalent
AVERAGEEXZERO
The AVERAGEEXZERO function returns the average (arithmetic mean) of a set of values while excluding the zero values from the calculation. The arguments can be numeric values or references. This function is commonly used when zero values represent missing, irrelevant, or nonapplicable data and shouldn't affect the overall average.
Syntax
AVERAGEEXZERO(value1, [value2], ...)
Arguments
value1: The first number or reference to average.value2, ...(optional): Additional numbers or references to average.
Return value
Returns the arithmetic mean of the specified values excluding zeros.
Example
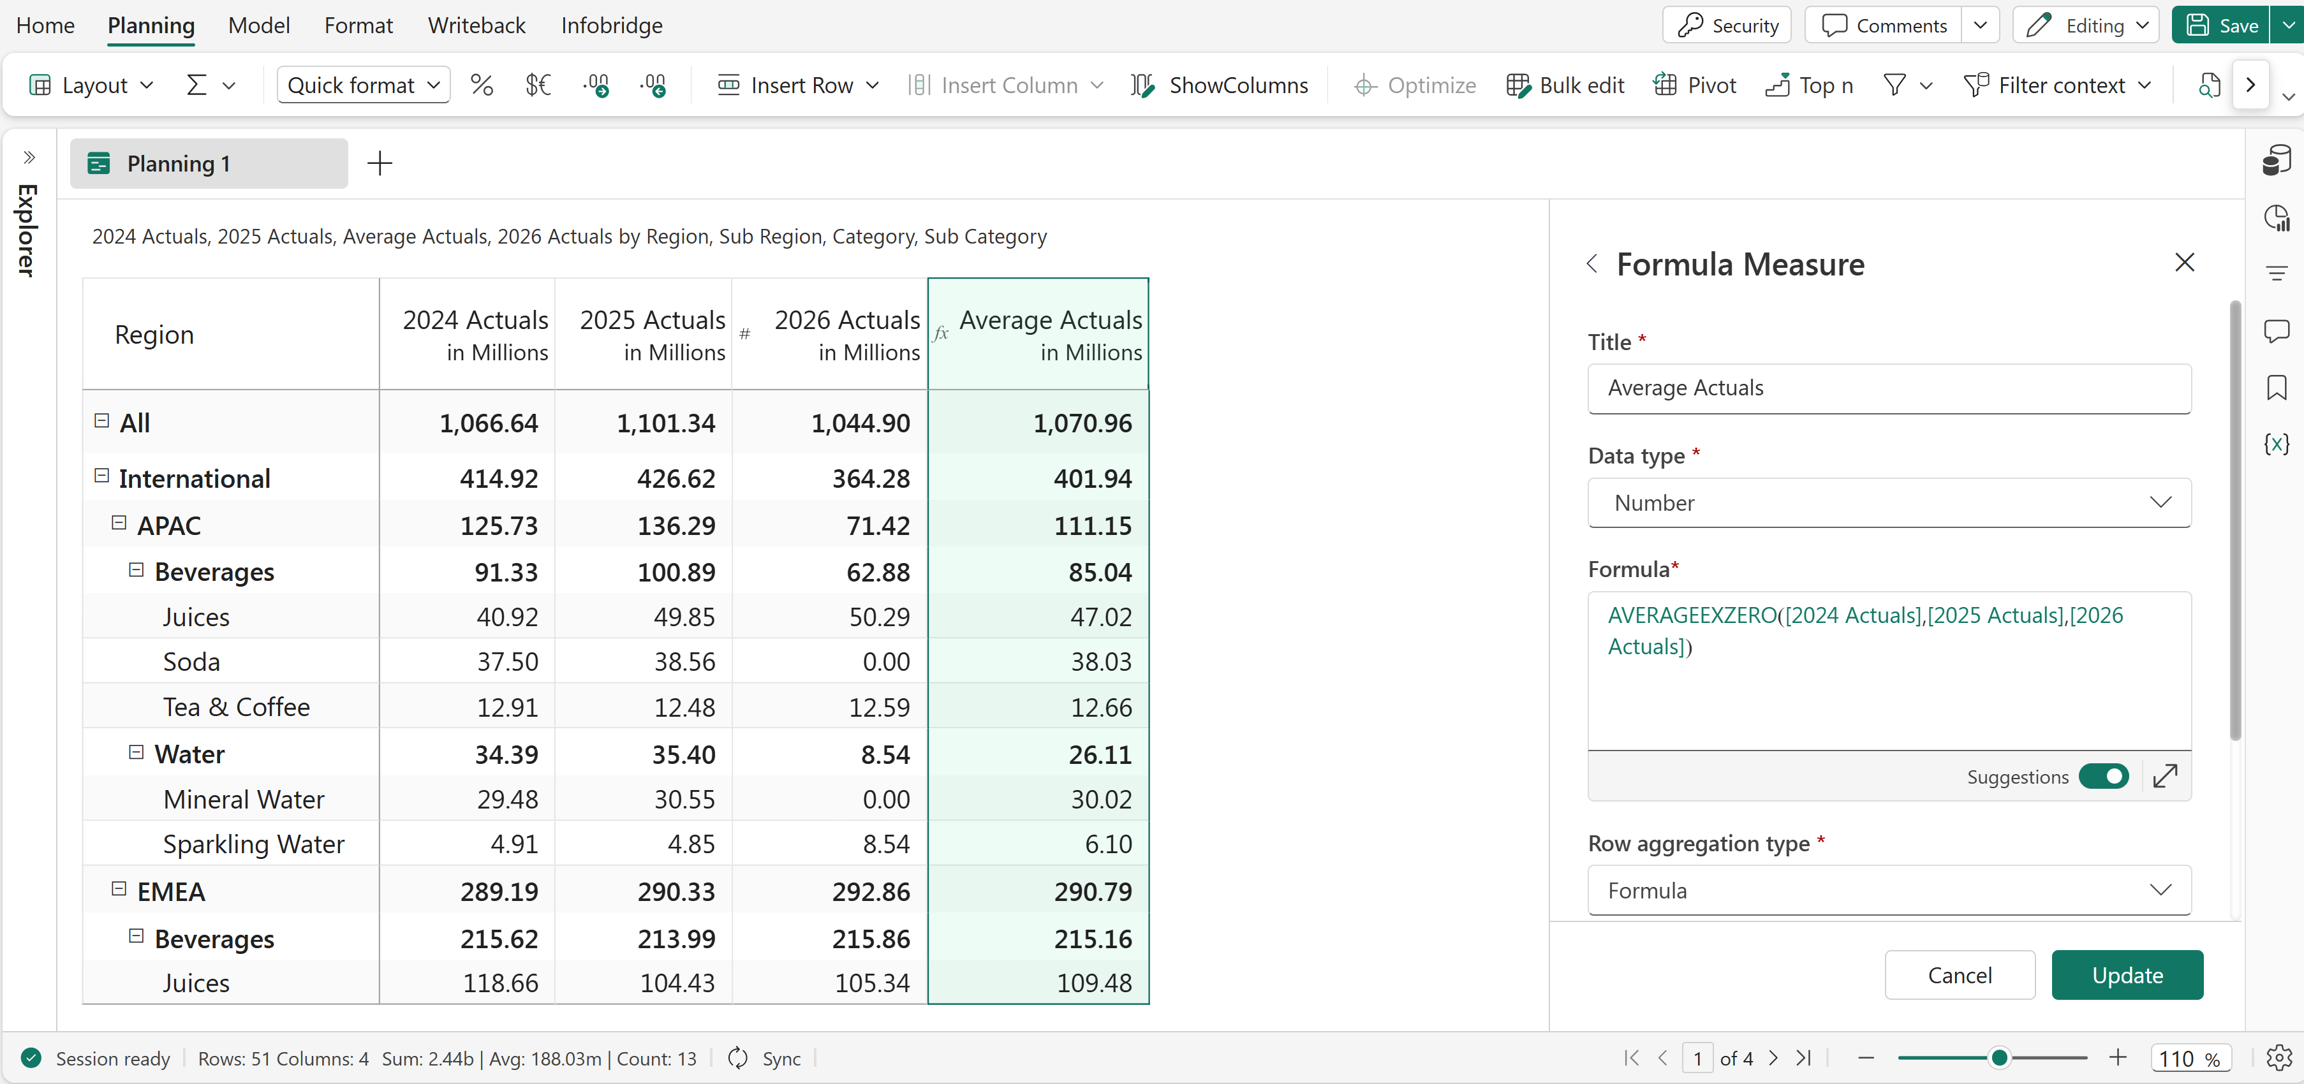
AVERAGEEXZERO(2024 Actuals, 2025 Actuals, 2026 Actuals)
In this example, the AVERAGEEXZERO function returns the average of the 2024 Actuals, 2025 Actuals, and 2026 Actuals while excluding the zero values from the calculation.
Excel equivalent
AVERAGEEXZERONEG
The AVERAGEEXZERONEG function returns the average (arithmetic mean) of a set of values while excluding both zero and negative numbers from the calculation. The arguments can be numeric values or references. This function is commonly used when only positive values should be considered, such as in performance metrics, financial analyses, or scenarios where zero and negative entries represent missing, invalid, or irrelevant data.
Syntax
AVERAGEEXZERONEG(value1, [value2], ...)
Arguments
value1: The first number or reference to average.value2, ...(optional): Additional numbers or references to average.
Return value
Returns the arithmetic mean of the specified values after excluding zeros and negative numbers.
Example
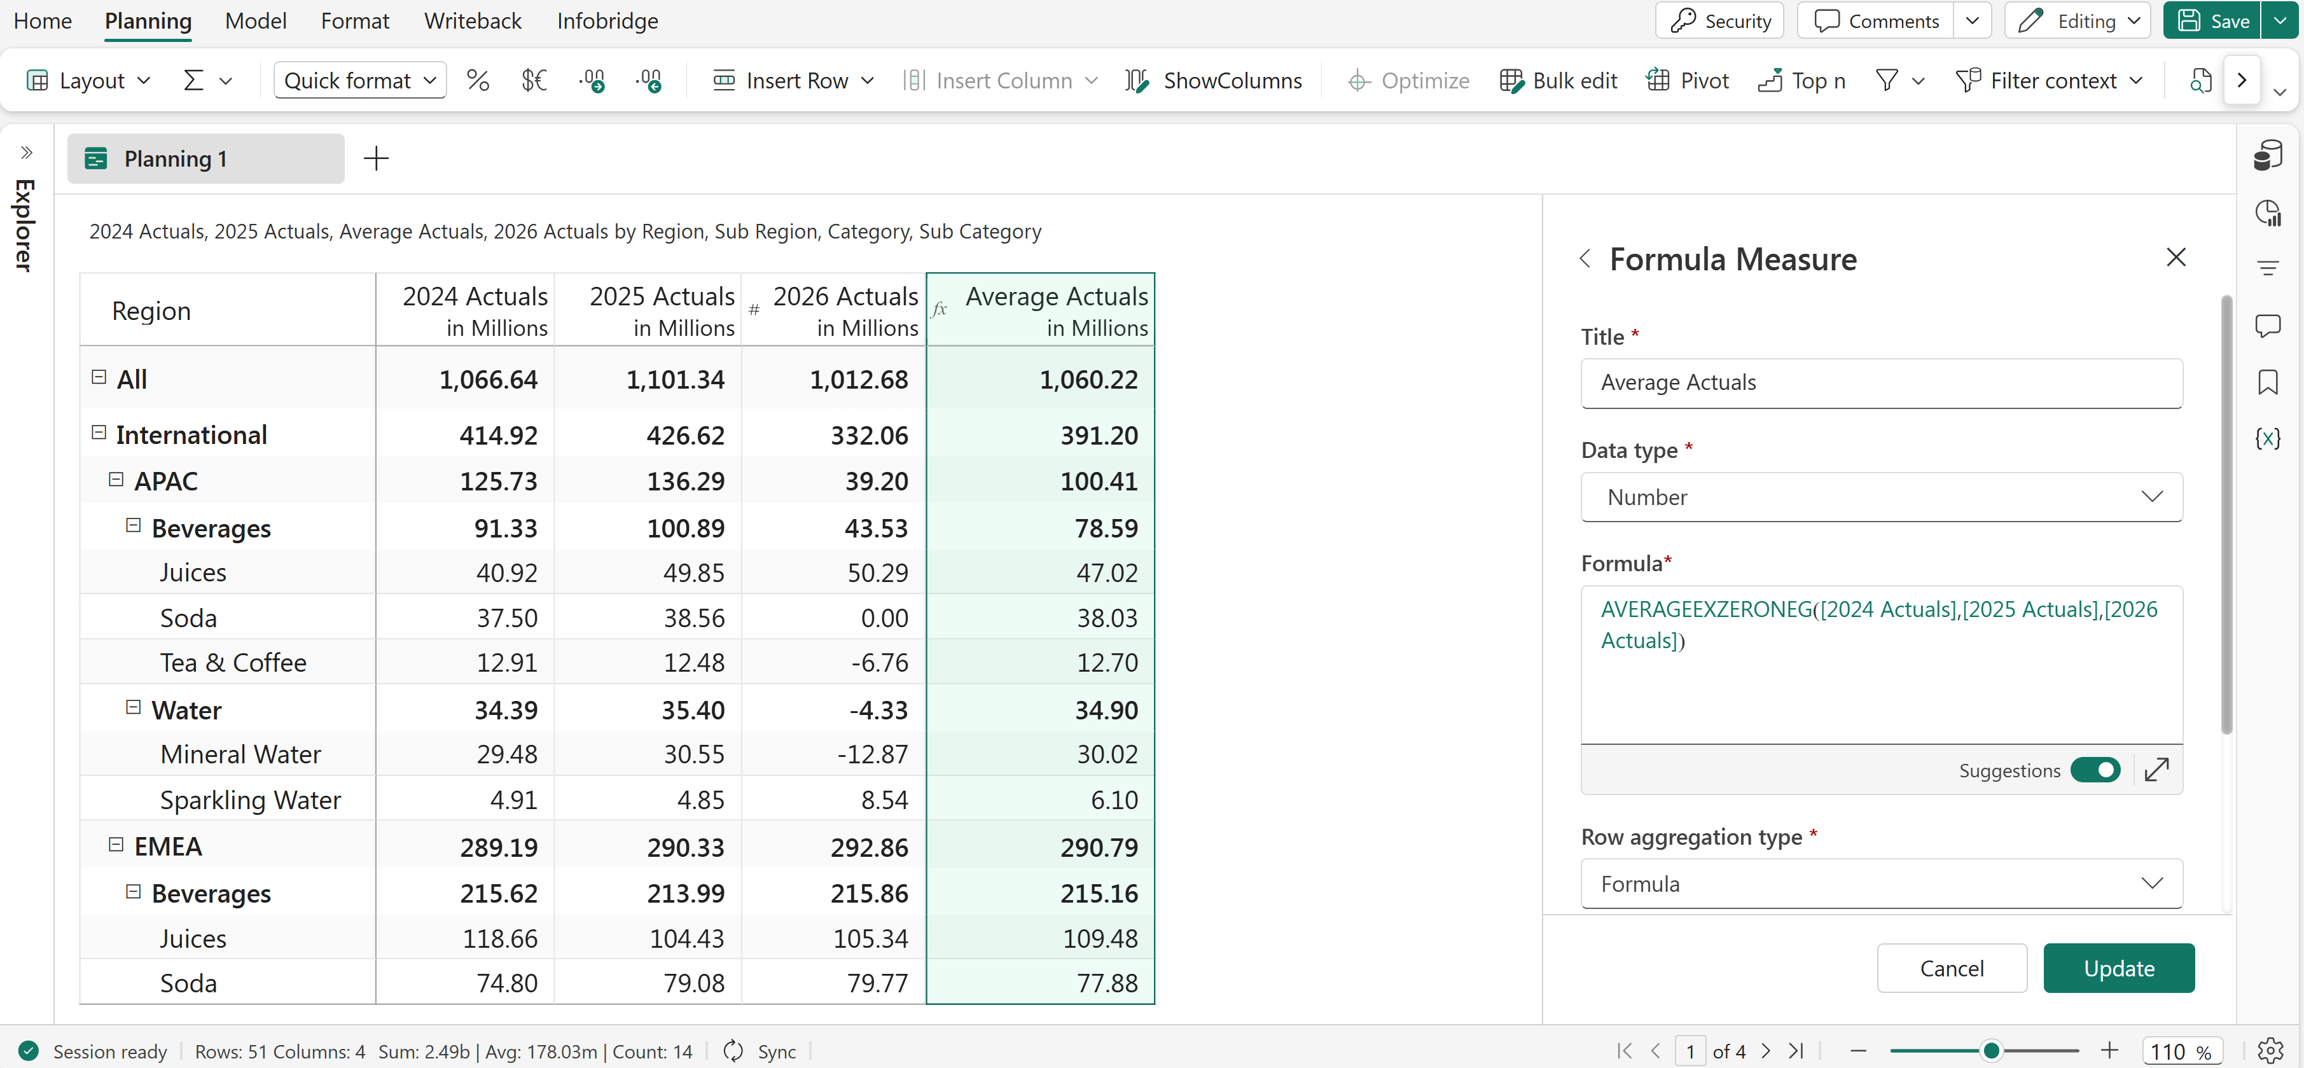
AVERAGEEXZERONEG(2024 Actuals, 2025 Actuals, 2026 Actuals)
In this example, the AVERAGEEXZERONEG function is used to create the Average Actuals measure. This measure returns the average of the 2024 Actuals, 2025 Actuals, and 2026 Actuals while excluding zero and negative values from the calculation.
Excel Equivalent
COUNT
The COUNT function returns the number of values in a list by counting the values provided in the arguments. It accepts numeric values or references and is commonly used to determine the size of a dataset or the number of entries in a range.
Syntax
COUNT(value1, value2, ...)
Arguments
value1, value2, ...: A list of values or references to count.
Return value
Returns the count of values in the list.
Example
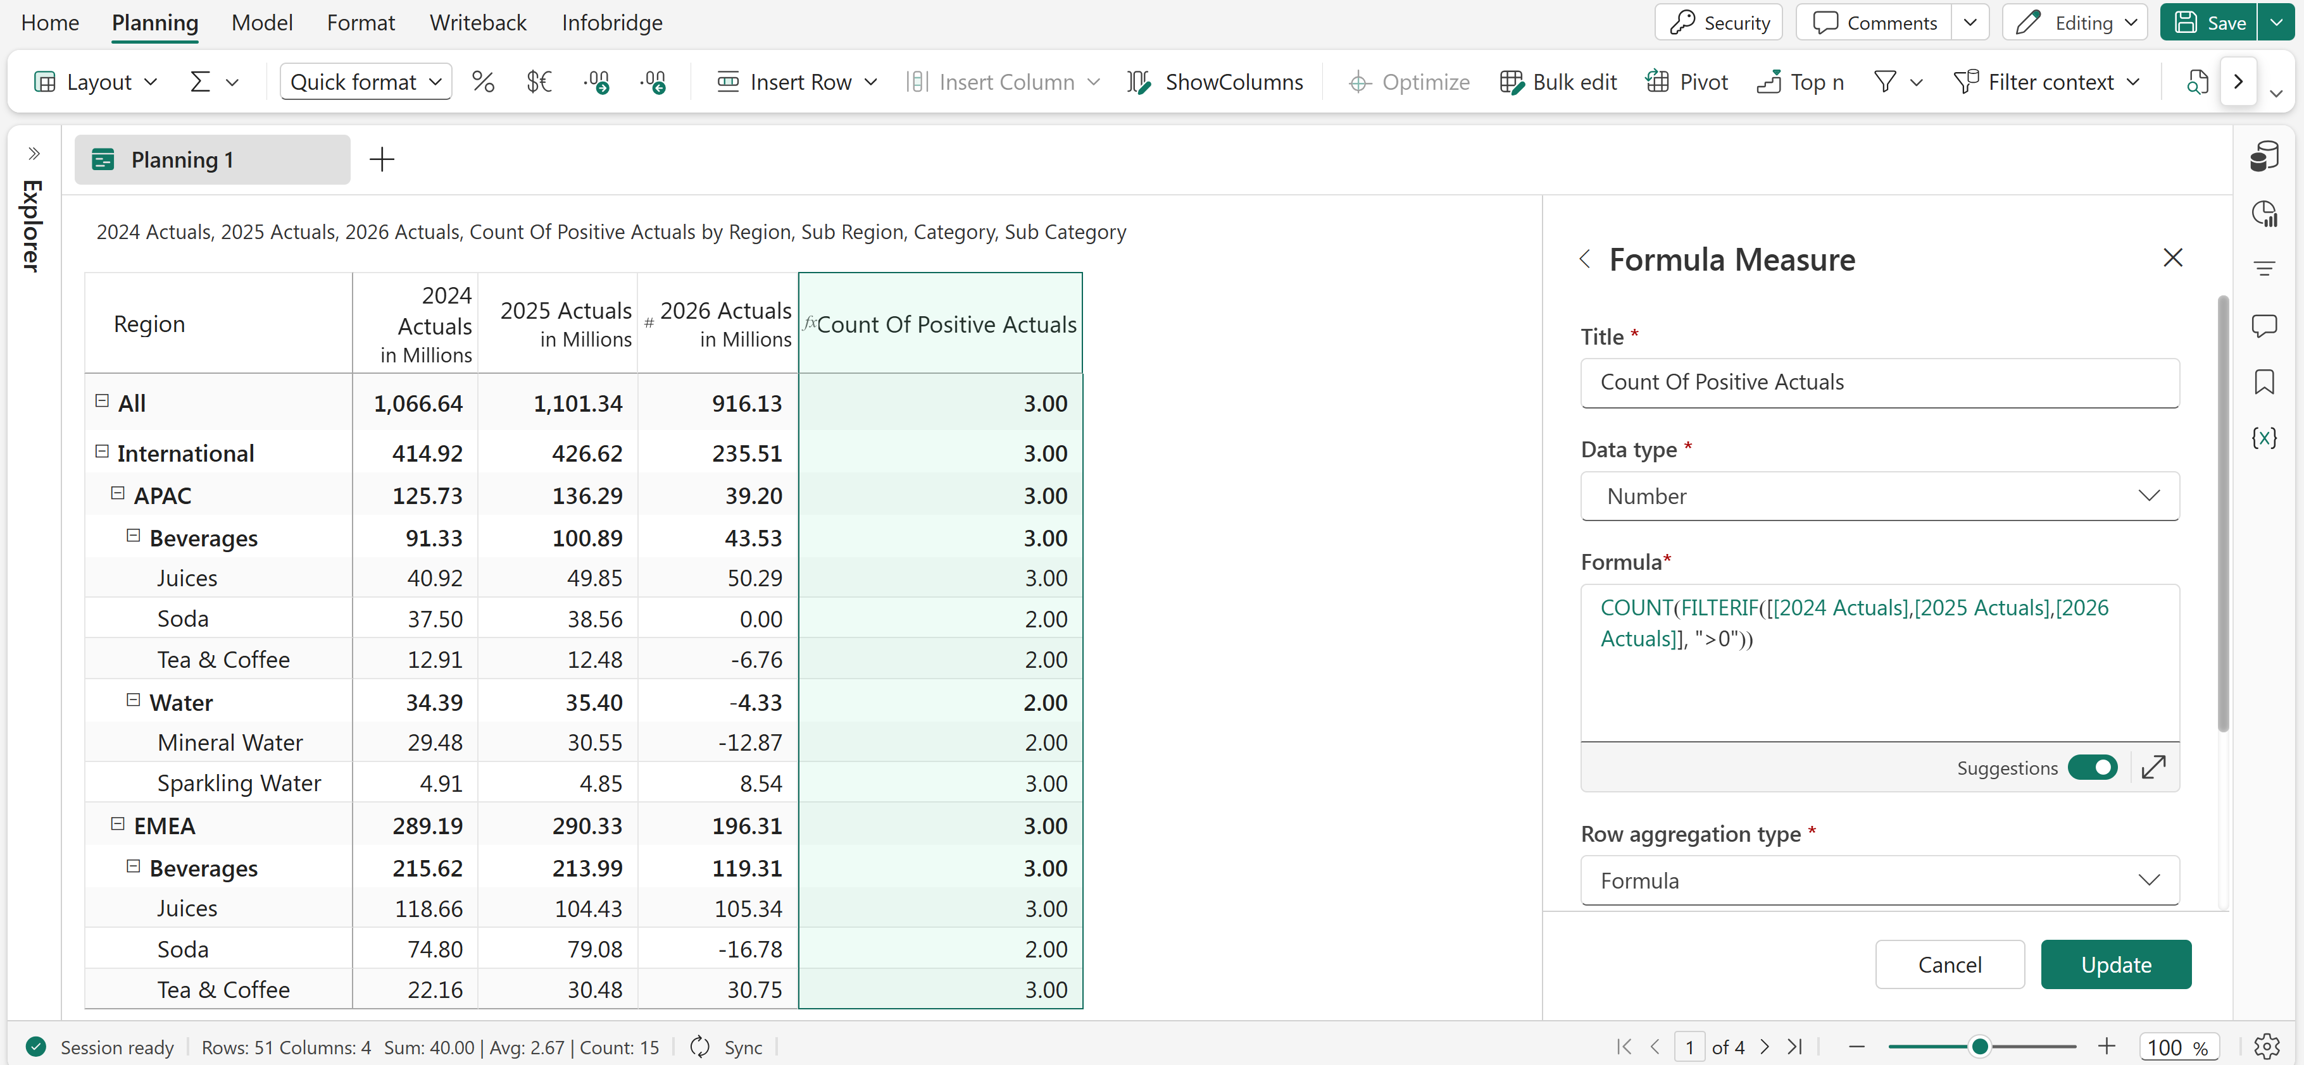
COUNT(FILTERIF([2024 Actuals, 2025 Actuals, 2026 Actuals], ">0"))
In this example, the COUNT function returns the count of values that are greater than 0 in 2024 Actuals, 2025 Actuals, and 2026 Actuals.
Excel equivalent
LARGE
The LARGE function returns the nth largest number from a list of values by identifying the value at the specified rank when the numbers are arranged from highest to lowest. It is commonly used to determine top values, rankings, or threshold levels within a dataset.
Syntax
LARGE(list, index)
Arguments
list: The list of numbers to evaluate.index: Specifies which largest value to return. For example, 1 returns the largest value, 2 returns the second largest value, and so on.
Return value
Returns the value at the specified rank from the list.
Example
LARGE([2025.Q1.Actuals, 2025.Q2.Actuals, 2025.Q3.Actuals, 2025.Q4.Actuals], 1)
In this example, the LARGE function returns the largest value from the quarterly Actuals of 2025.
Excel equivalent
MAX
The MAX function returns the largest number from a set of values. It evaluates the provided numbers or references and identifies the highest value among them. This function is commonly used in data analysis to determine maximum values, peaks, or top-performing results within a dataset.
Syntax
MAX(value1, [value2], ...)
Arguments
value1: The first number, array, or reference that contains numbers.value2, ...(optional): Additional numbers, arrays, or references that contain numbers.
Return value
Returns the largest value from the specified arguments.
Example
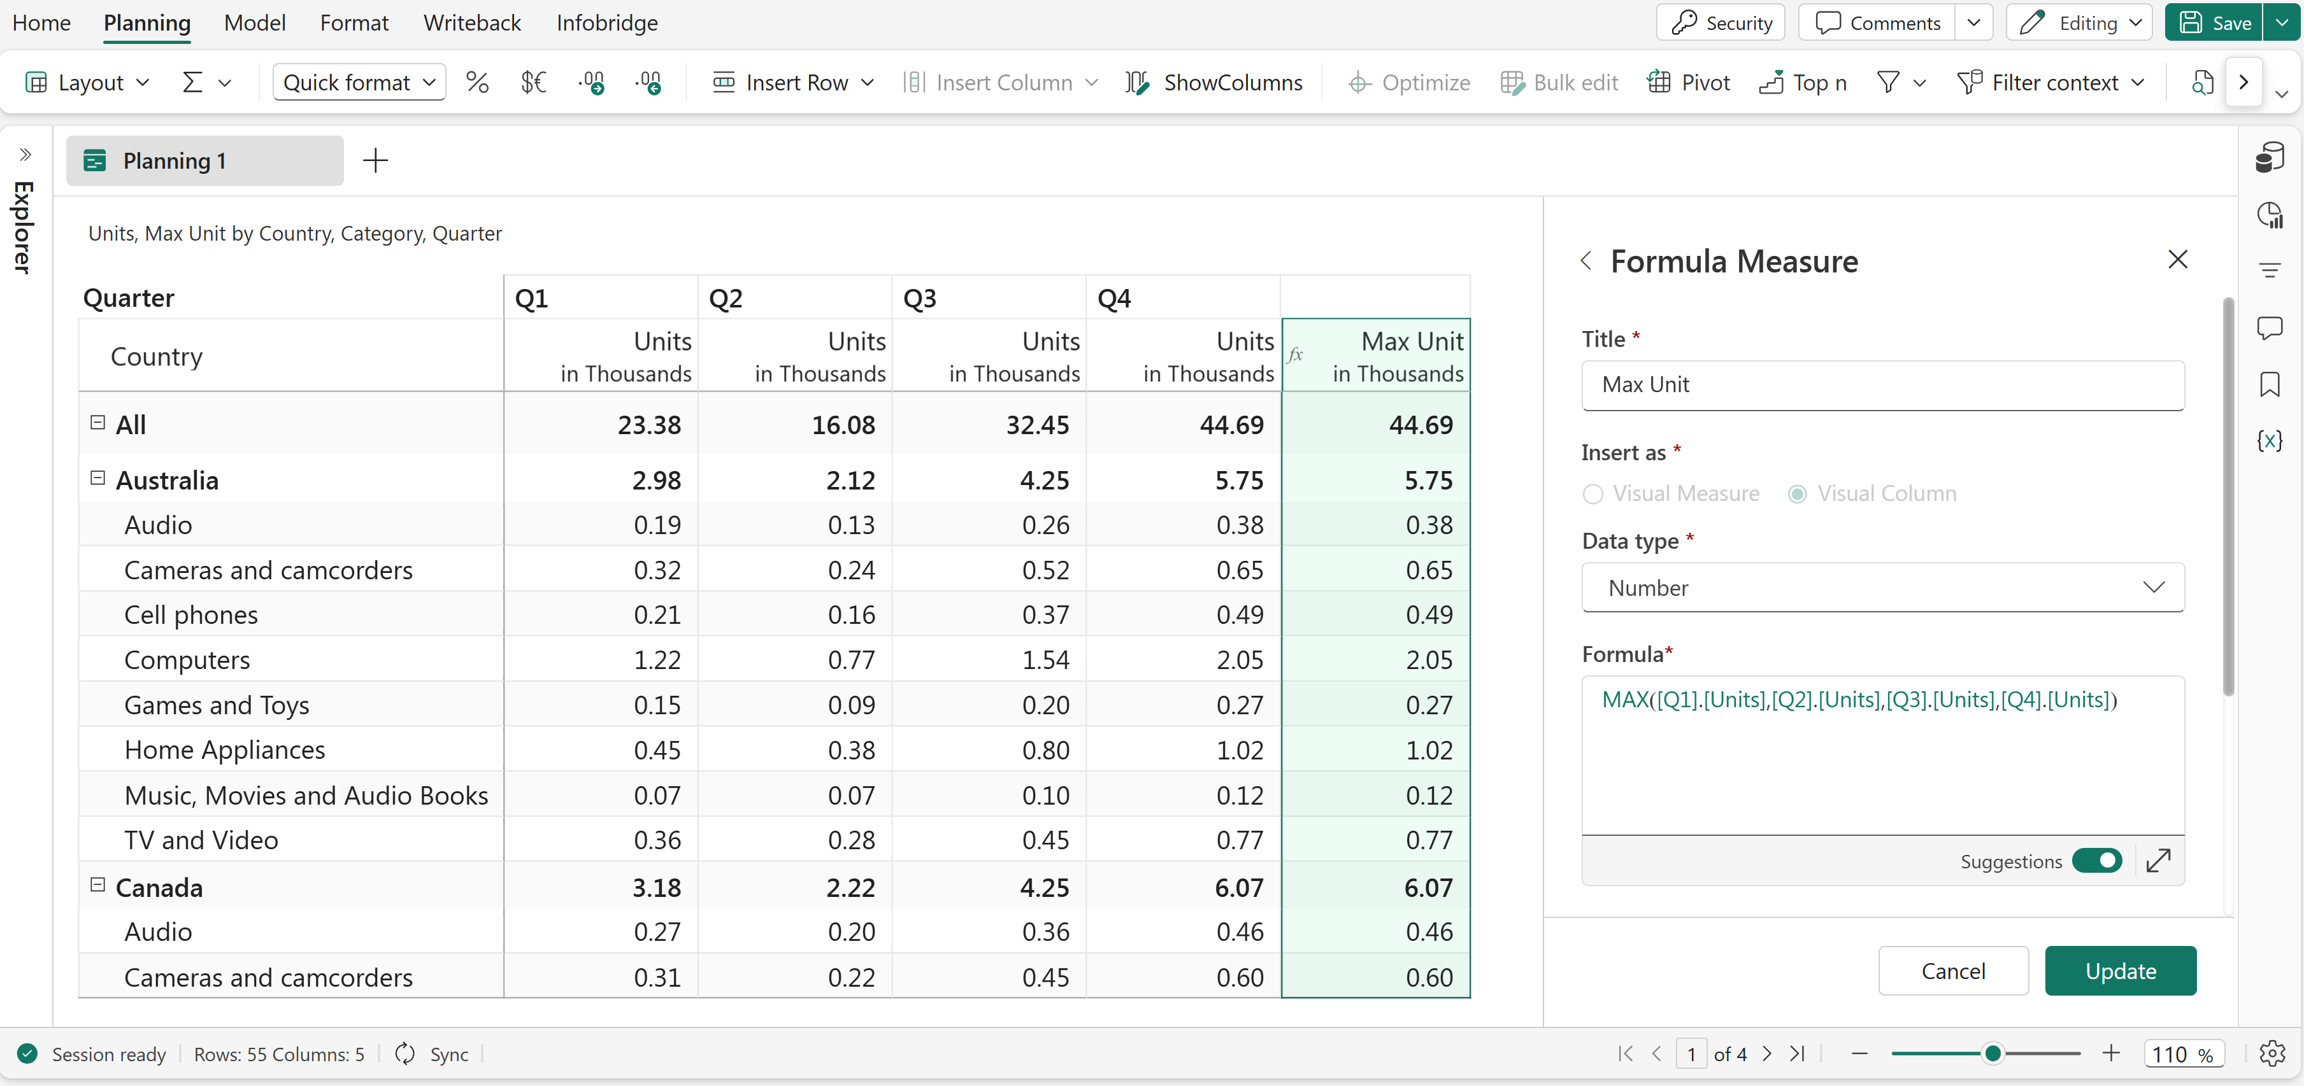
MAX(Q1.Units, Q2.Units, Q3.Units, Q4.Units)
In this example, the Max Unit measure is created using the MAX function, which returns the largest unit value across the four quarters.
Excel Equivalent
MIN
The MIN function returns the smallest number from a set of values. It evaluates the provided numbers or references and identifies the lowest value among them. This function is commonly used in data analysis to determine minimum values, lower limits, or least-performing results within a dataset.
Syntax
MIN(value1, [value2], ...)
Arguments
value1: The first number, array, or reference containing numeric values.value2, ...(optional): Additional numbers, arrays, or references containing numeric values.
Return value
Returns the smallest value from the specified arguments.
Example
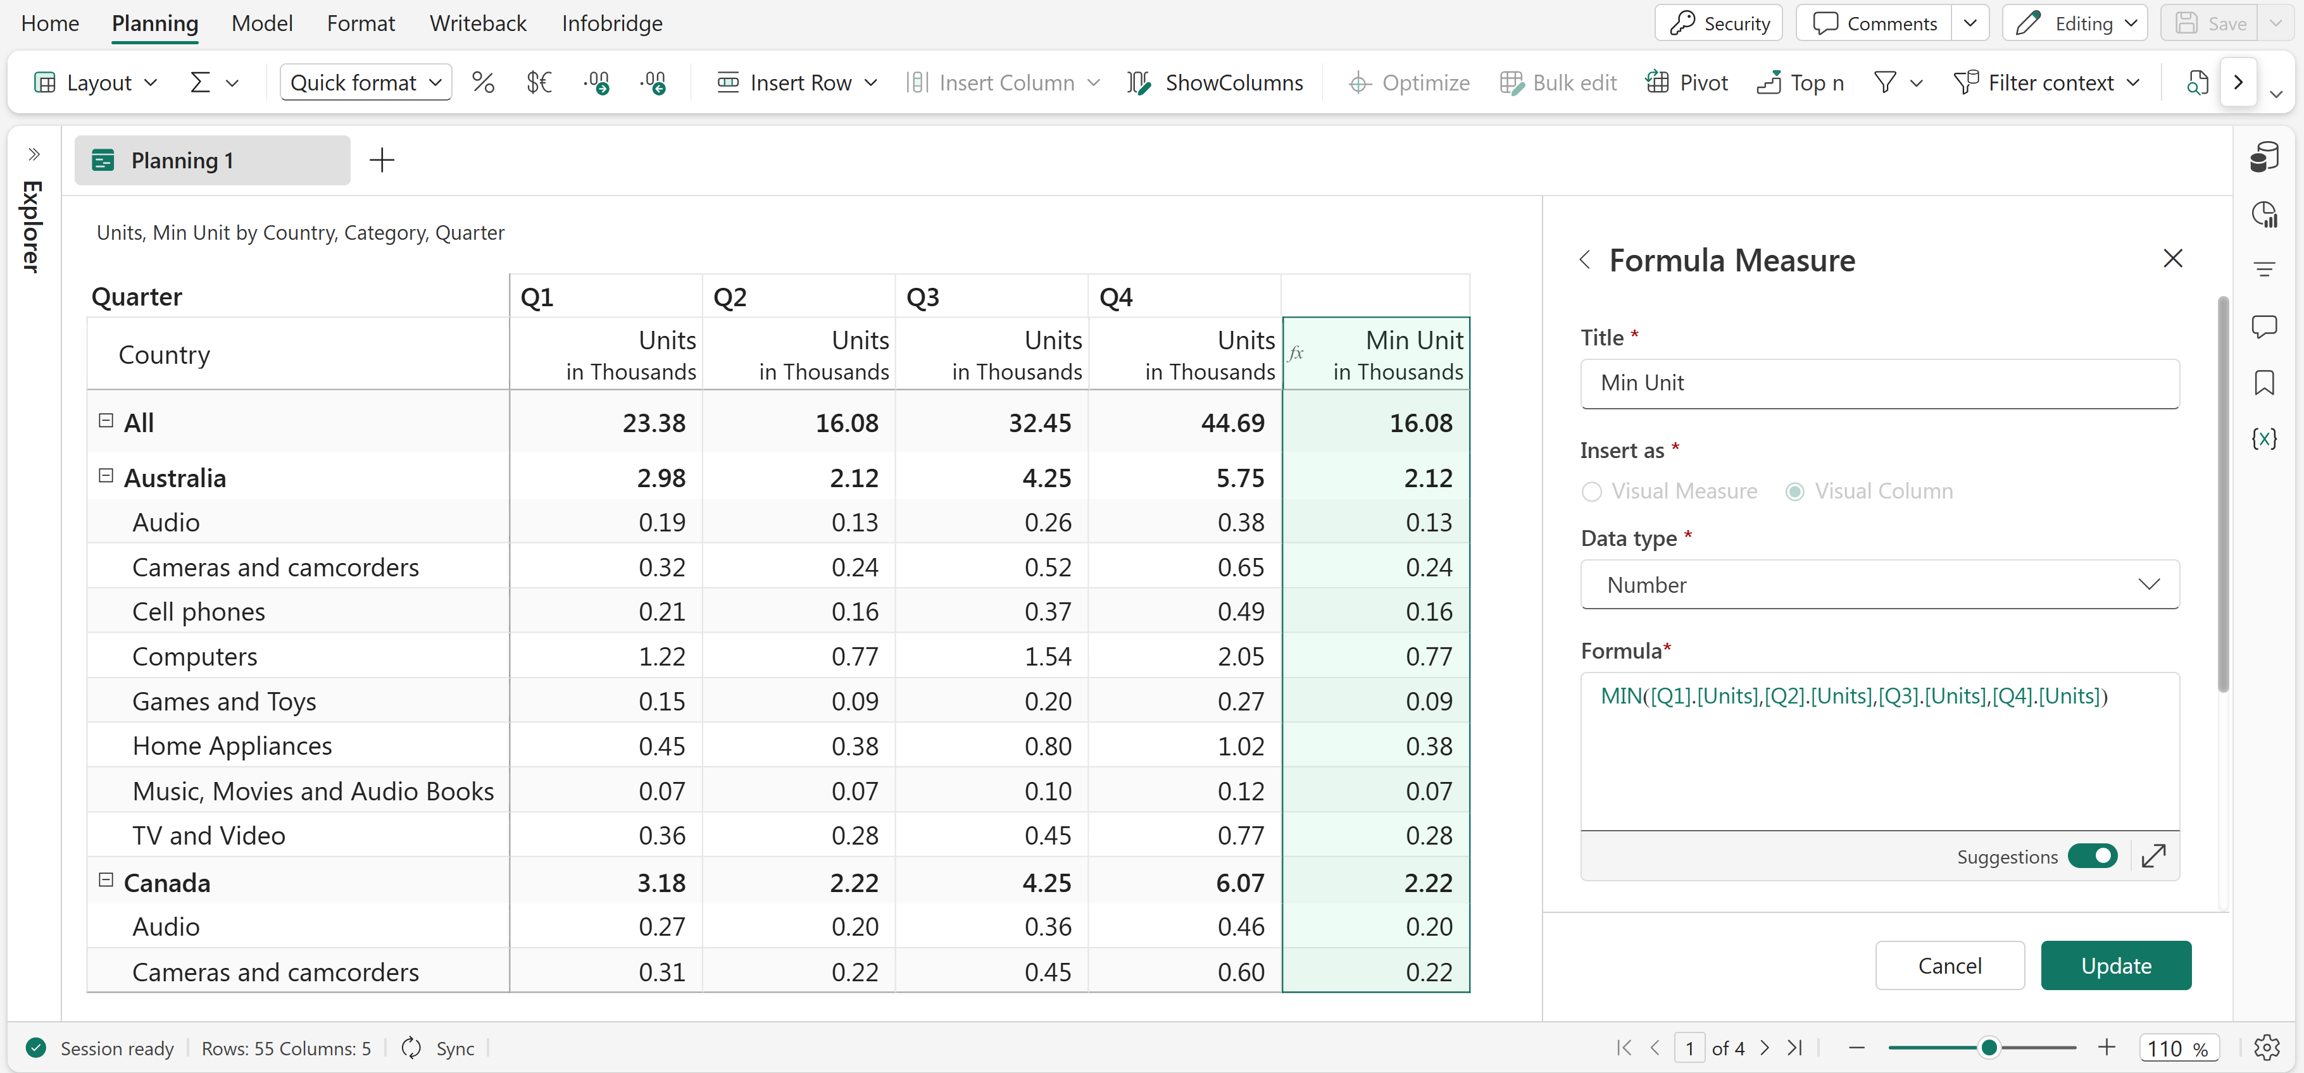
MIN(Q1.Units, Q2.Units, Q3.Units, Q4.Units)
In this example, the Min Unit measure is created using the MIN function, which returns the smallest unit value across the four quarters.
Excel Equivalent
SMALL
The SMALL function returns the nth smallest number from a list of values by identifying the value at the specified rank when the numbers are arranged from lowest to highest. It is useful for finding bottom or ranked values within a dataset.
Syntax
SMALL(list, index)
Arguments
list: The list of numbers to evaluate.index: The position of the value to return when the numbers are sorted in ascending order. For example, 1 returns the smallest value, 2 returns the second-smallest value, and so on.
Return value
Returns the nth smallest value from the specified list.
Example
SMALL([2025.Q1.Actuals, 2025.Q2.Actuals, 2025.Q3.Actuals, 2025.Q4.Actuals], 1)
In this example, the SMALL function returns the smallest value from the quarterly Actuals of 2025.
Excel equivalent
SORT
The SORT function accepts a series of values and returns an array of values sorted in ascending order. It is commonly used to arrange numeric data for comparison, ranking, and analytical calculations. Since the function returns an array, individual elements can be accessed using their index positions.
Note
To sort in descending order, use the SORTDESC function.
Syntax
SORT(value1, [value2], ...)
Arguments
value1: The first value to sort.value2, ...(optional): Additional values to include in the sorting operation.
Return value
Returns an array of values sorted in ascending order.
Example
Consider a scenario where quarterly actual values need to be analyzed to identify the lowest and second-lowest actuals. The SORT function can be used to sort the quarterly actual values for each row in ascending order.
In this example, consider variable a stores the array returned by the SORT function. The lowest quarterly revenue can then be accessed using a[0], while the highest quarterly revenue can be accessed using a[3].