Note
Access to this page requires authorization. You can try signing in or changing directories.
Access to this page requires authorization. You can try changing directories.
Planning provides functions to calculate variance and standard deviation in a dataset. Use the functions in this section to measure how widely values are spread around the mean, making it easier to analyze data variability and distribution.
VARS
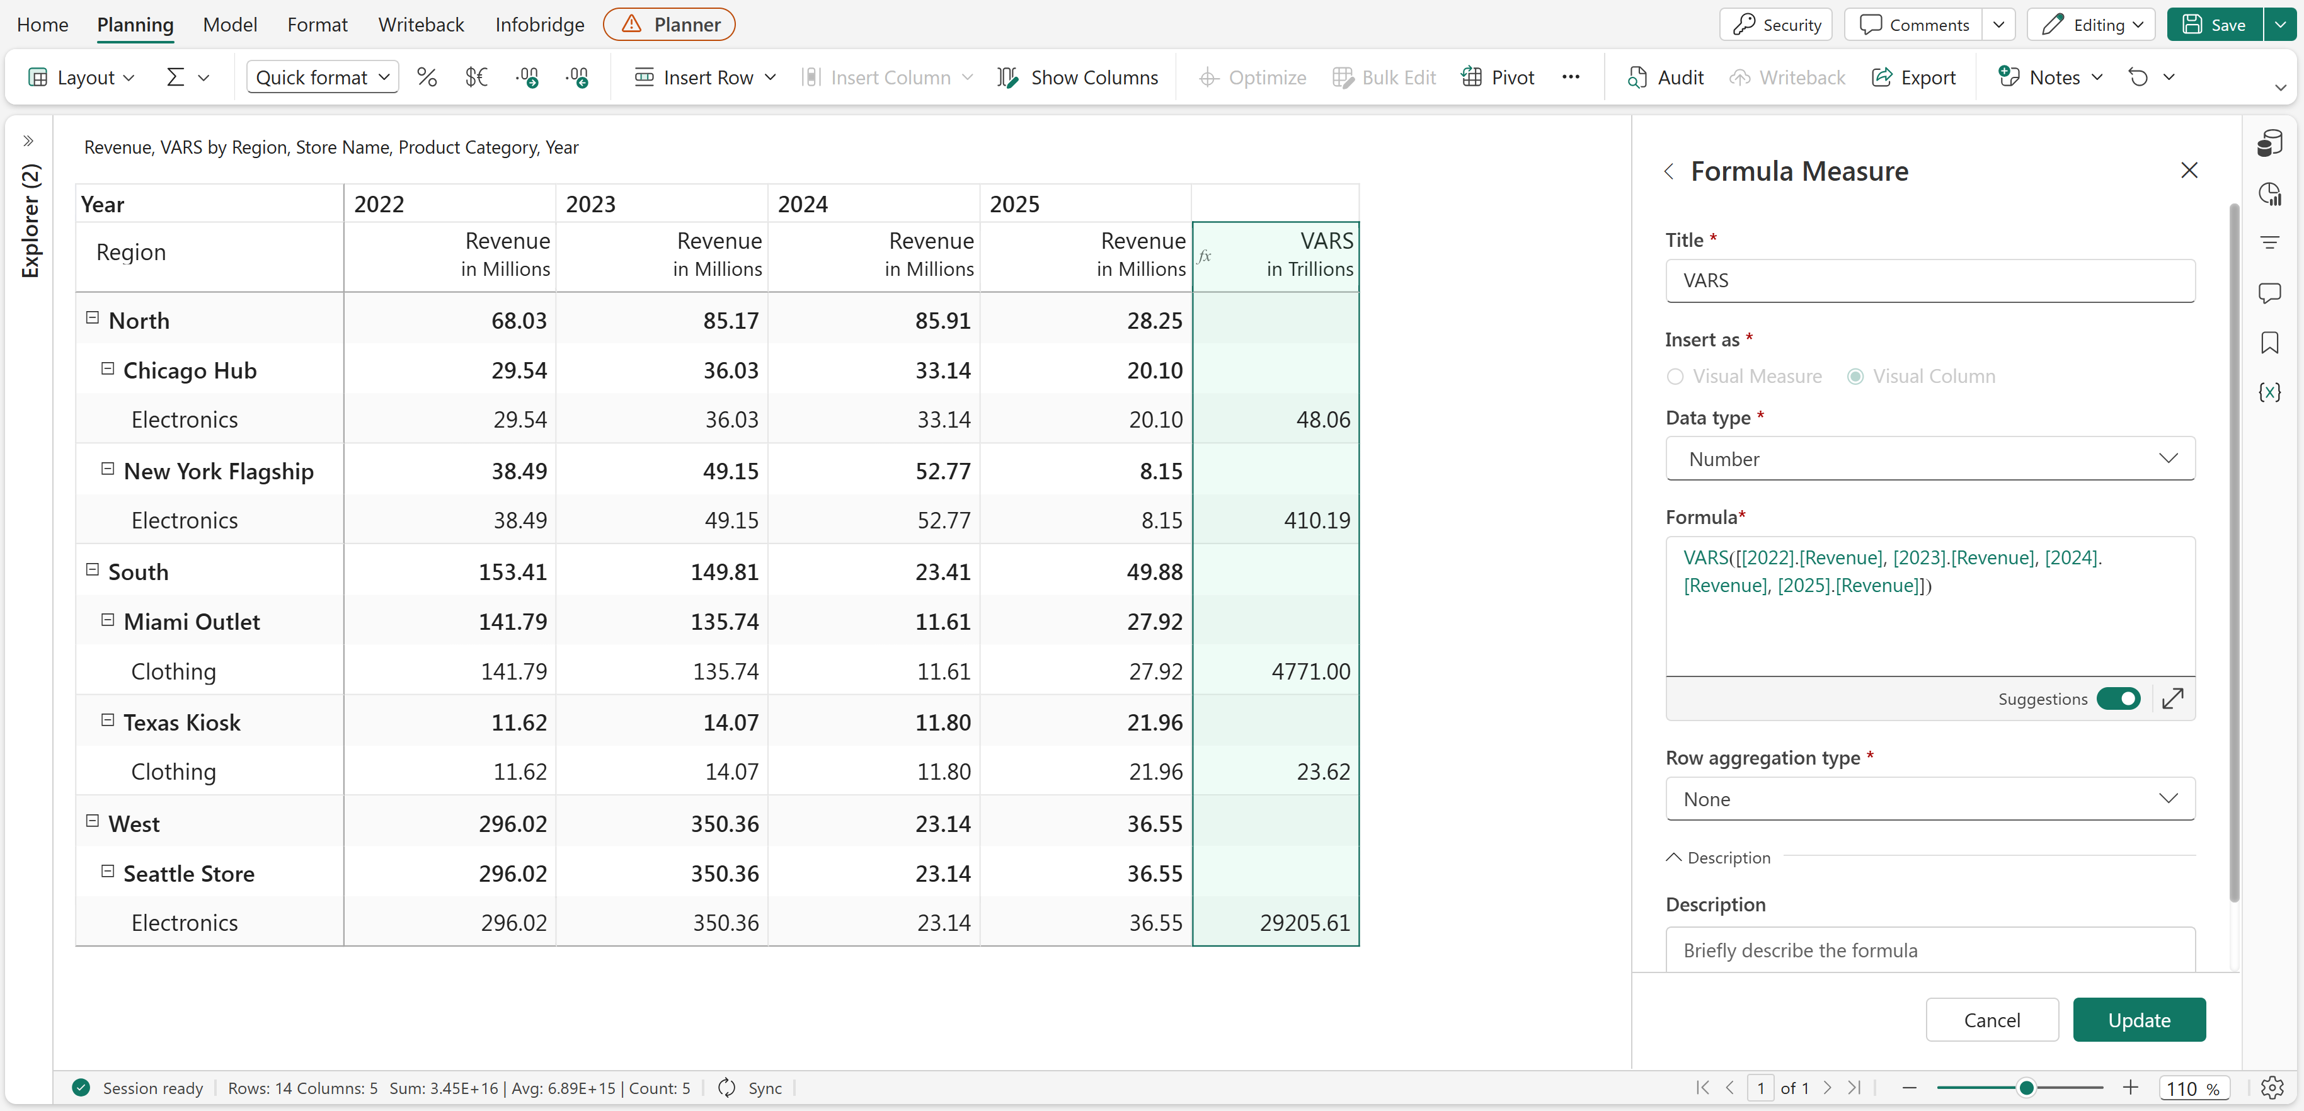
The VARS function returns the sample variance of a set of numbers. It measures how widely values are spread from the mean when the data represents a sample of a larger population. The calculation uses (n − 1) in the denominator to provide an unbiased estimate.
Syntax
VARS(number1, [number2], ...)
Arguments
number1,number2, ...: The numbers or range of values used to calculate the sample variance.
Return value
Returns the sample variance of the specified set of numbers.
Examples
VARS(10, 20, 30)
Returns the sample variance of the specified set of numbers. In this example, the function returns 100.
VARS(10, 20, 30, 40, 50)
Returns the sample variance of the specified set of numbers. In this example, the function returns 250.
You can use the VARS function to analyze how widely values are spread from the mean for metrics such as sales, revenue, or performance scores.
Excel equivalent
VARP
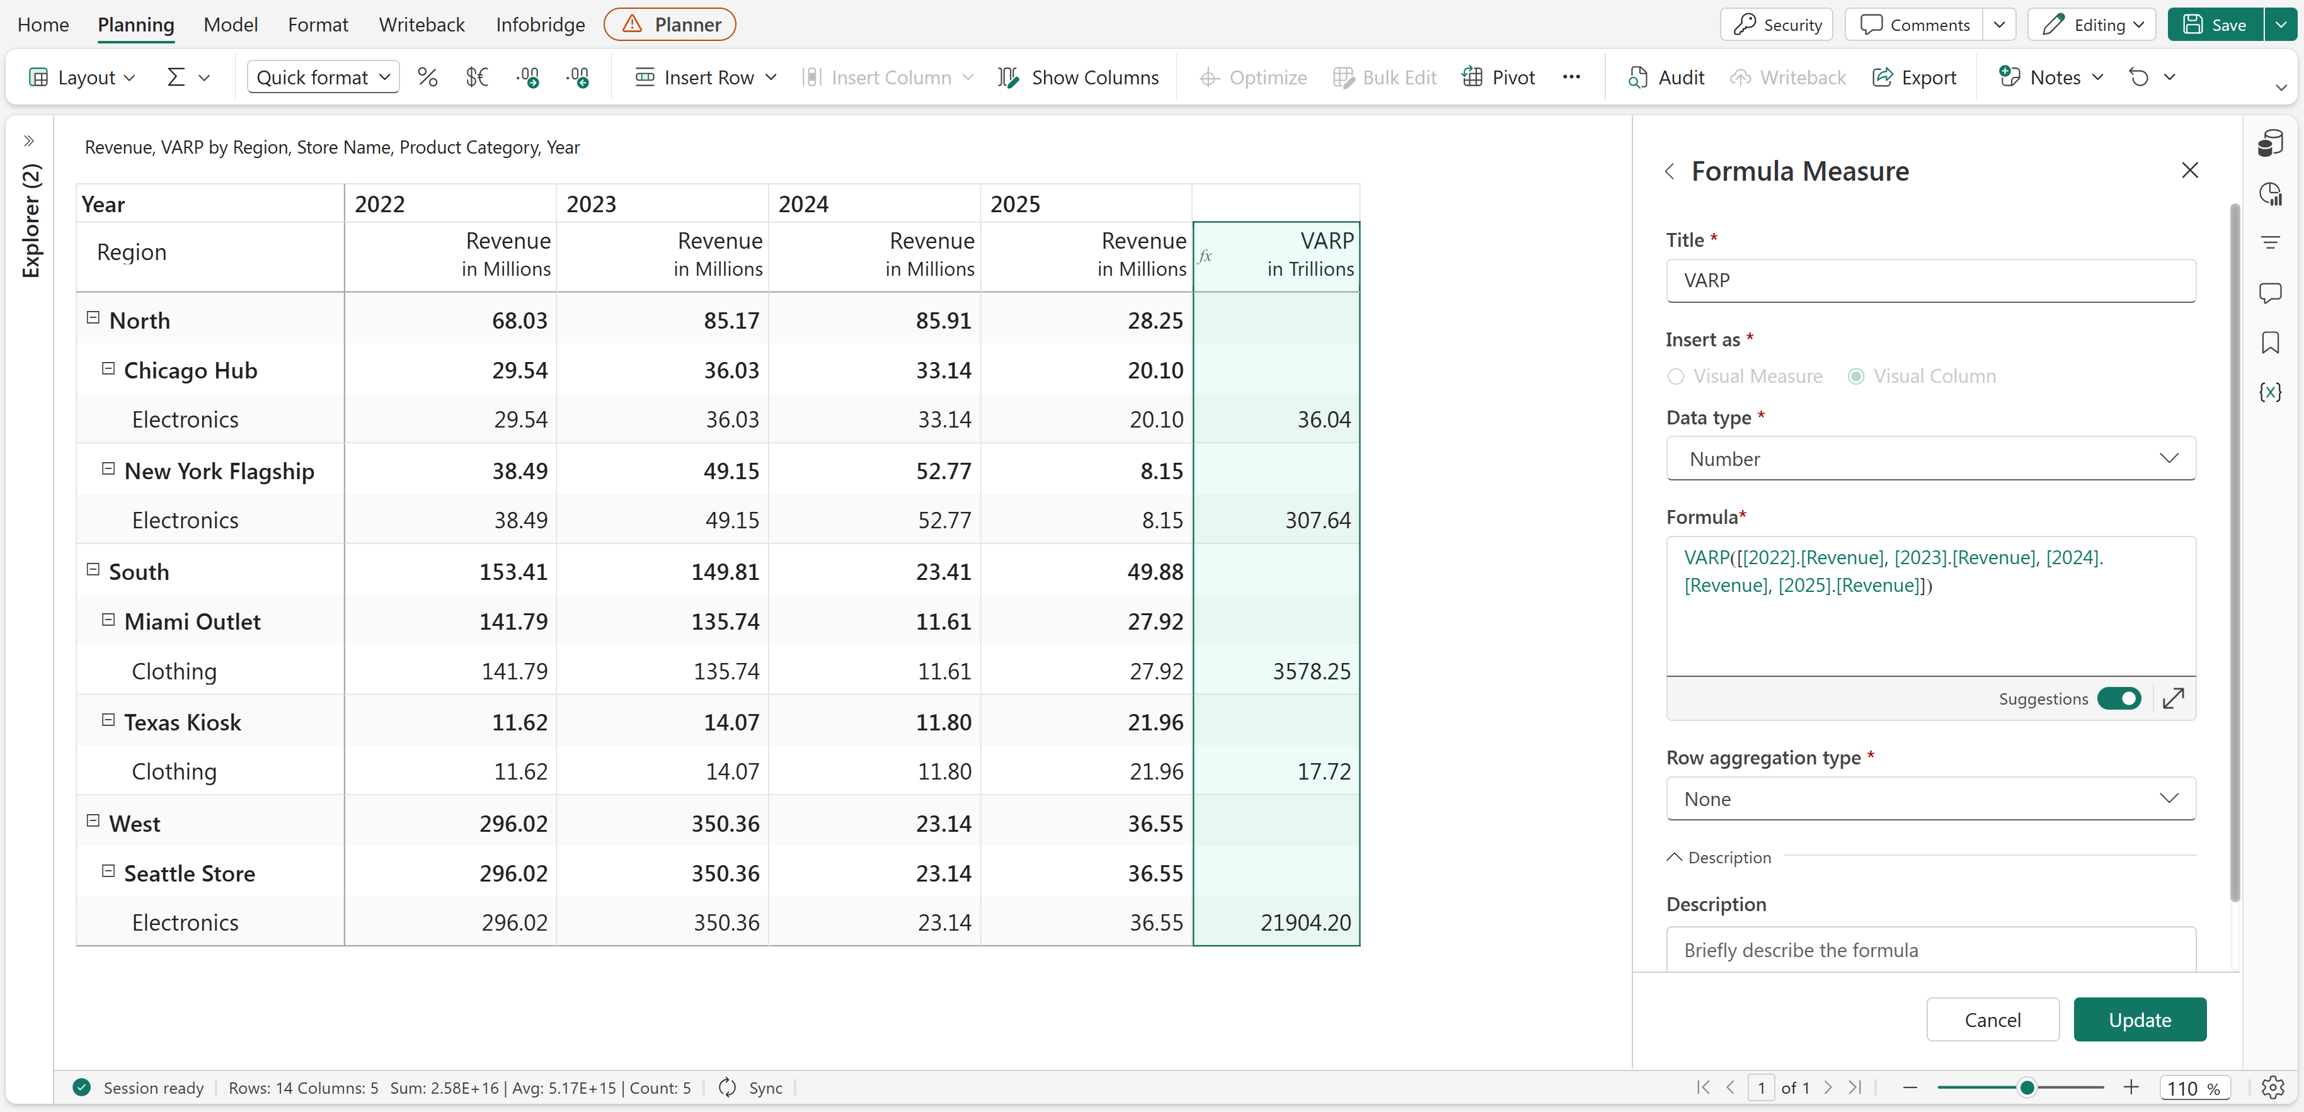
The VARP function returns the population variance of a set of numbers. It measures how widely values are spread from the mean when the data represents the entire population. The calculation uses n in the denominator.
Syntax
VARP(number1, [number2], ...)
Arguments
number1,number2, ...: The numbers or range of values used to calculate the population variance.
Return value
Returns the population variance of the specified set of numbers.
Examples
VARP(10, 20, 30)
Returns the population variance of the specified set of numbers. In this example, the function returns 66.67.
VARP(10, 20, 30, 40, 50)
Returns the population variance of the specified set of numbers. In this example, the function returns 200.
You can use the VARP function to analyze how widely values are spread from the mean for metrics such as sales, revenue, or performance scores.
Note
Use the VARS function when working with sample data, as it calculates the sample variance using (n − 1) in the denominator. Use the VARP function when working with the entire population, as it calculates the population variance using n in the denominator.
Excel equivalent
STDEVS
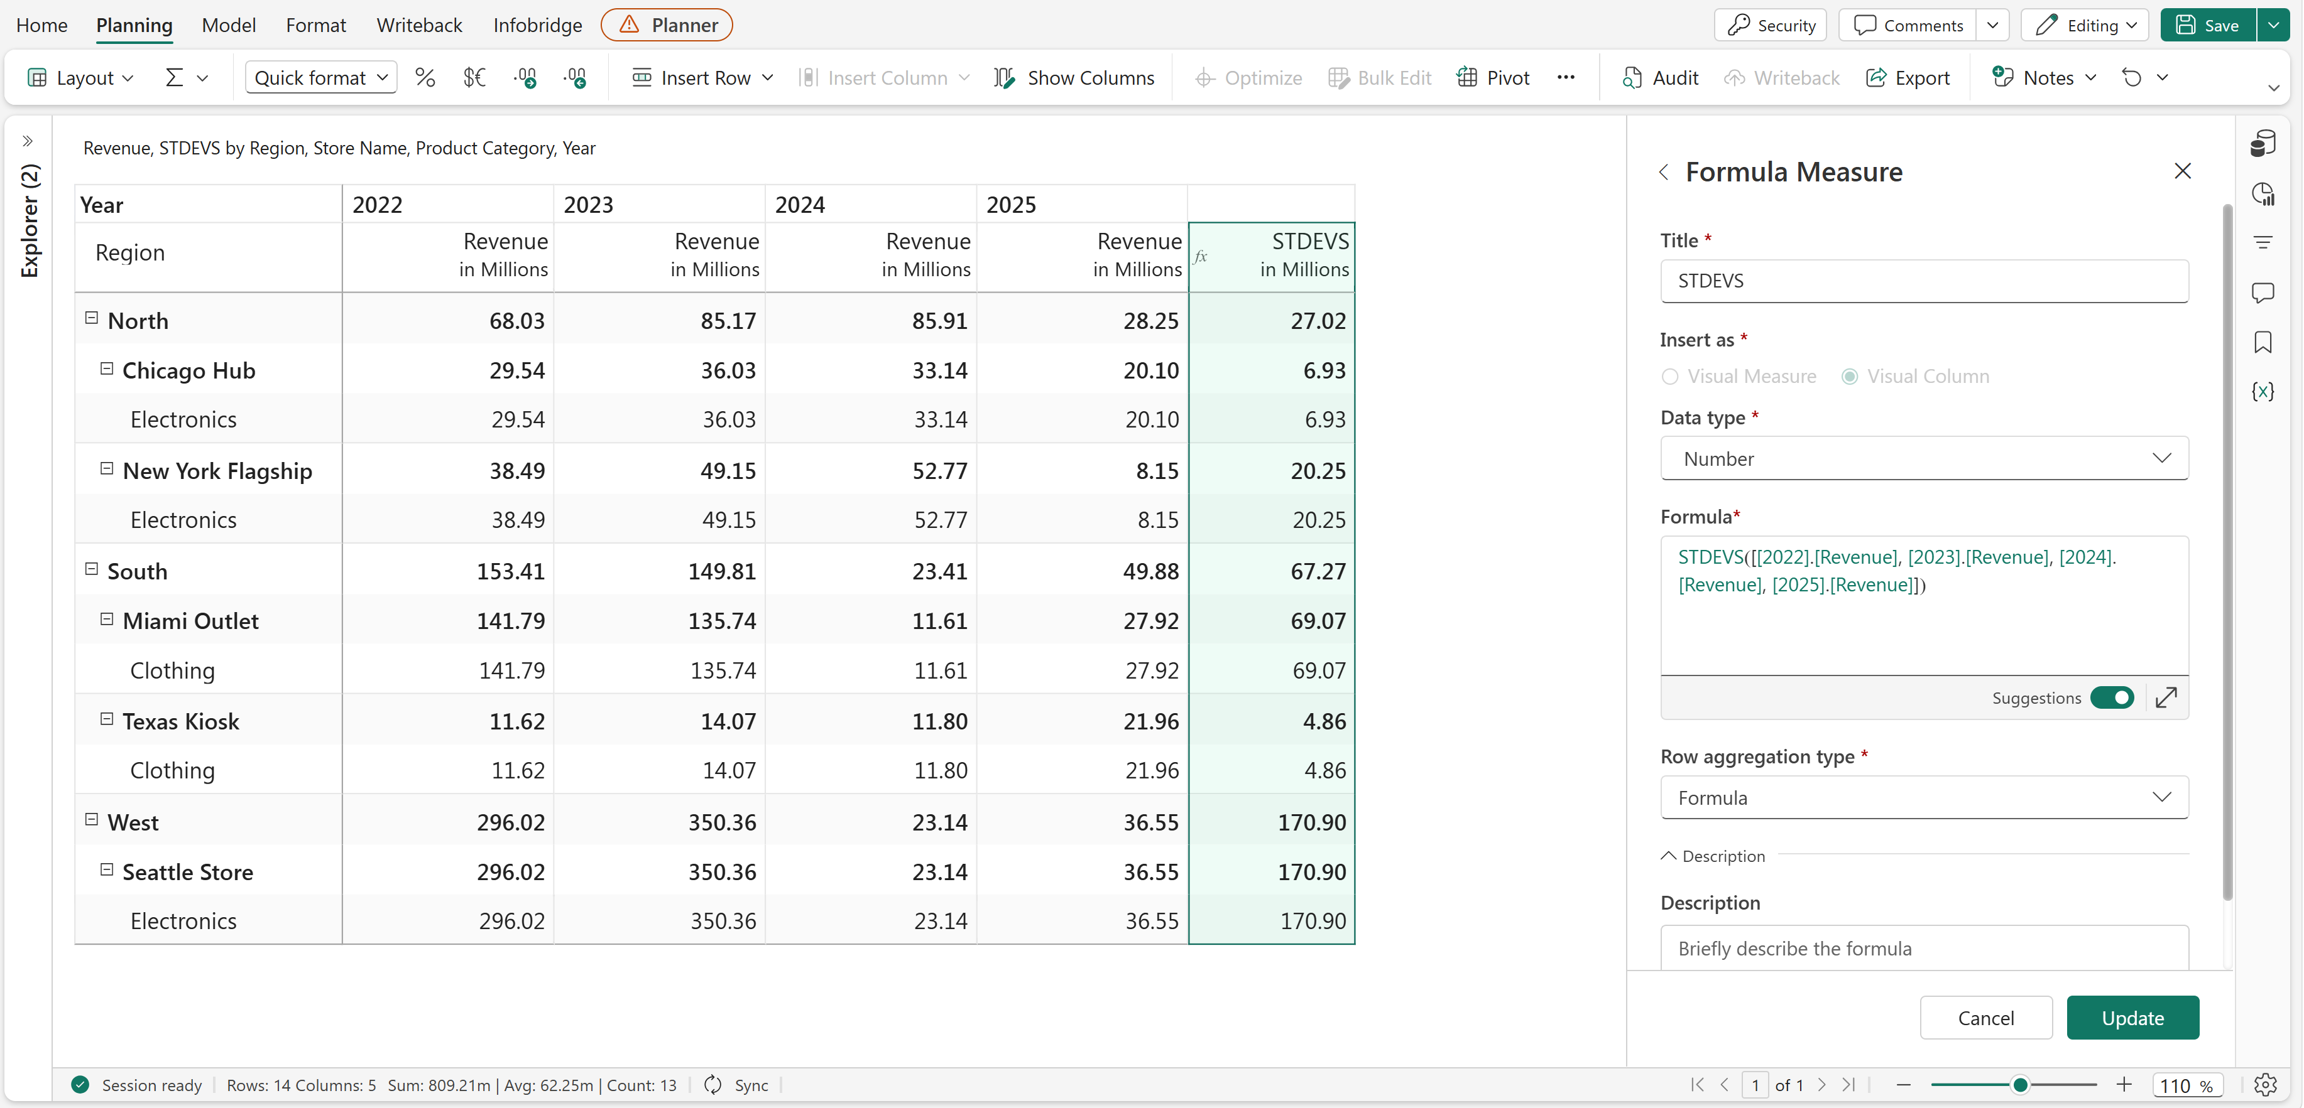
The STDEVS function returns the sample standard deviation of a set of numbers. It measures how widely values are dispersed from the mean when the data represents a sample of a larger population. The calculation uses (n − 1) in the denominator to provide an unbiased estimate.
Syntax
STDEVS(number1, [number2], ...)
Arguments
number1,number2, ...: The numbers or range of values used to calculate the sample standard deviation.
Return value
Returns the sample standard deviation of the specified set of numbers.
Example
STDEVS(10, 20, 30, 40, 50)
Returns the sample standard deviation of the specified set of numbers. In this example, the function returns 15.81.
You can use the STDEVS function to analyze how widely values are spread from the mean for metrics such as sales, revenue, or performance scores.
Excel equivalent
STDEVP
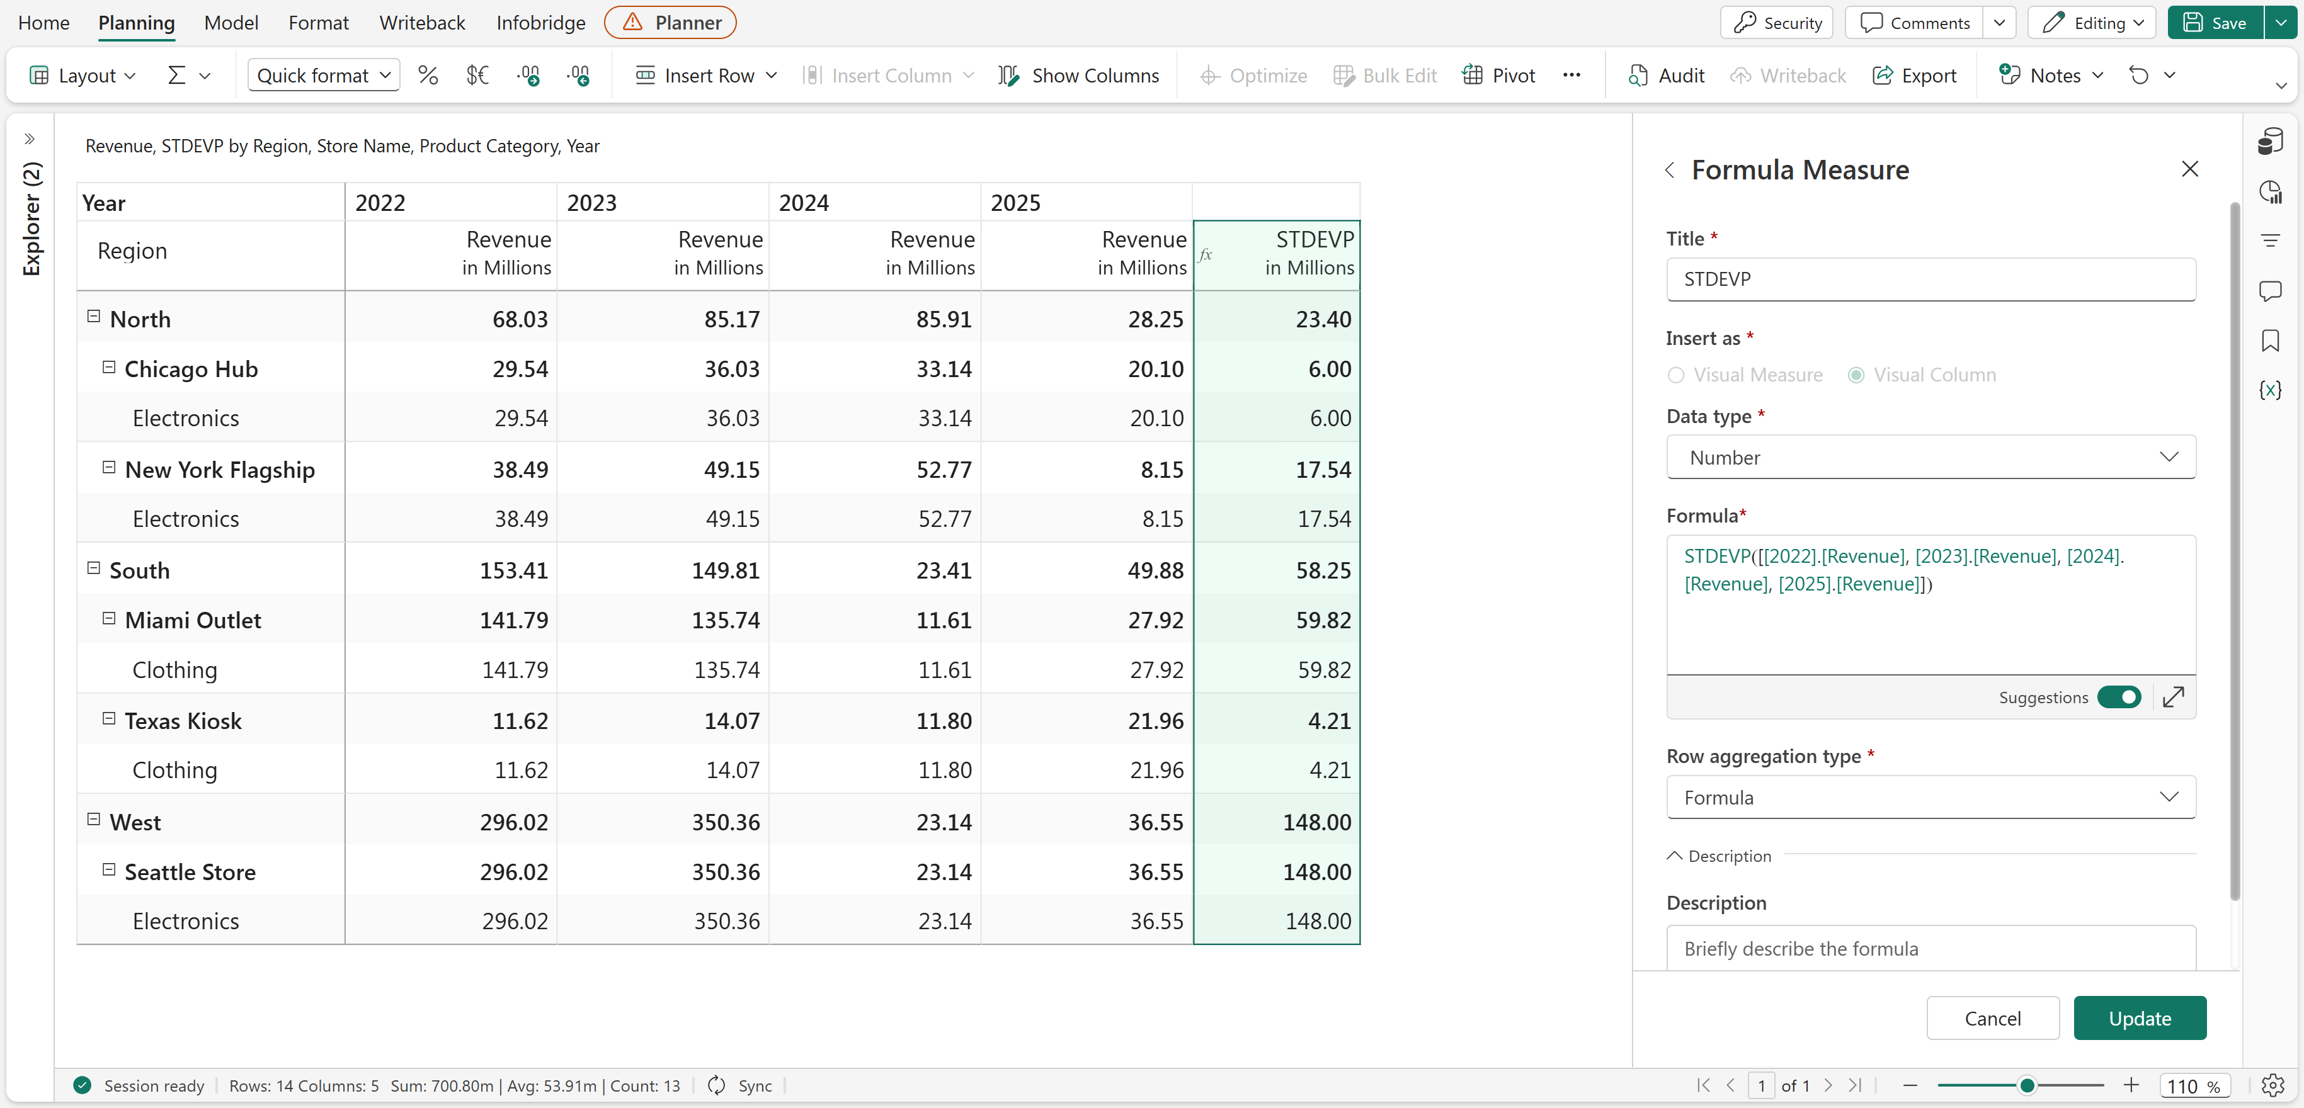
The STDEVP function returns the population standard deviation of a set of numbers. It measures how widely values are dispersed from the mean when the data represents the entire population. The calculation uses n in the denominator.
Syntax
STDEVP(number1, [number2], ...)
Arguments
number1,number2, ...: The numbers or range of values used to calculate the population standard deviation.
Return value
Returns the population standard deviation of the specified set of numbers.
Example
STDEVP(10, 20, 30, 40, 50)
Returns the population standard deviation of the specified set of numbers. In this example, the function returns 14.14.
You can use the STDEVP function to analyze how widely values are spread from the mean for metrics such as sales, revenue, or performance scores.
Note
Use the STDEVS function when working with sample data, as it calculates the sample standard deviation using (n − 1) in the denominator. Use the STDEVP function when working with the entire population, as it calculates the population standard deviation using n in the denominator.