Note
Access to this page requires authorization. You can try signing in or changing directories.
Access to this page requires authorization. You can try changing directories.
In this tutorial series, you build a complete enterprise planning solution in Microsoft Fabric. Starting from scratch, you connect to a semantic model, set revenue targets, generate statistical forecasts, build P&L hierarchies, and create a multi-dimensional profitability view by using planning sheets.
You then move your IT asset data out of spreadsheets into PowerTable, a governed data app in Fabric planning. Here, you create the database, build a sheet for each table, format and connect the columns, and keep the data relevant through appropriate insertions and updates.
Finally, by using intelligence sheets, you turn a live semantic model into an interactive enterprise dashboard, building variance and trend charts, KPI cards, and filters, and adding comments to collaborate with your team.
Prerequisites
Before starting this tutorial series, verify that you have:
Access to a Microsoft Fabric capacity (F2 or higher) or a Fabric trial.
A workspace role as Member or Admin. Contributor access isn't sufficient - planning requires Member or Admin to create connections and generate embed tokens.
The following tenant settings enabled in the Fabric admin portal:
Integration settings > Allow XMLA Endpoints & Analyze in Excel with on-premises semantic models.
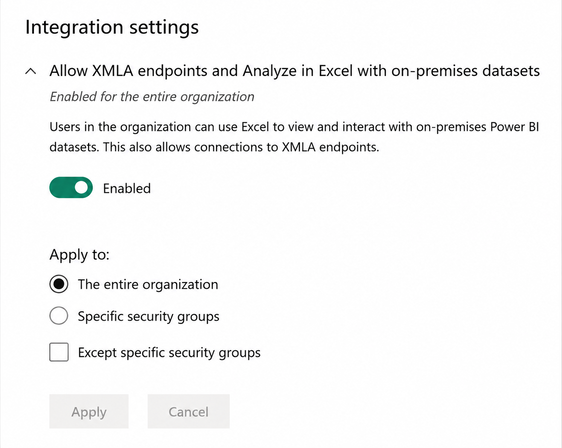
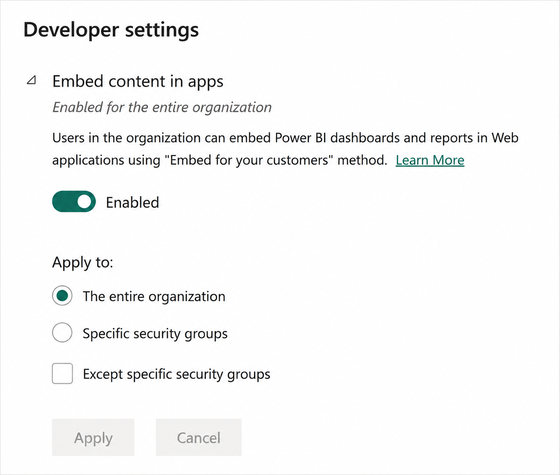
Developer settings > Embed content in apps
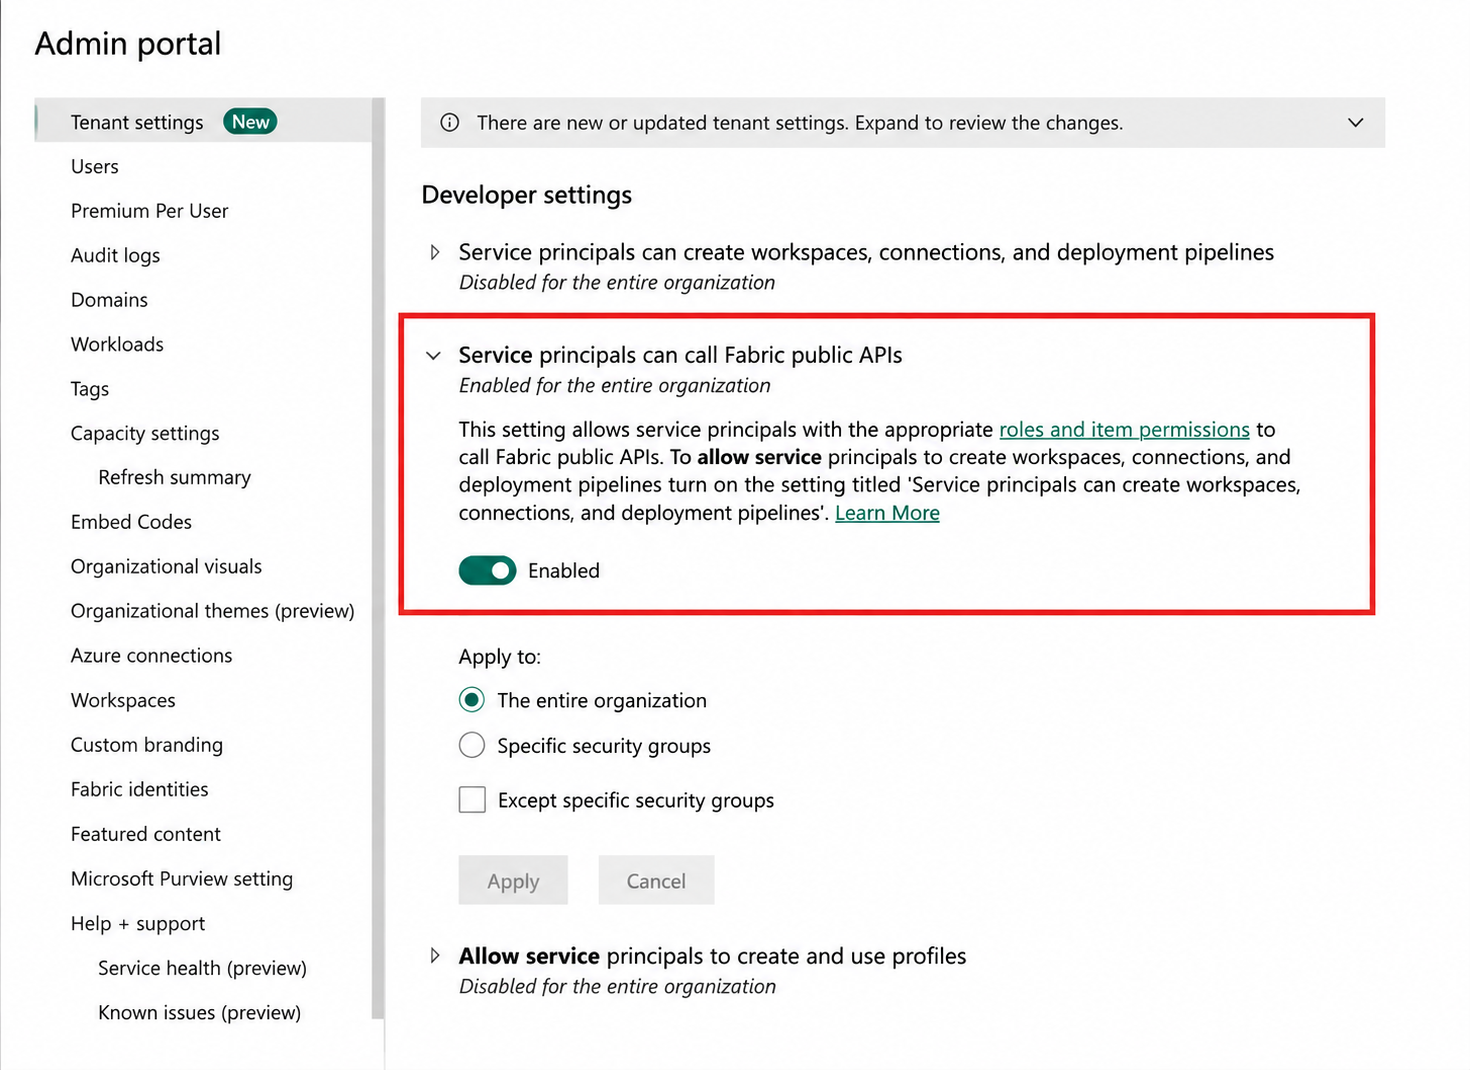
Developer settings > Service principals can call Fabric public APIs
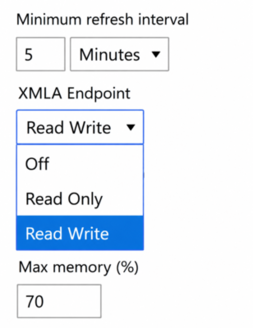
Under Capacity Settings, ensure the XMLA Endpoint setting is set to Read Only or Read Write.
Installed Microsoft Edge or Google Chrome. Safari isn't supported for planning.
Downloaded the data used in the planning sheet tutorials from the Fabric Samples GitHub repository: Northwind_FMCG.pbix
Note
Plan doesn't support Microsoft Entra B2B guest accounts. Workspaces that use private links aren't supported either.
Business context
In this tutorial series, you build a complete planning environment, set and optimize a revenue target, generate a rolling forecast, build a row-based and measure-based P&L model, and connect plans across two planning teams into a single profitability view.
Follow the tutorials in order:
- Set up, plan, and optimize: Connect the Northwind_FMCG.pbix semantic model, create a Fabric SQL database, and build the Plan app. Set a $30m revenue target, build a bottom-up sales plan, and run the Optimizer to achieve a $12.5m gross profit target.
- Create a rolling forecast: Build a rolling 2026 forecast, generate a statistical forecast using 24 months of actuals, close January as actuals arrive, extend the horizon to January 2027, and commit the finalized forecast to the Fabric SQL database.
- Build a P&L hierarchy with Measure Model: Organize a few semantic model measures into a structured P&L hierarchy. Create a Best-Case scenario and a Cost Restructuring scenario, then compare both side by side.
- Build a row-based P&L model: Use Row Model builder to construct a P&L hierarchy from scratch, starting from Net Profit and layering in Gross Profit, Net Revenue, COGS, and Operating Expenses as connected nodes.
- Create a multi-dimensional plan: Build a Regional Plan, a Product Plan, and a Profitability sheet. Use Cube measures to allocate values across dimensions automatically and keep all three sheets in sync.
Sample dataset
The planning sheet tutorial uses the Northwind_FMCG.pbix dataset. The dataset includes three fact tables that share a common date dimension:
- Sales Transactions - revenue and cost actuals at geography and product level.
- P&L Measures - driver-level measures for key financial metrics, including sales volume, Avg selling price, COGS components, and operating expenses.
- P&L Rows - P&L line items structured as rows, with cost data at the individual line-item level
Set up the planning environment
In this section, you import the sample dataset, create a Fabric SQL database, build the Plan app, and connect both the semantic model and the database, so the planning sheet is ready for input and collaboration.
Import the dataset
In this step, you import the Northwind_FMCG semantic model into your Fabric workspace. You use this semantic model throughout the planning sheet tutorial.
Go to app.fabric.microsoft.com and sign in.
Navigate to your training workspace. Select New folder, enter the folder name, and select Create.
Open the folder. Select Import > Report, Paginated Report or Workbook > From this computer.
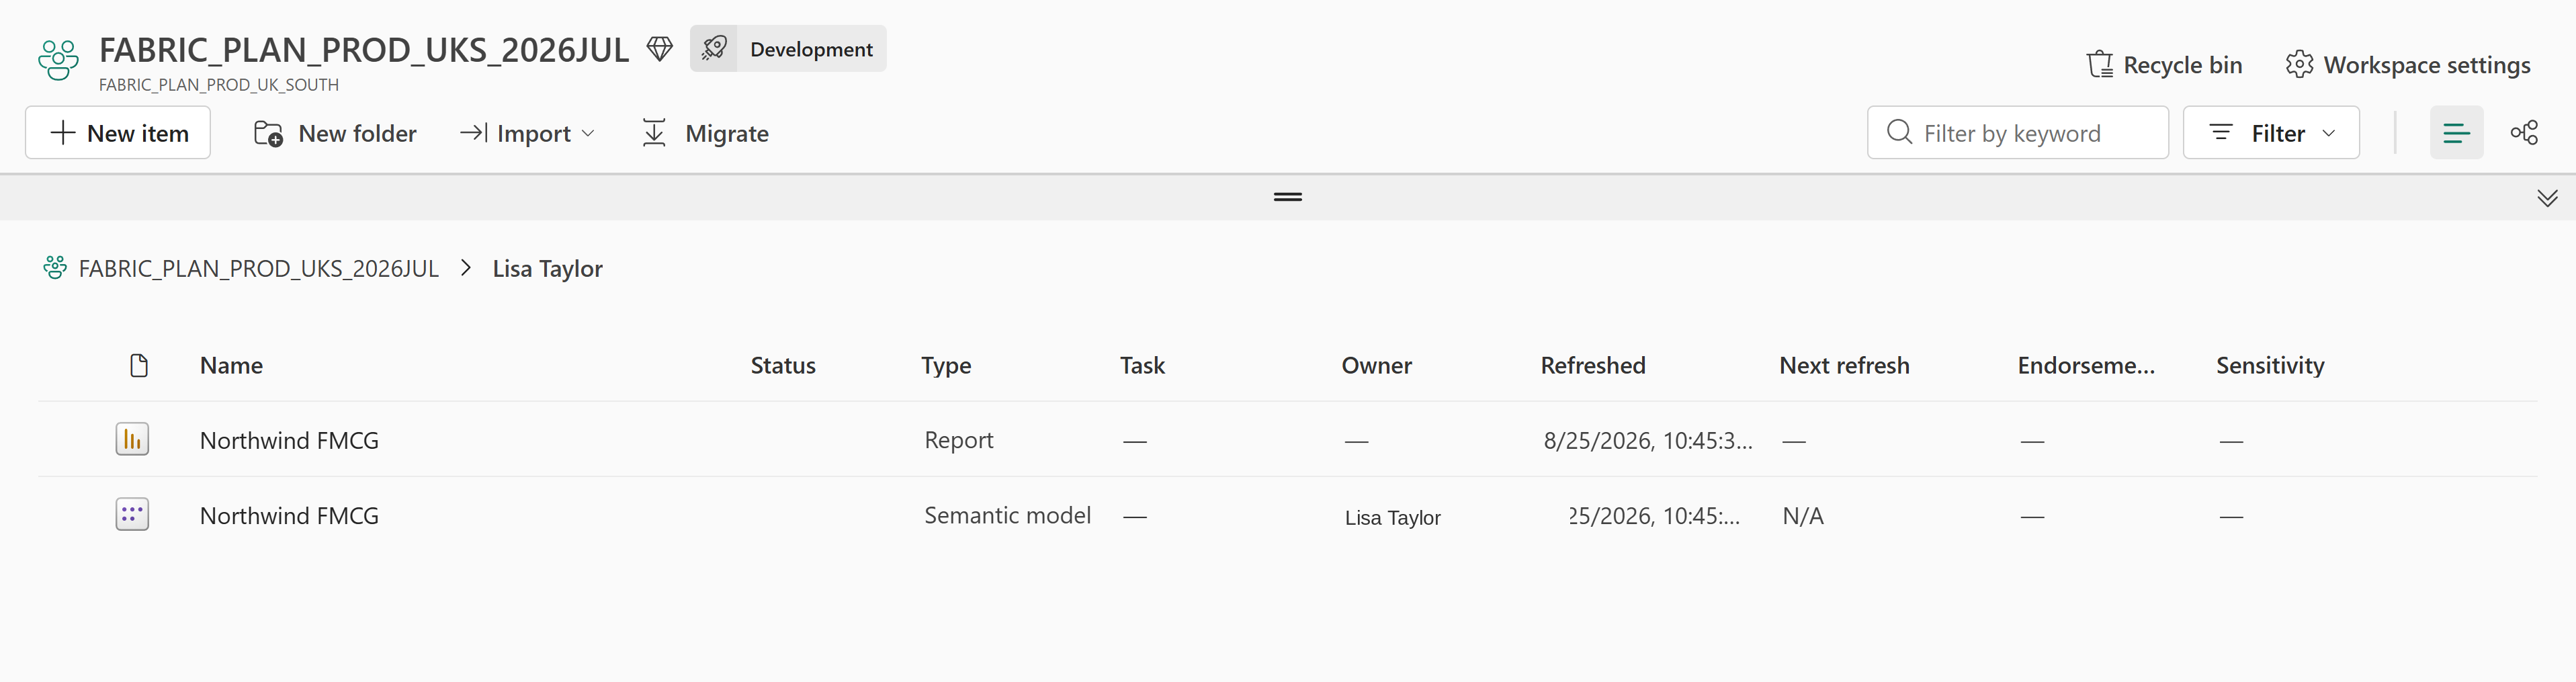
Select Northwind_FMCG.pbix and select Open. The report and semantic model appear in your folder.
Tip
A warning stating "Refresh failed due to missing data source credentials" might appear. Ignore this warning—the data is fully available, and the planning sheet connects correctly.
Create the SQL database
In this step, you create a Fabric SQL database in your workspace. This database becomes the writeback destination for your forecast and plan data.
Select New item, search for SQL database, and select it.
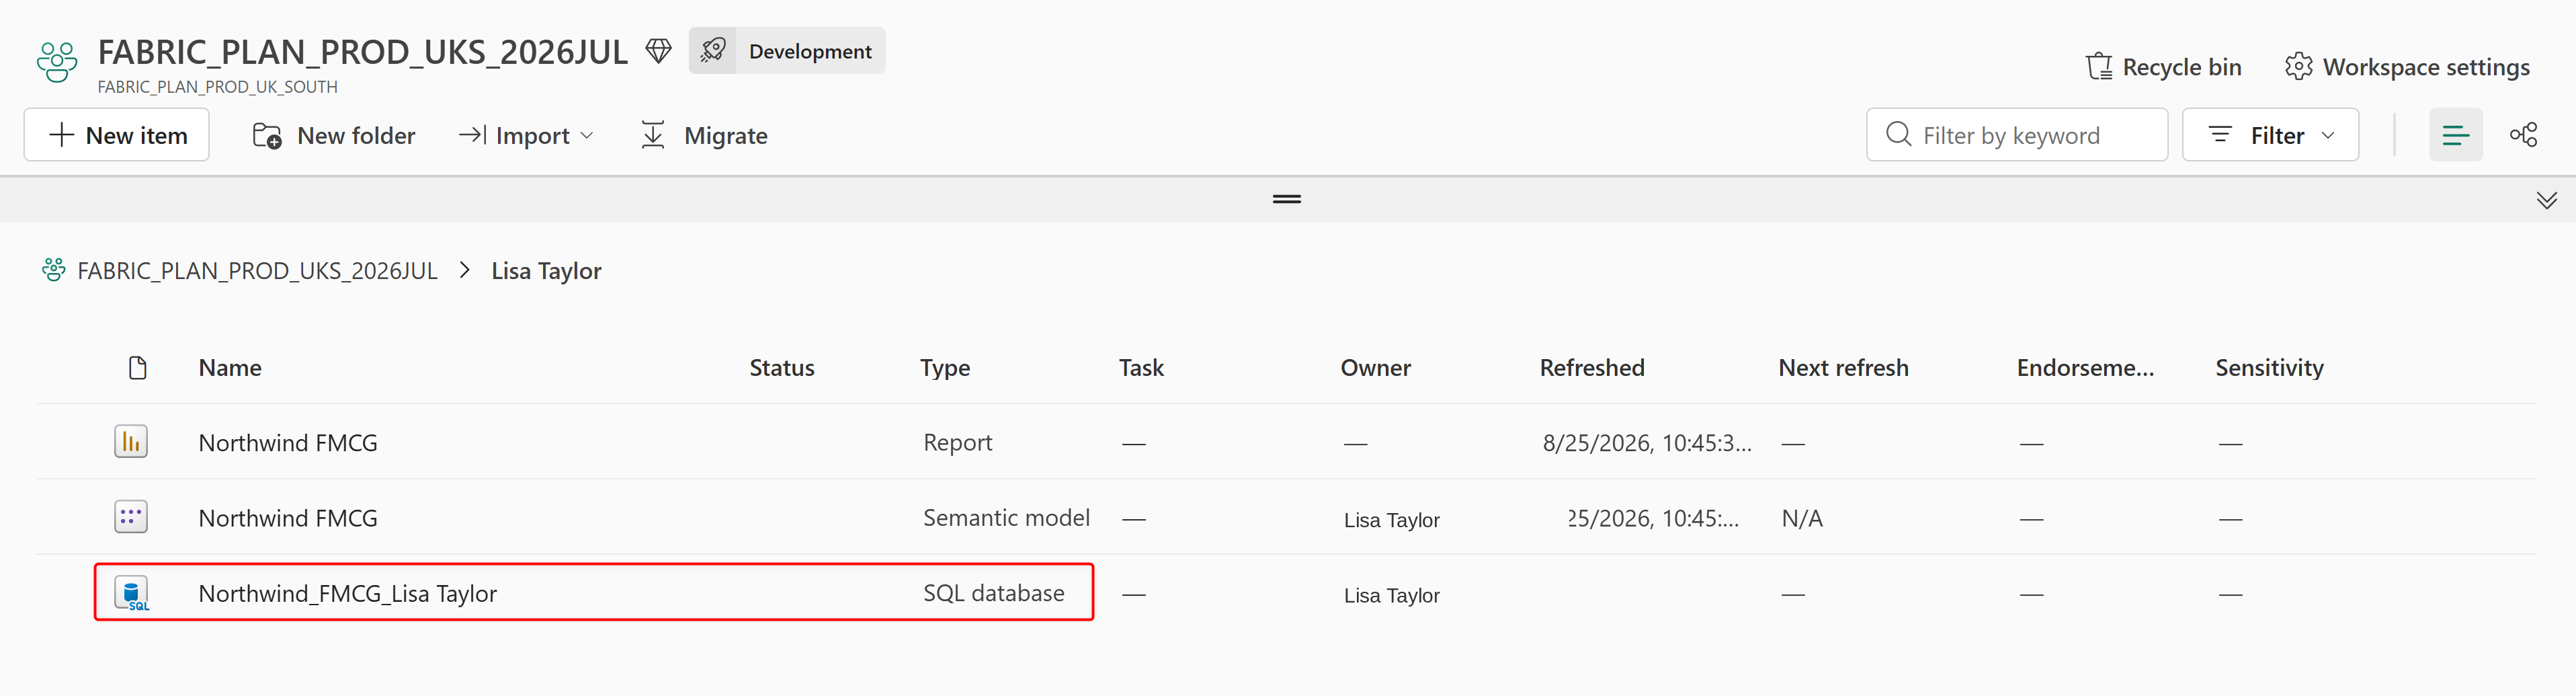
Enter Northwind_FMCG followed by your name as a suffix - for example, Northwind_FMCG_Lisa Taylor and select Create. The database is created in your folder.
Create the Plan app
In this step, you create the Plan app that hosts your planning sheets. This app is where you configure connections, build sheets, and collaborate on the plan.
Select New item, search for Plan, and select it.
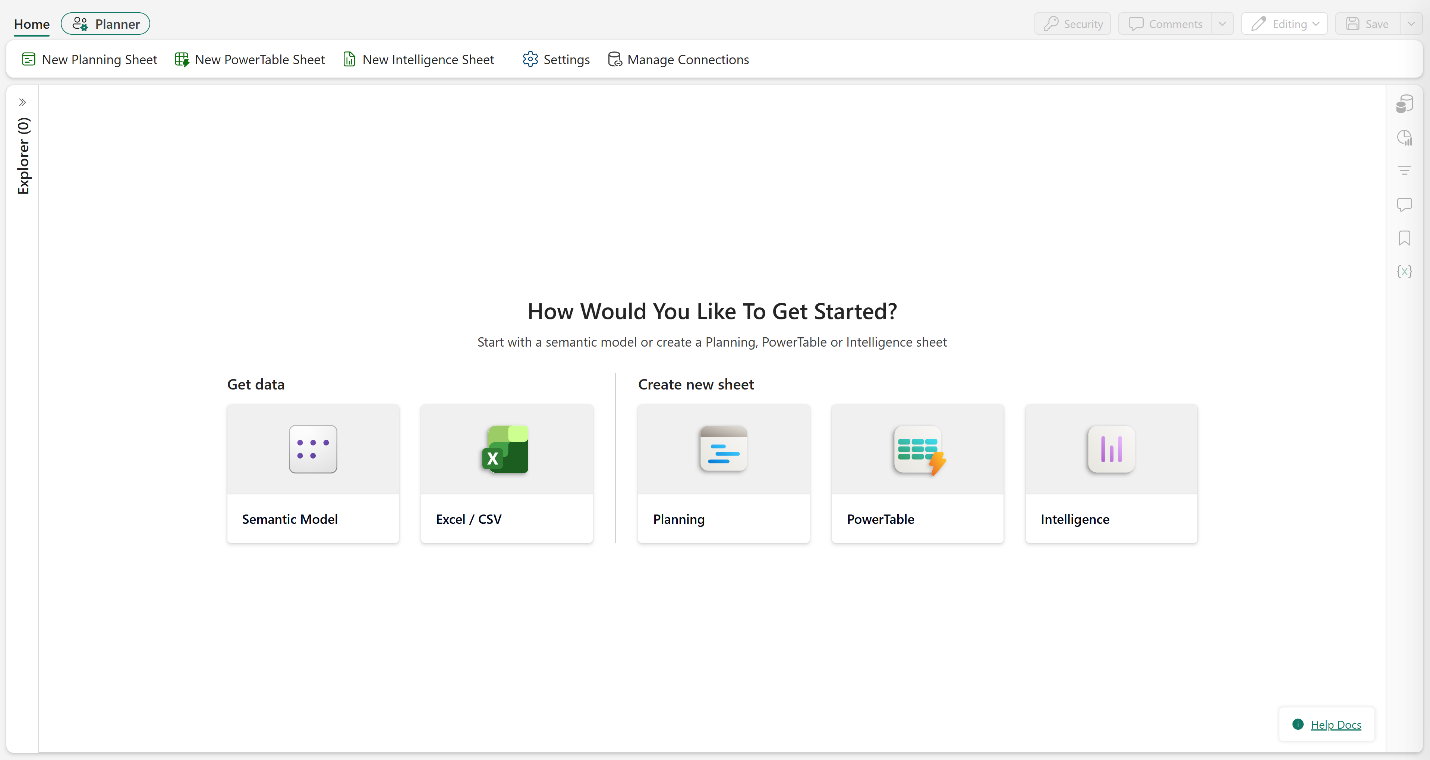
Enter Northwind_FMCG_Plan in the Name field and select Create. Fabric planning opens, and you see the launch screen.
Connect to the semantic model
In this step, you connect the Northwind FMCG semantic model to the Plan app through a semantic model connection. This connection makes the model's dimensions, measures, and date table available for planning.
On the launch screen, select Semantic Model.
In the semantic model connection window, select Create Connection.
In the connection list, select Create a new connection.
Enter Northwind_FMCG as the connection name. Your account identifier is added automatically. Select Sign in, authenticate, and select Create.
Confirm the new connection is selected. In the Semantic model field, select Northwind FMCG and select Add.
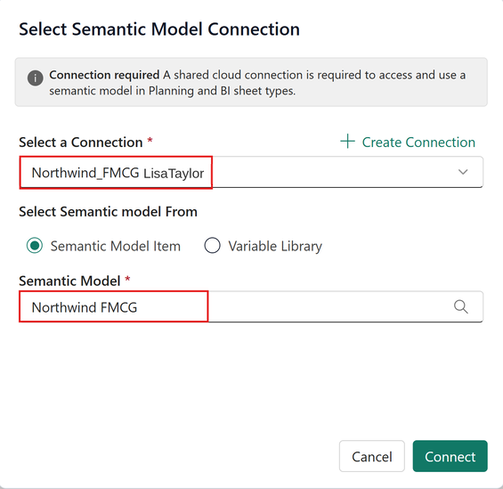
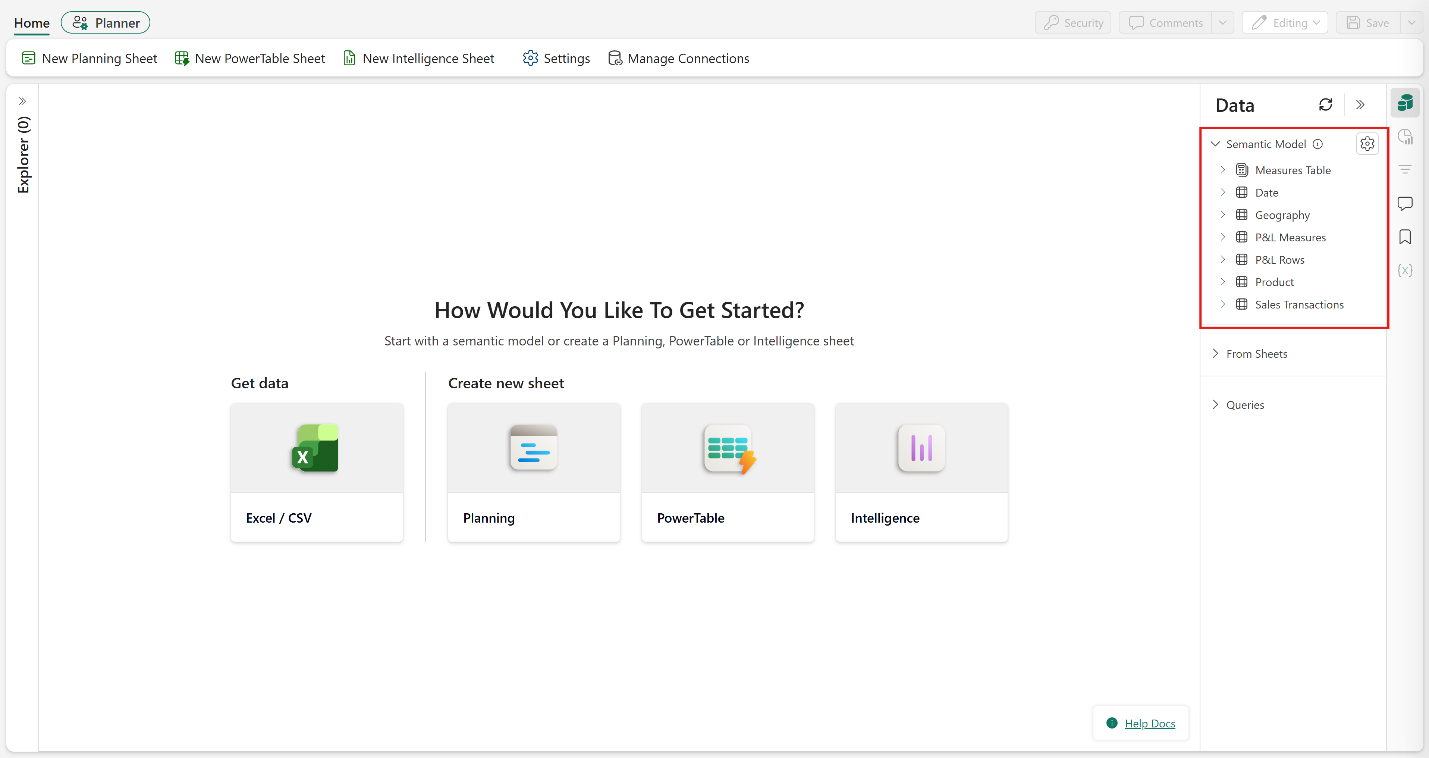
Select Connect. The Northwind FMCG tables appear in the Data tab—dimensions, measures, and the date table are ready for planning.
Create a planning sheet
In this step, you create your first planning sheet and assign rows, columns, and values from the semantic model. This sheet is the foundation where you build the revenue target and plan on.
In the Home ribbon, select New Planning Sheet. Enter Plan Intro as the name and select Create.
Configure the field assignments as follows:
Field Value Rows Region → Category → Sub-Category Columns Date hierarchy—Year, Quarter, Month Short Values 2025 Gross Revenue (From Measures table) 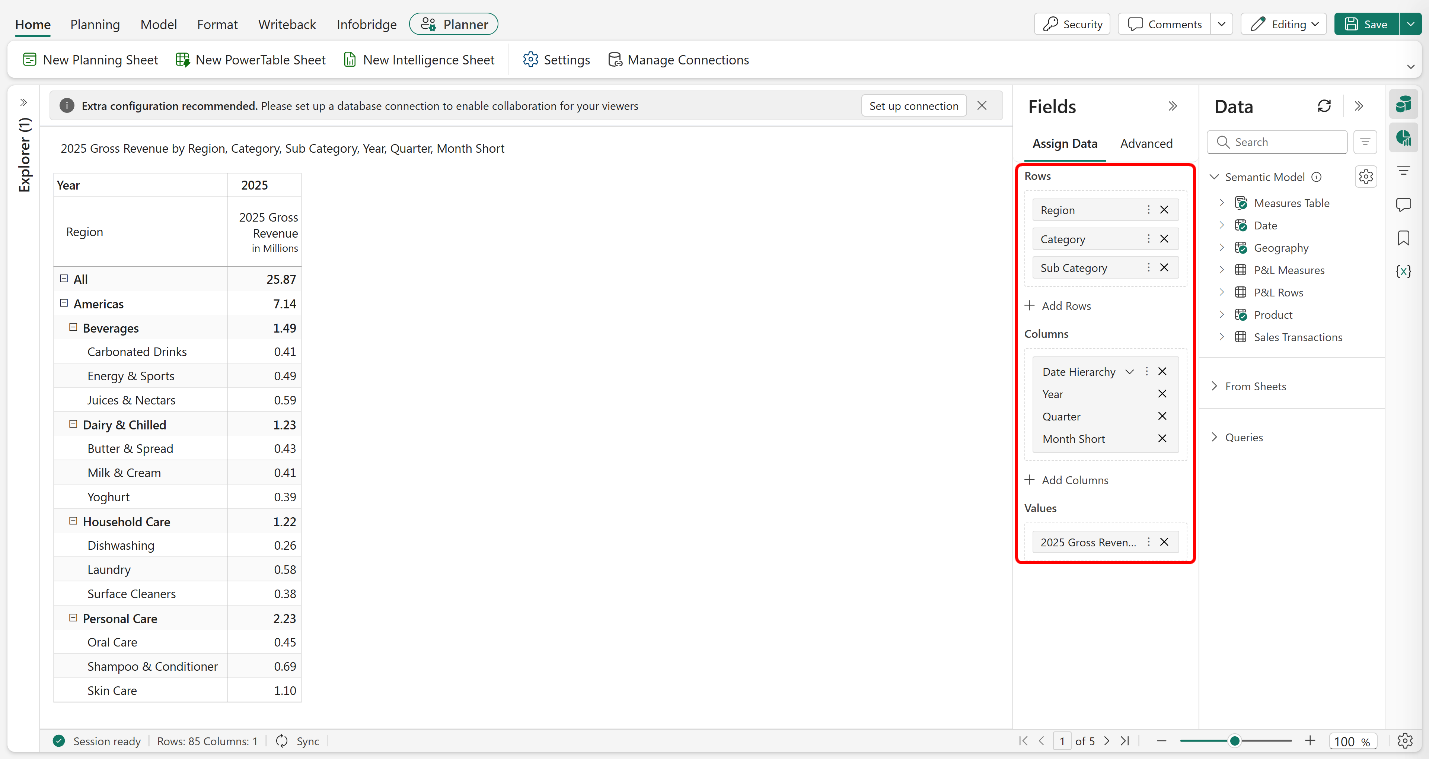
Connect to the SQL database
In this step, you create a Fabric SQL connection and connect planning to a SQL database. Planning maintains this database internally. Connect to the database to collaborate — it saves and enables you to share the plan. Set up the database after you build the planning sheet.
In the top-right corner, select Set up connection.
In Fabric SQL connection, select Create connection.
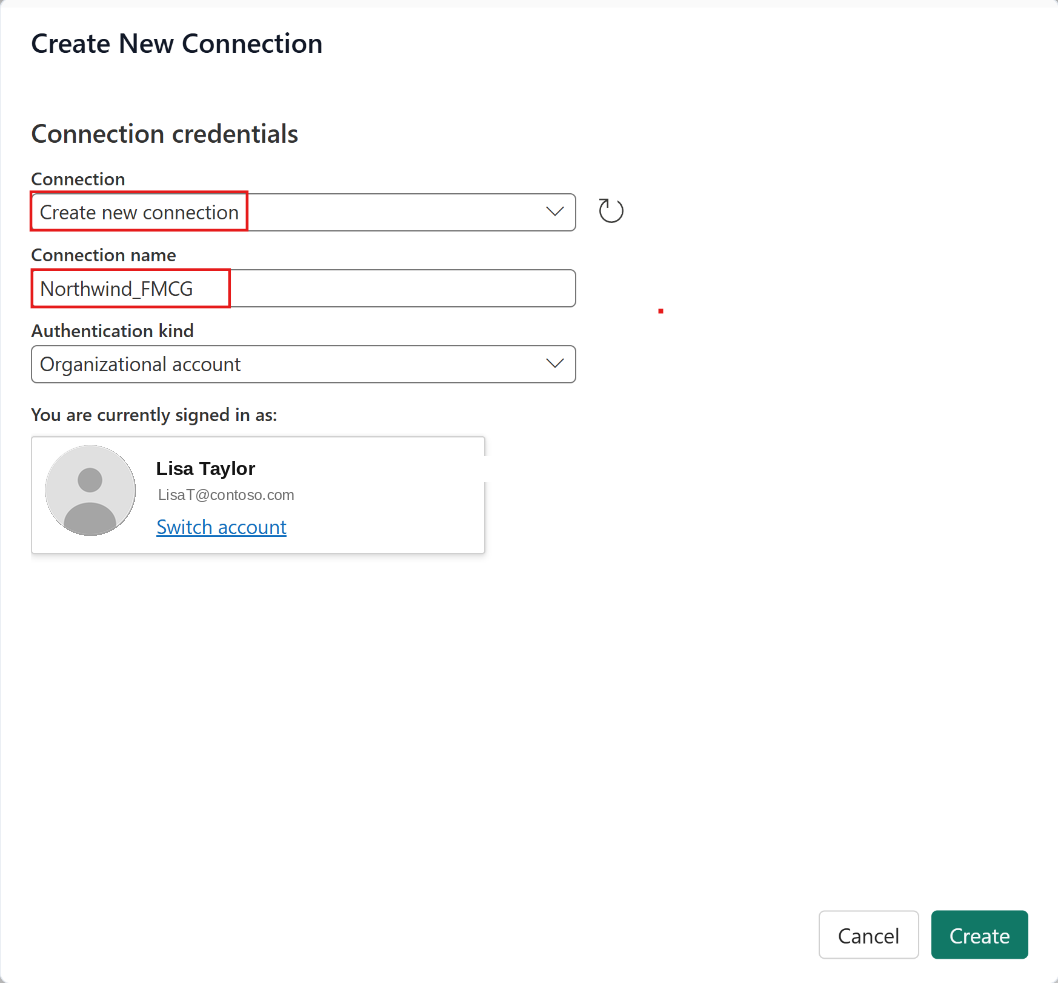
In the connection list, select Create new connection. Enter Northwind_FMCG as the connection name and select Create.
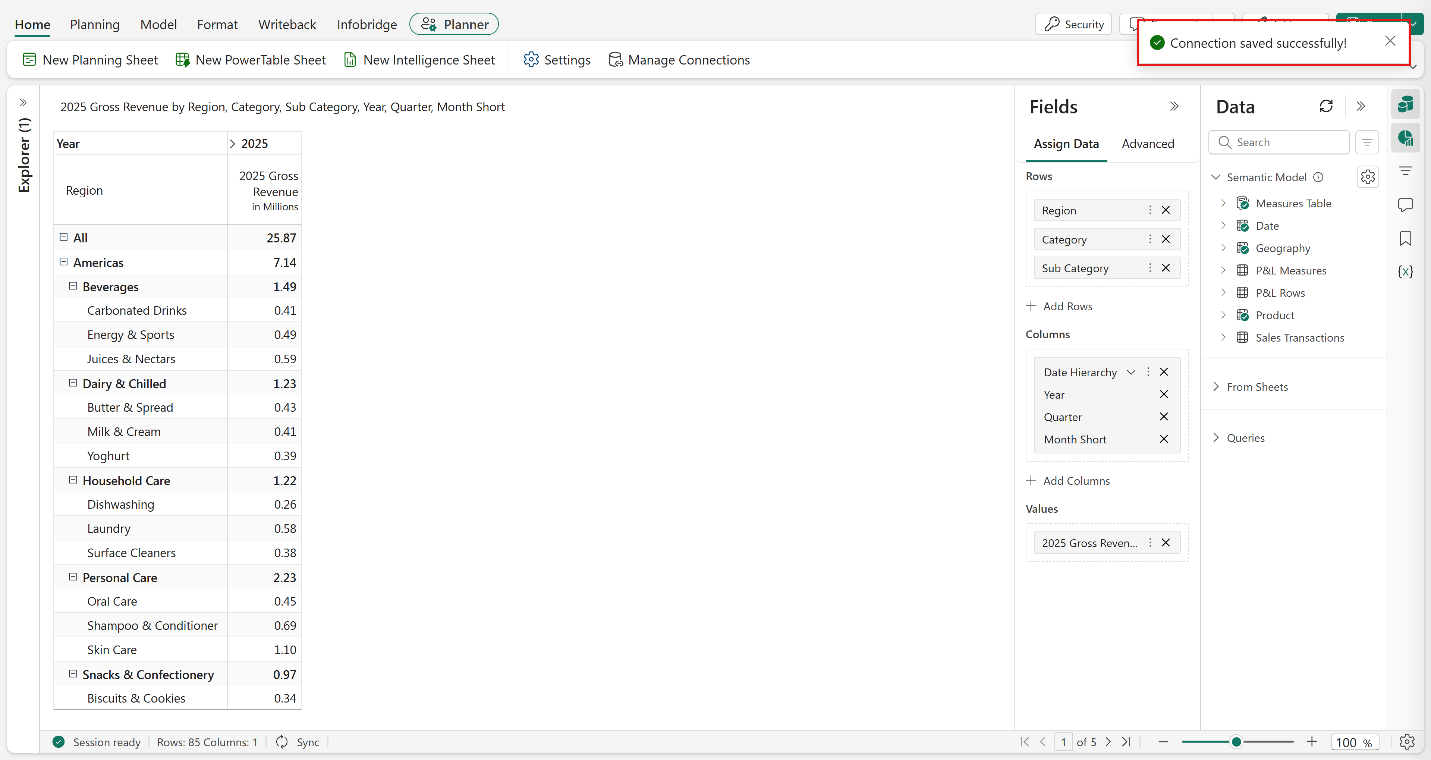
Confirm the connection is selected and select Connect. The Plan app is ready for collaboration.
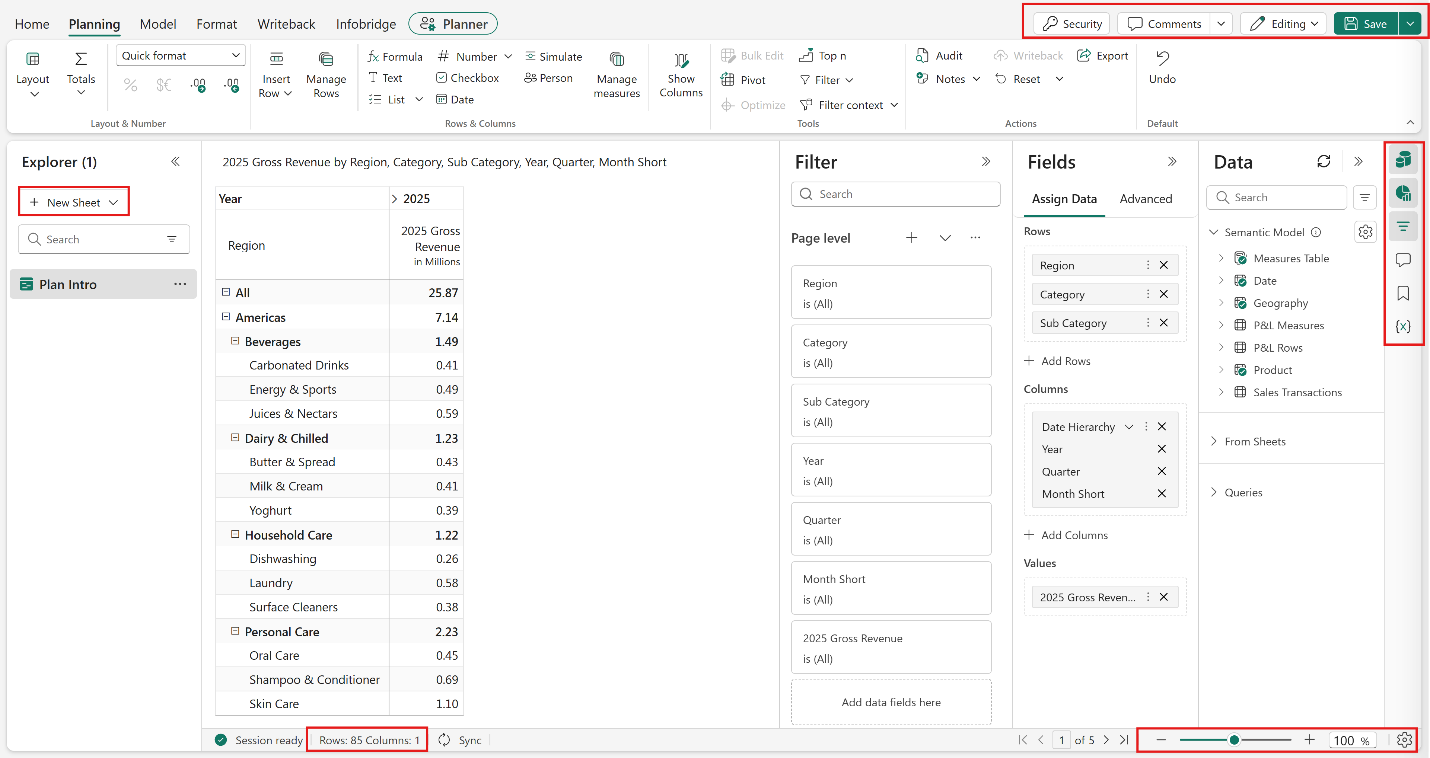
Explore the planning interface
Before entering plan data, take a few minutes to get familiar with the ribbons, panels, and controls you'll use throughout this tutorial series.
Select the down arrow in the top right to expand the full ribbon view. Review what each ribbon contains:
- Home: Add new planning, PowerTable, or intelligence sheets
- Planning: Layout options, formatting, bulk edit, pivot, filters, audit log
- Model: Forecasts, scenarios, driver-based models, cube
- Format: Conditional and semantic formatting
- Writeback: Write back data to destinations, manage settings, view logs
In the header, select each icon to review the available controls: Security, Comments, Editing/Reading View, and Save.
Select the arrow on the left to expand the Explorer pane. Use it to add sheets, manage sheets, and navigate between them.
In the sidebar on the right, select each icon to open the panels: Data, Fields, Filter, Comments, and Bookmarks.
In the footer, select the Rows and Columns count to view dimension and measure statistics. Use the zoom slider to adjust the canvas, and select the Settings icon to configure rows per page.
Next steps
You imported data from a semantic model and created a planning sheet. Allocate values, add comments, and set up an approval workflow in the next tutorial, Allocation and collaboration