Note
Access to this page requires authorization. You can try signing in or changing directories.
Access to this page requires authorization. You can try changing directories.
Planning provides writeback logging as soon as you start a writeback operation. You can review logs from Logs under the Writeback tab.
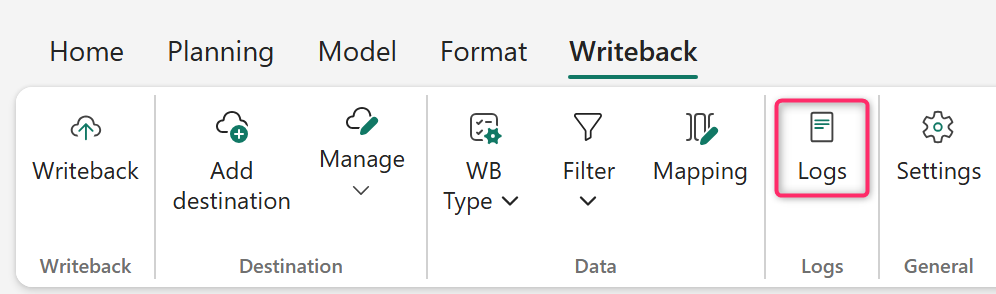
Filter writeback logs
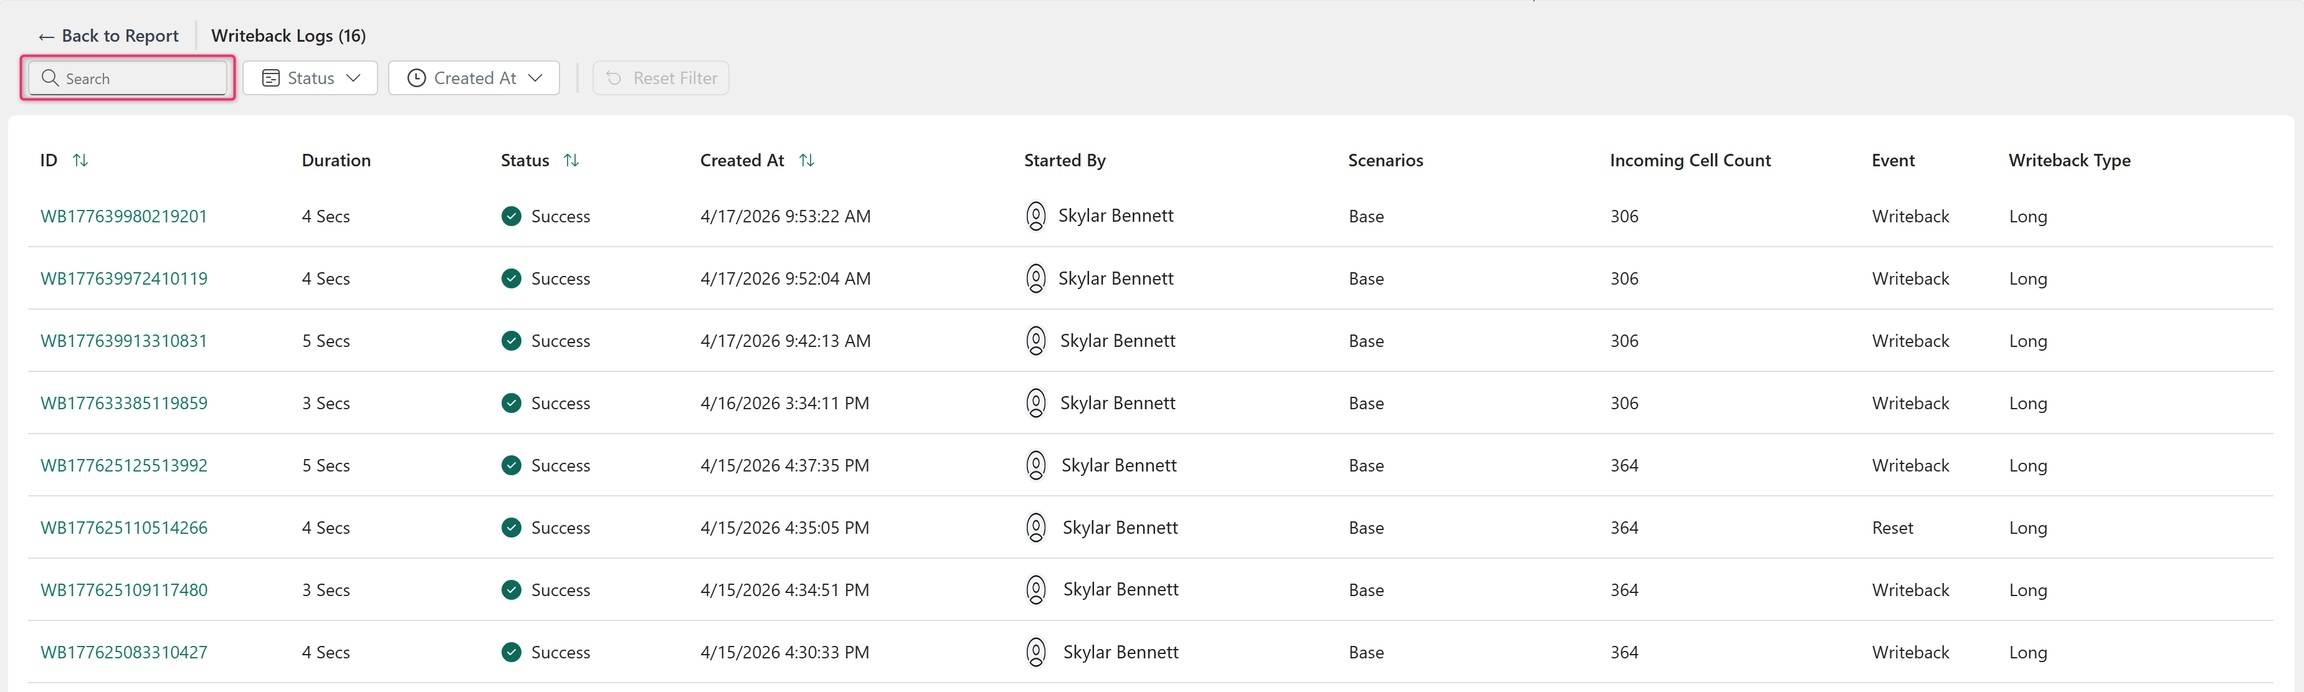
Search logs
Use the search bar to find logs by ID.
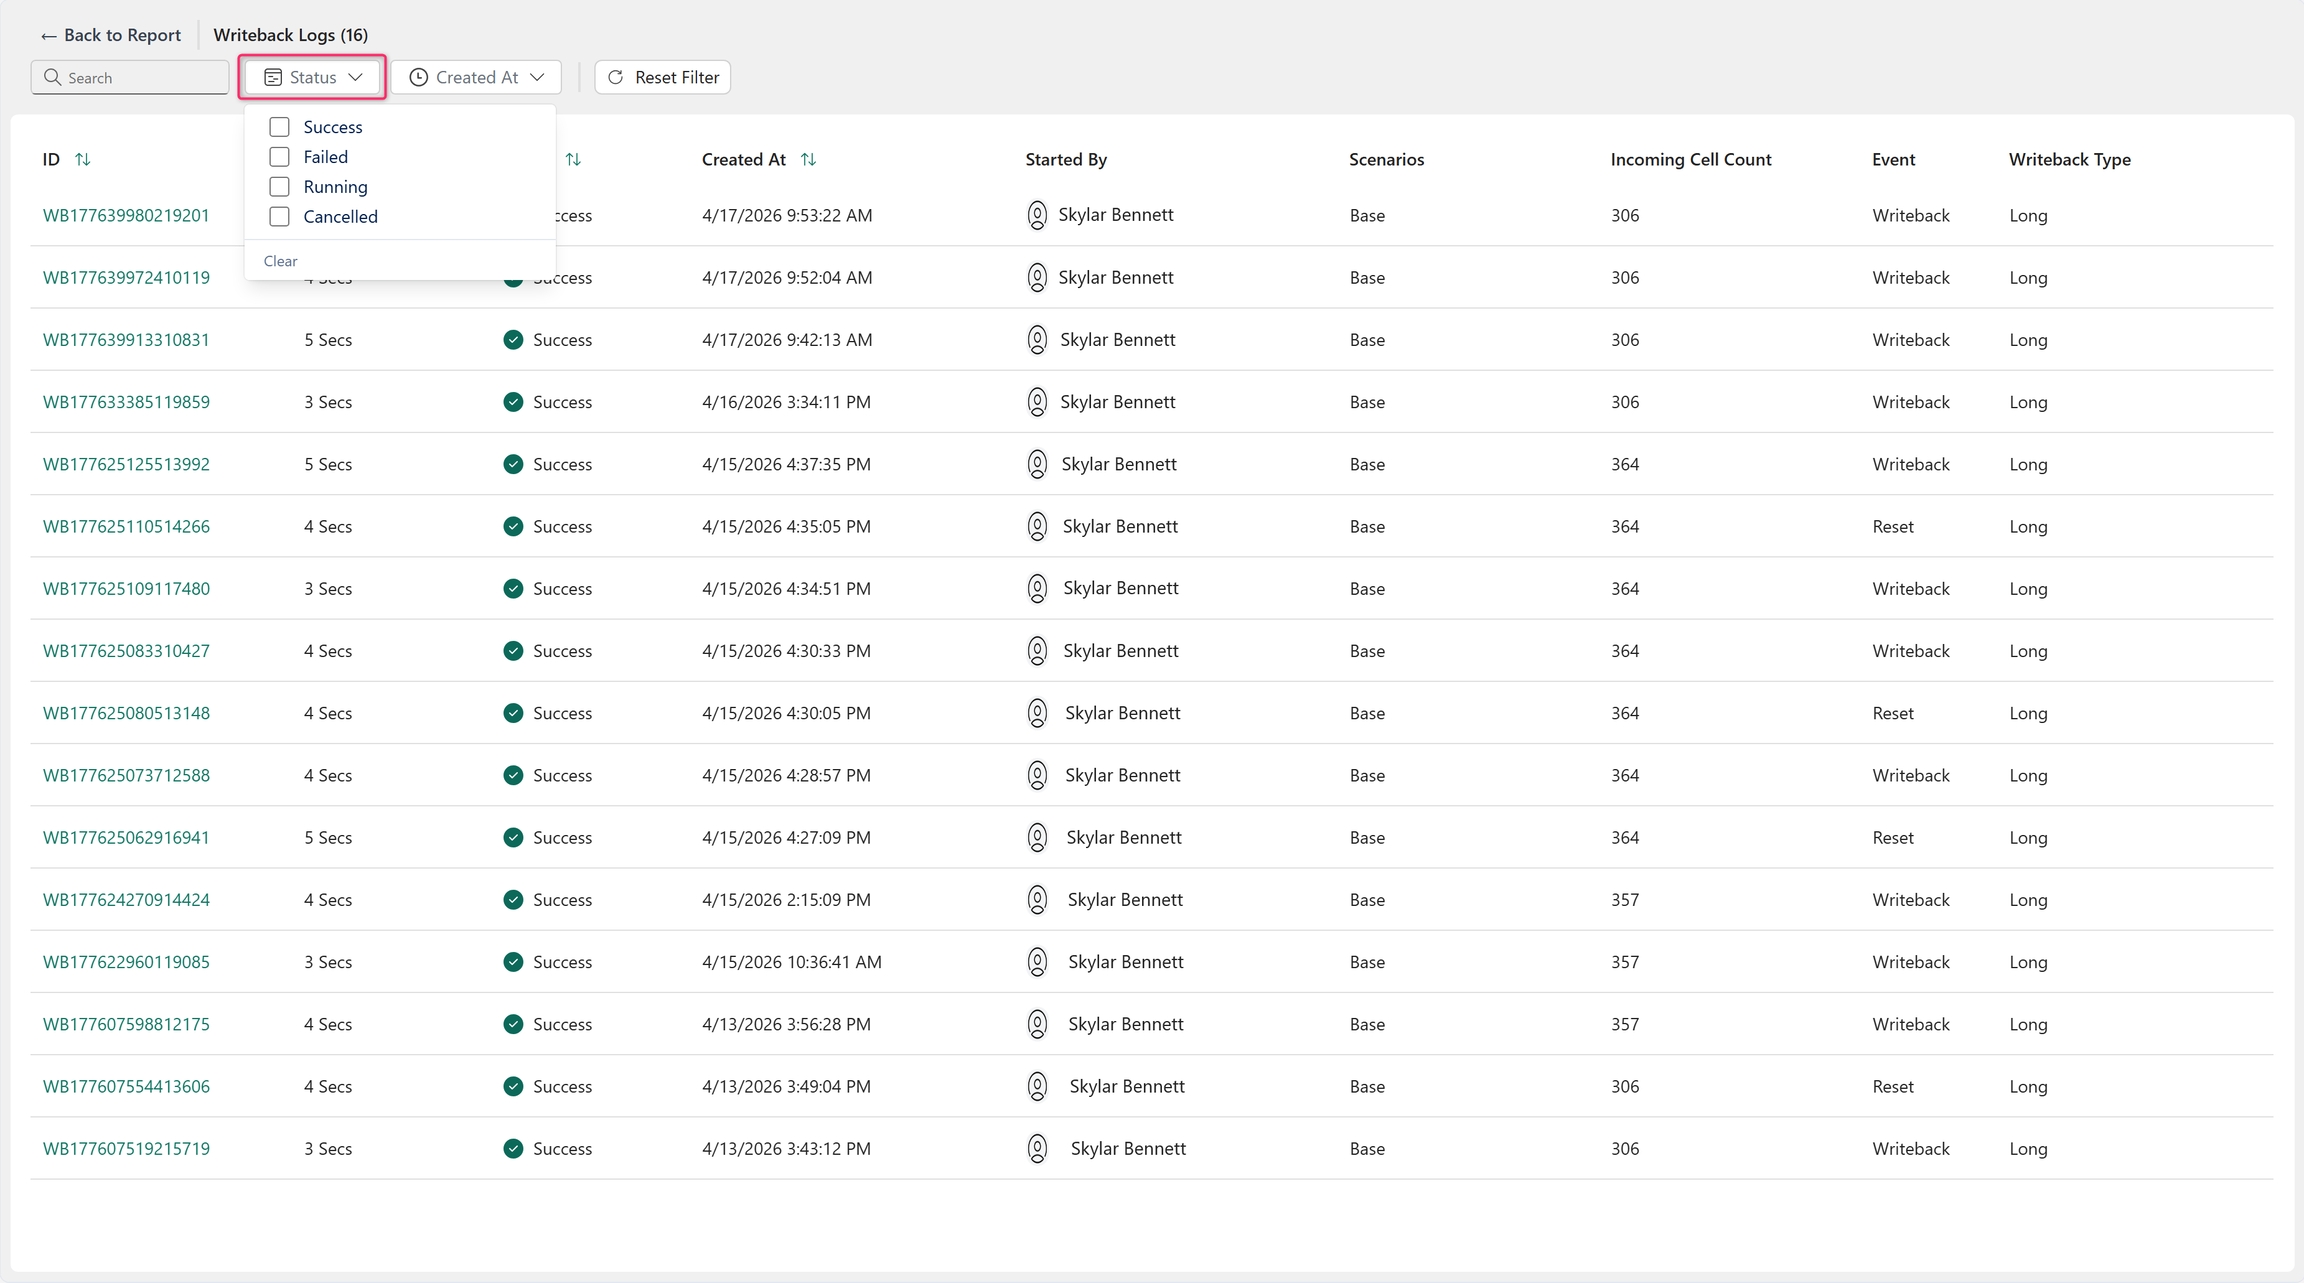
Filter by status
Select Status to filter logs by the execution state of the writeback operation. You can filter by Success, Failed, Running, and Cancelled. Multiple statuses can be selected simultaneously.
- Success: This option filters the logs to show only writeback processes that completed without errors.
- Failed: This option filters the logs to display writeback processes that encountered an error and didn't complete successfully.
- Running: This option filters the logs to show writeback processes that are currently executing.
- Cancelled: This option filters the logs to show writeback processes that were explicitly stopped or aborted before completion.
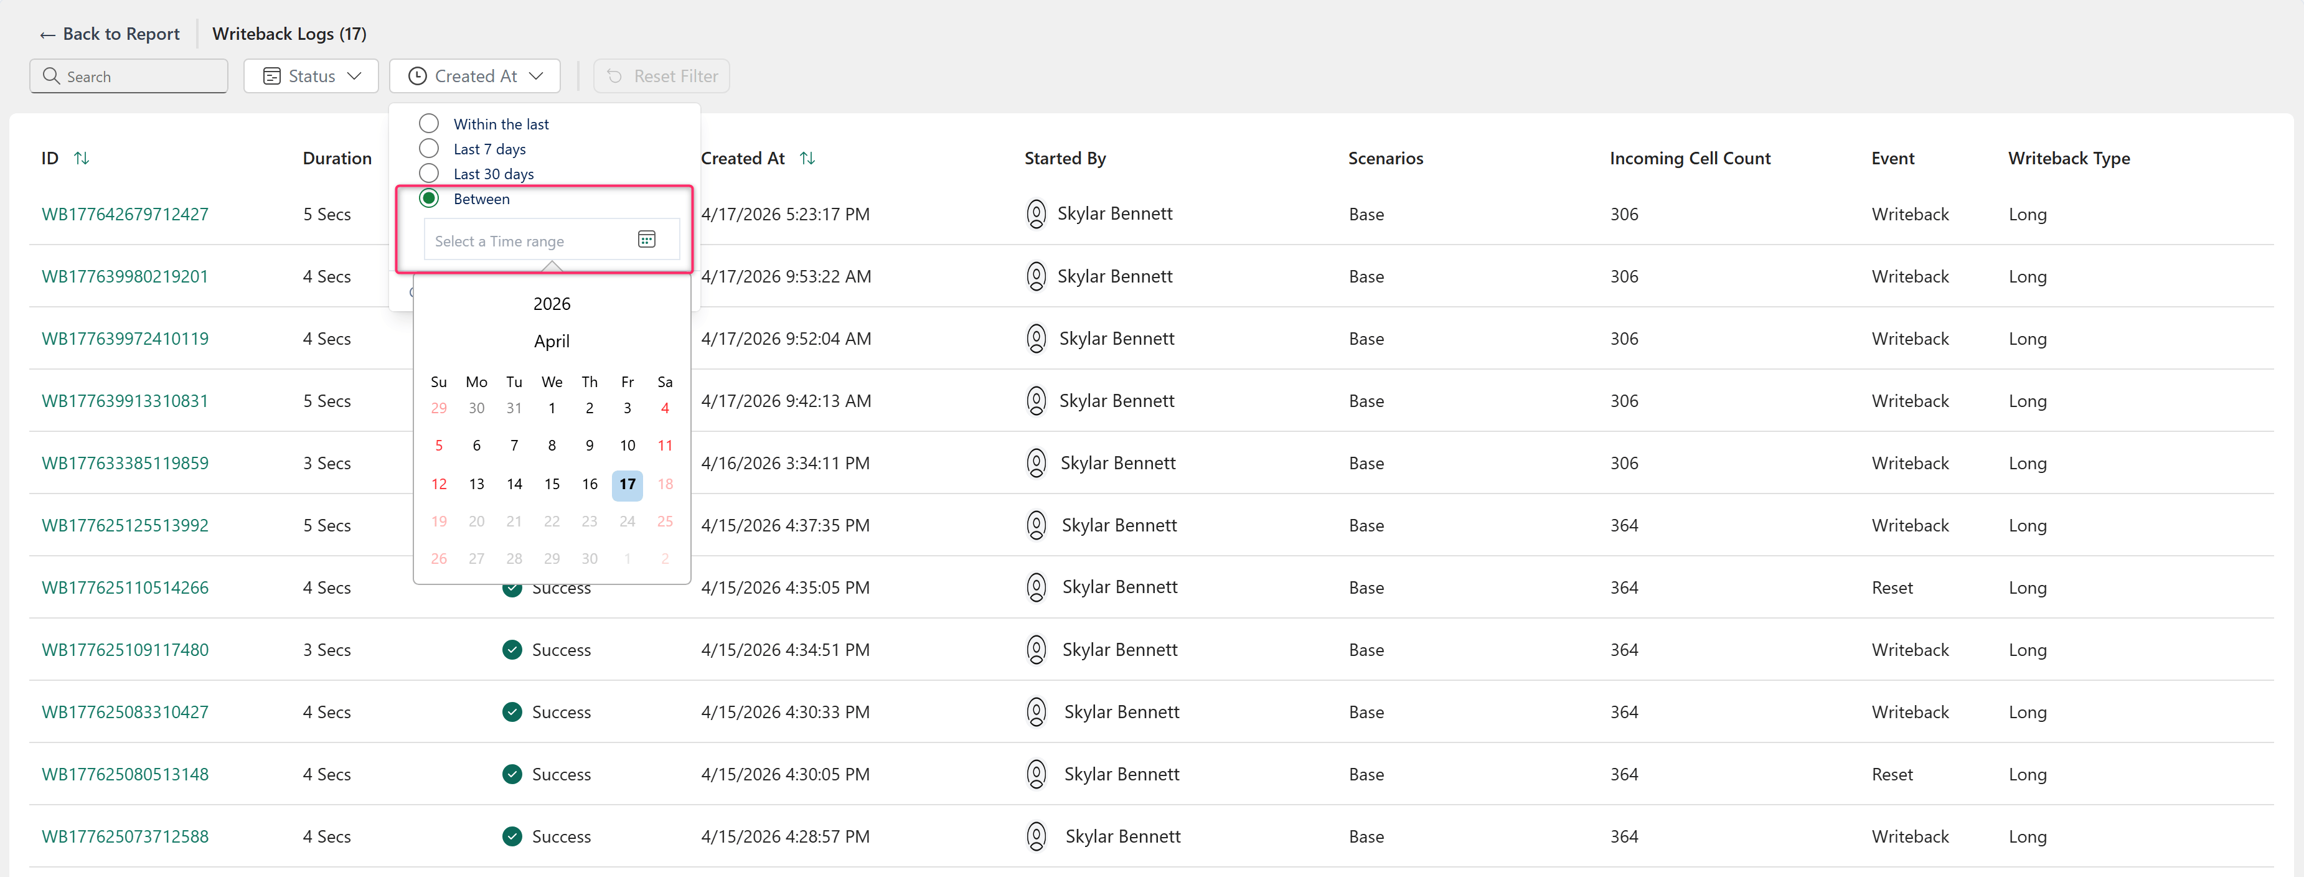
Filter by time
Select Created At to filter logs by when writeback started. You can filter by Within the last, Last 7 days, Last 30 days, and Between.
- Within the last: This option lets you specify the number of hours, minutes, or seconds. The logs are fetched if the writeback start time falls within this period.
- Last 7 days: This option filters the logs within the last 7 days.
- Last 30 days: This option filters the logs that were created in the last 30 days.
- Between: This option lets you specify the starting and ending date within which you can filter your writeback logs.
Reset filter
Select Reset Filter to clear all applied filters.
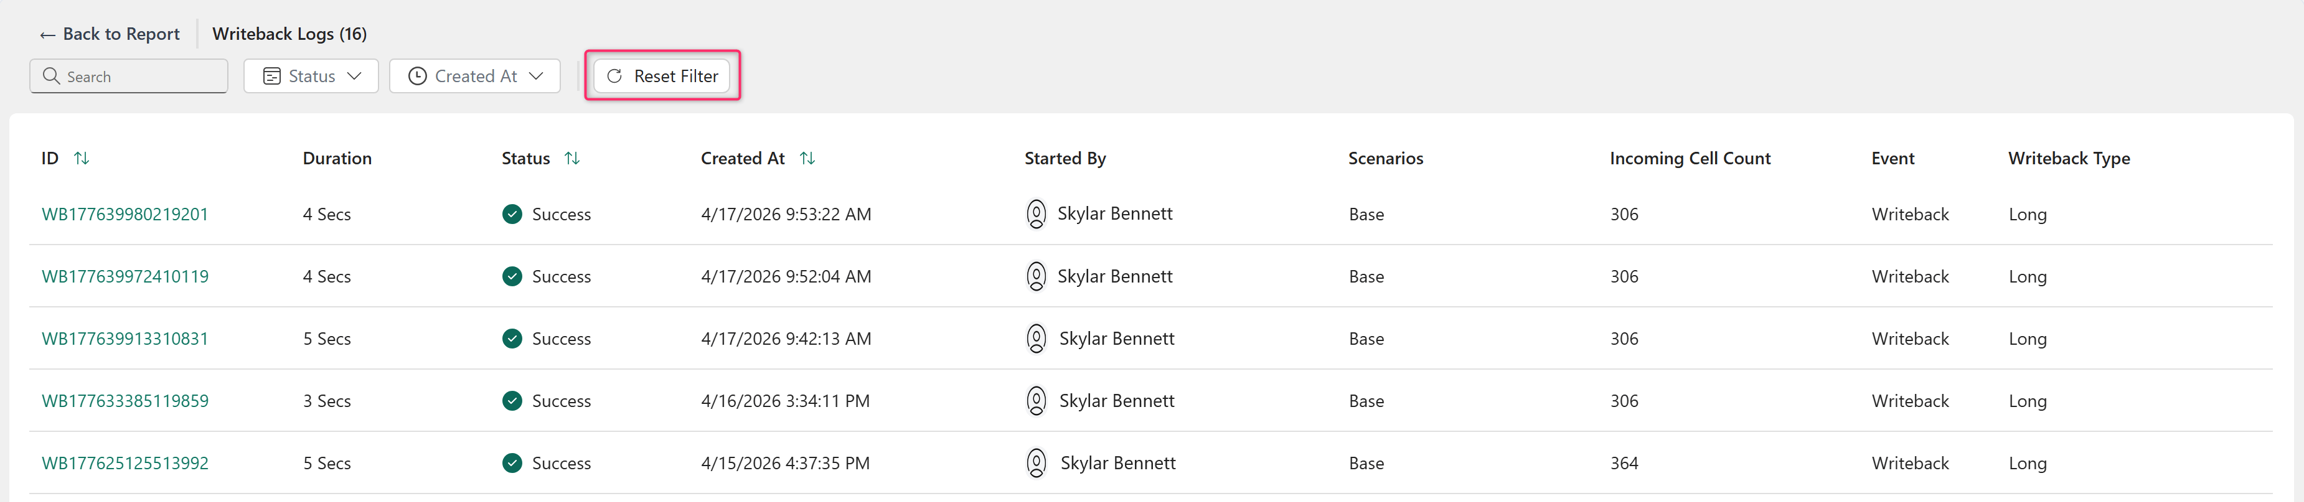
Analyze writeback logs
The writeback logs console displays a list of log columns that help you identify and analyze each writeback.

ID
The ID column displays the unique identifier for each writeback. You can sort this column in ascending or descending order. Selecting the ID opens a detailed summary of the writeback. The General tab includes the summary, and status.
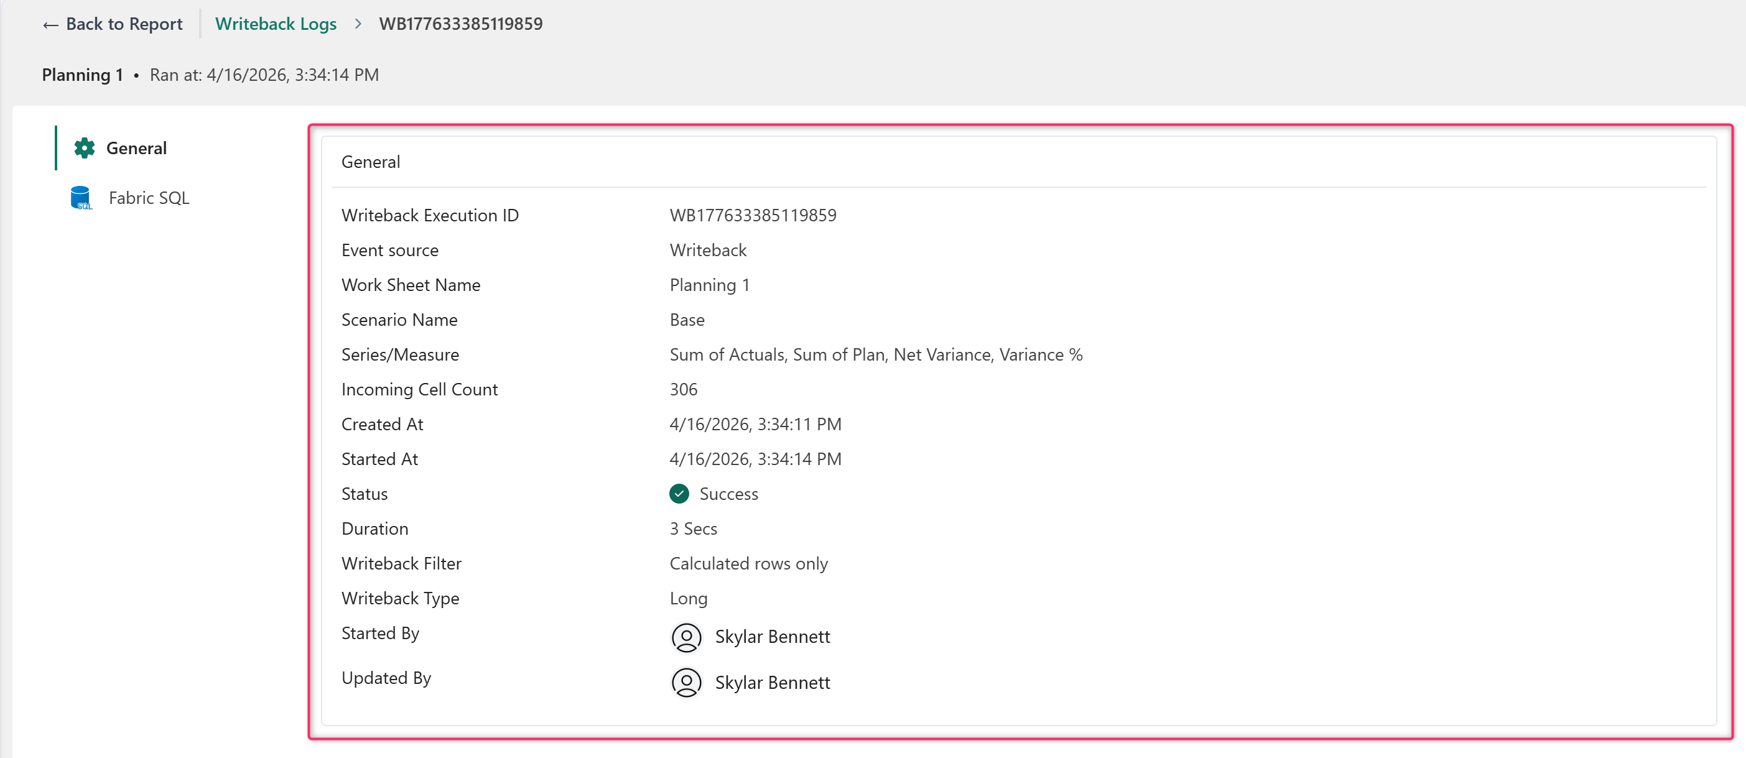
The details pane provides the following information:
- Writeback Execution ID: The unique system generated identifier for this specific writeback operation.
- Event source: The specific action or trigger that initiated the operation (for example, Writeback).
- Work Sheet Name: The name of the report or worksheet from which the data originated.
- Scenario Name: The specific planning scenario associated with the data being written (for example, Base).
- Series/Measure: The specific data points, calculations, or measures included in the writeback payload (for example, Sum of Actuals or Sum of Plan).
- Incoming Cell Count: The total number of individual data cells passed from the source to the writeback engine.
- Created At: The exact date and timestamp when the writeback request was registered by the system.
- Started At: The exact date and timestamp when the processing engine began executing the request.
- Status: The overall outcome of the execution process (for example, Success or Failed).
- Duration: The total time elapsed from the start to the completion of the writeback operation.
- Writeback Filter: The specific data filtering criteria applied to the payload before committing it to the destination (for example, Calculated rows only).
- Writeback Type: The structural format used to write the data to the destination (for example, Long).
- Started By: The user account that initiated the writeback process.
- Updated By: The user account responsible for the most recent update to the process state.
Select Fabric SQL to view the configuration, connection details, and execution outcome of the writeback operation specific to your Microsoft Fabric SQL database destination.
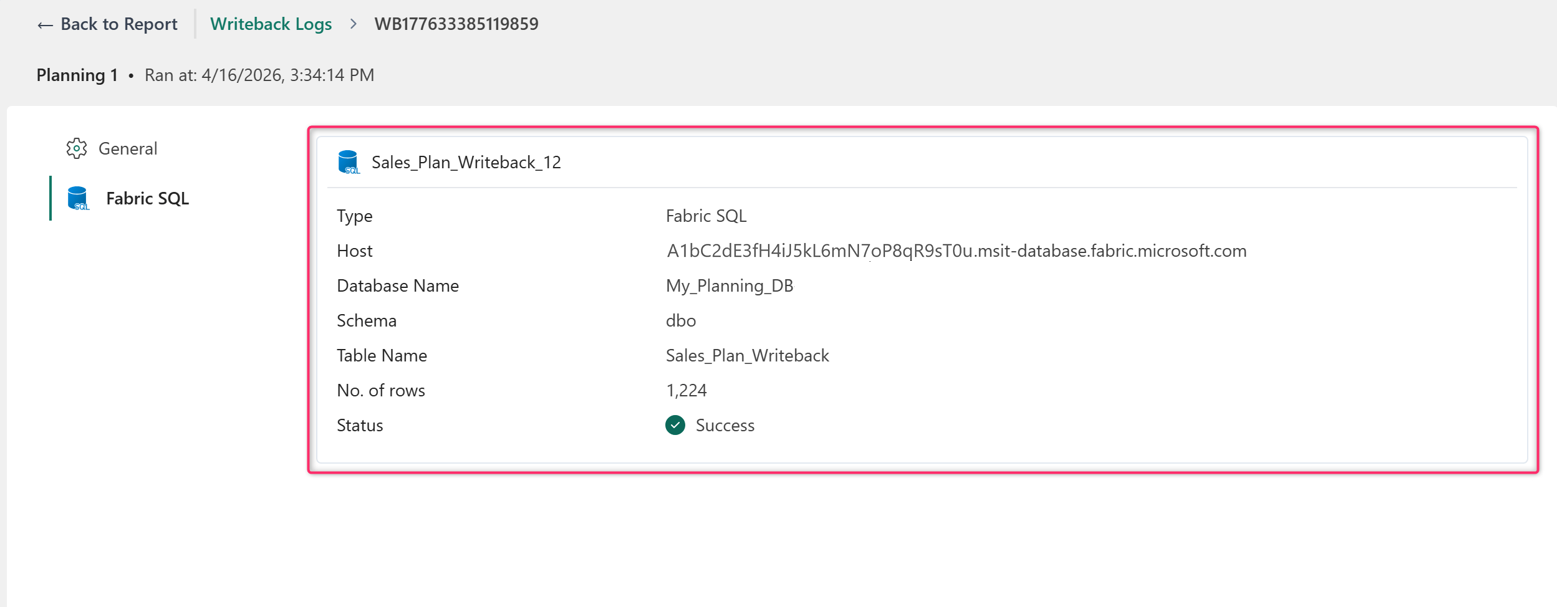
Select the specific destination table entry (for example, Sales_Plan_Writeback_12) to view detailed connection properties and execution metrics for that specific Microsoft Fabric SQL database target.
The details pane provides the following information:
- Type: Identifies the destination platform (Fabric SQL).
- Host: The server endpoint URL used to establish the connection to your Fabric environment.
- Database Name: The target database for the writeback execution.
- Schema: The database schema containing the target table.
- Table Name: The exact table designated to receive the writeback data.
- No. of rows: The total number of rows successfully written to the destination table during this operation.
- Status: Indicates whether the writeback operation to this specific destination succeeded or failed.
Duration
The Duration column displays the total time taken to complete the writeback.
Status
The Status column indicates whether the writeback succeeded or failed. This column can be sorted alphabetically.
Created At
The Created At column displays the date and time when the writeback was initiated. You can sort this column chronologically.
Started By
The Started By column displays the user who started the writeback. You can sort this column alphabetically.
Scenarios
The Scenarios column displays the scenarios included in the writeback. If no scenario was written back, the console shows Base.
Incoming Cell Count
The Incoming Cell Count column displays the number of cells written back from the report.
Event
The Event column displays the type of log entry, such as Writeback or Reset.
Writeback Type
The Writeback Type column displays the format used for the writeback, such as Long.