Note
Access to this page requires authorization. You can try signing in or changing directories.
Access to this page requires authorization. You can try changing directories.
Use the SHOW_VISUAL function to show a visual or visual group in an intelligence sheet. For example, configure a toggle parameter that lets users display a visual when they turn the toggle on.
Syntax
Use the following syntax to show a visual or visual group.
SHOW_VISUAL(visualLabel)
Replace visualLabel with the label of the visual or visual group you want to show. When you reference a visual by its label, use the visual reference syntax supported by the intelligence sheet.
Example
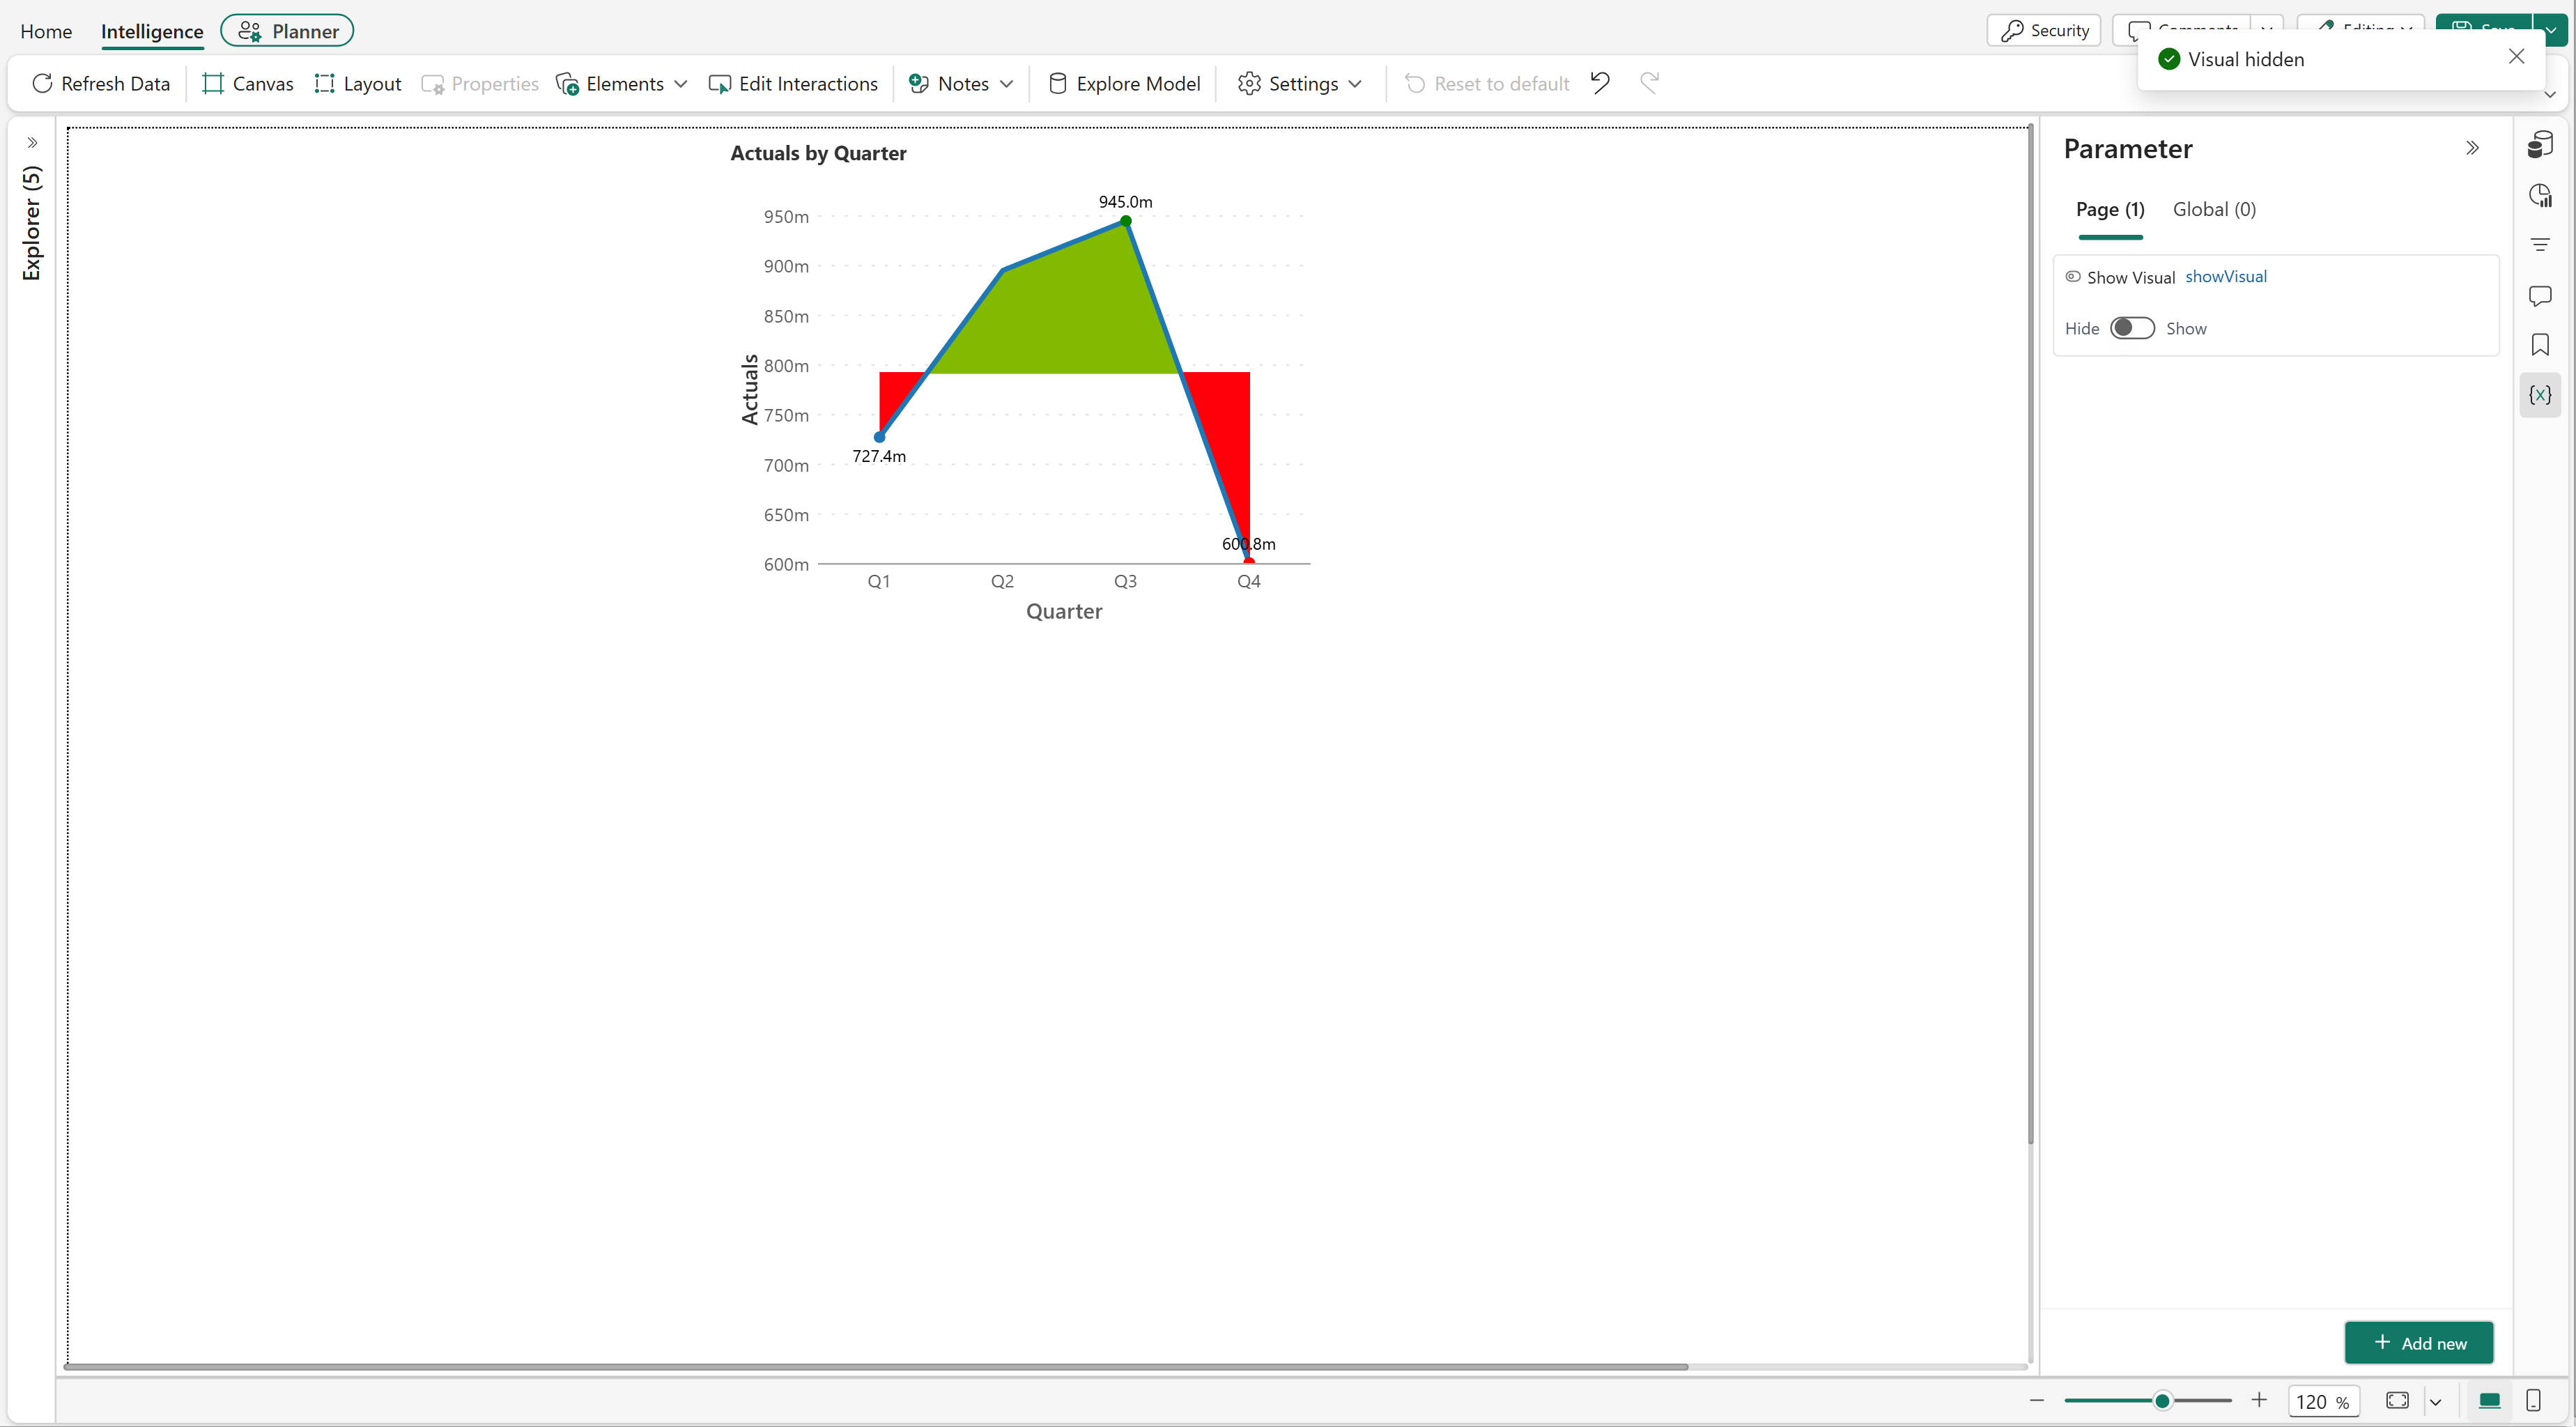
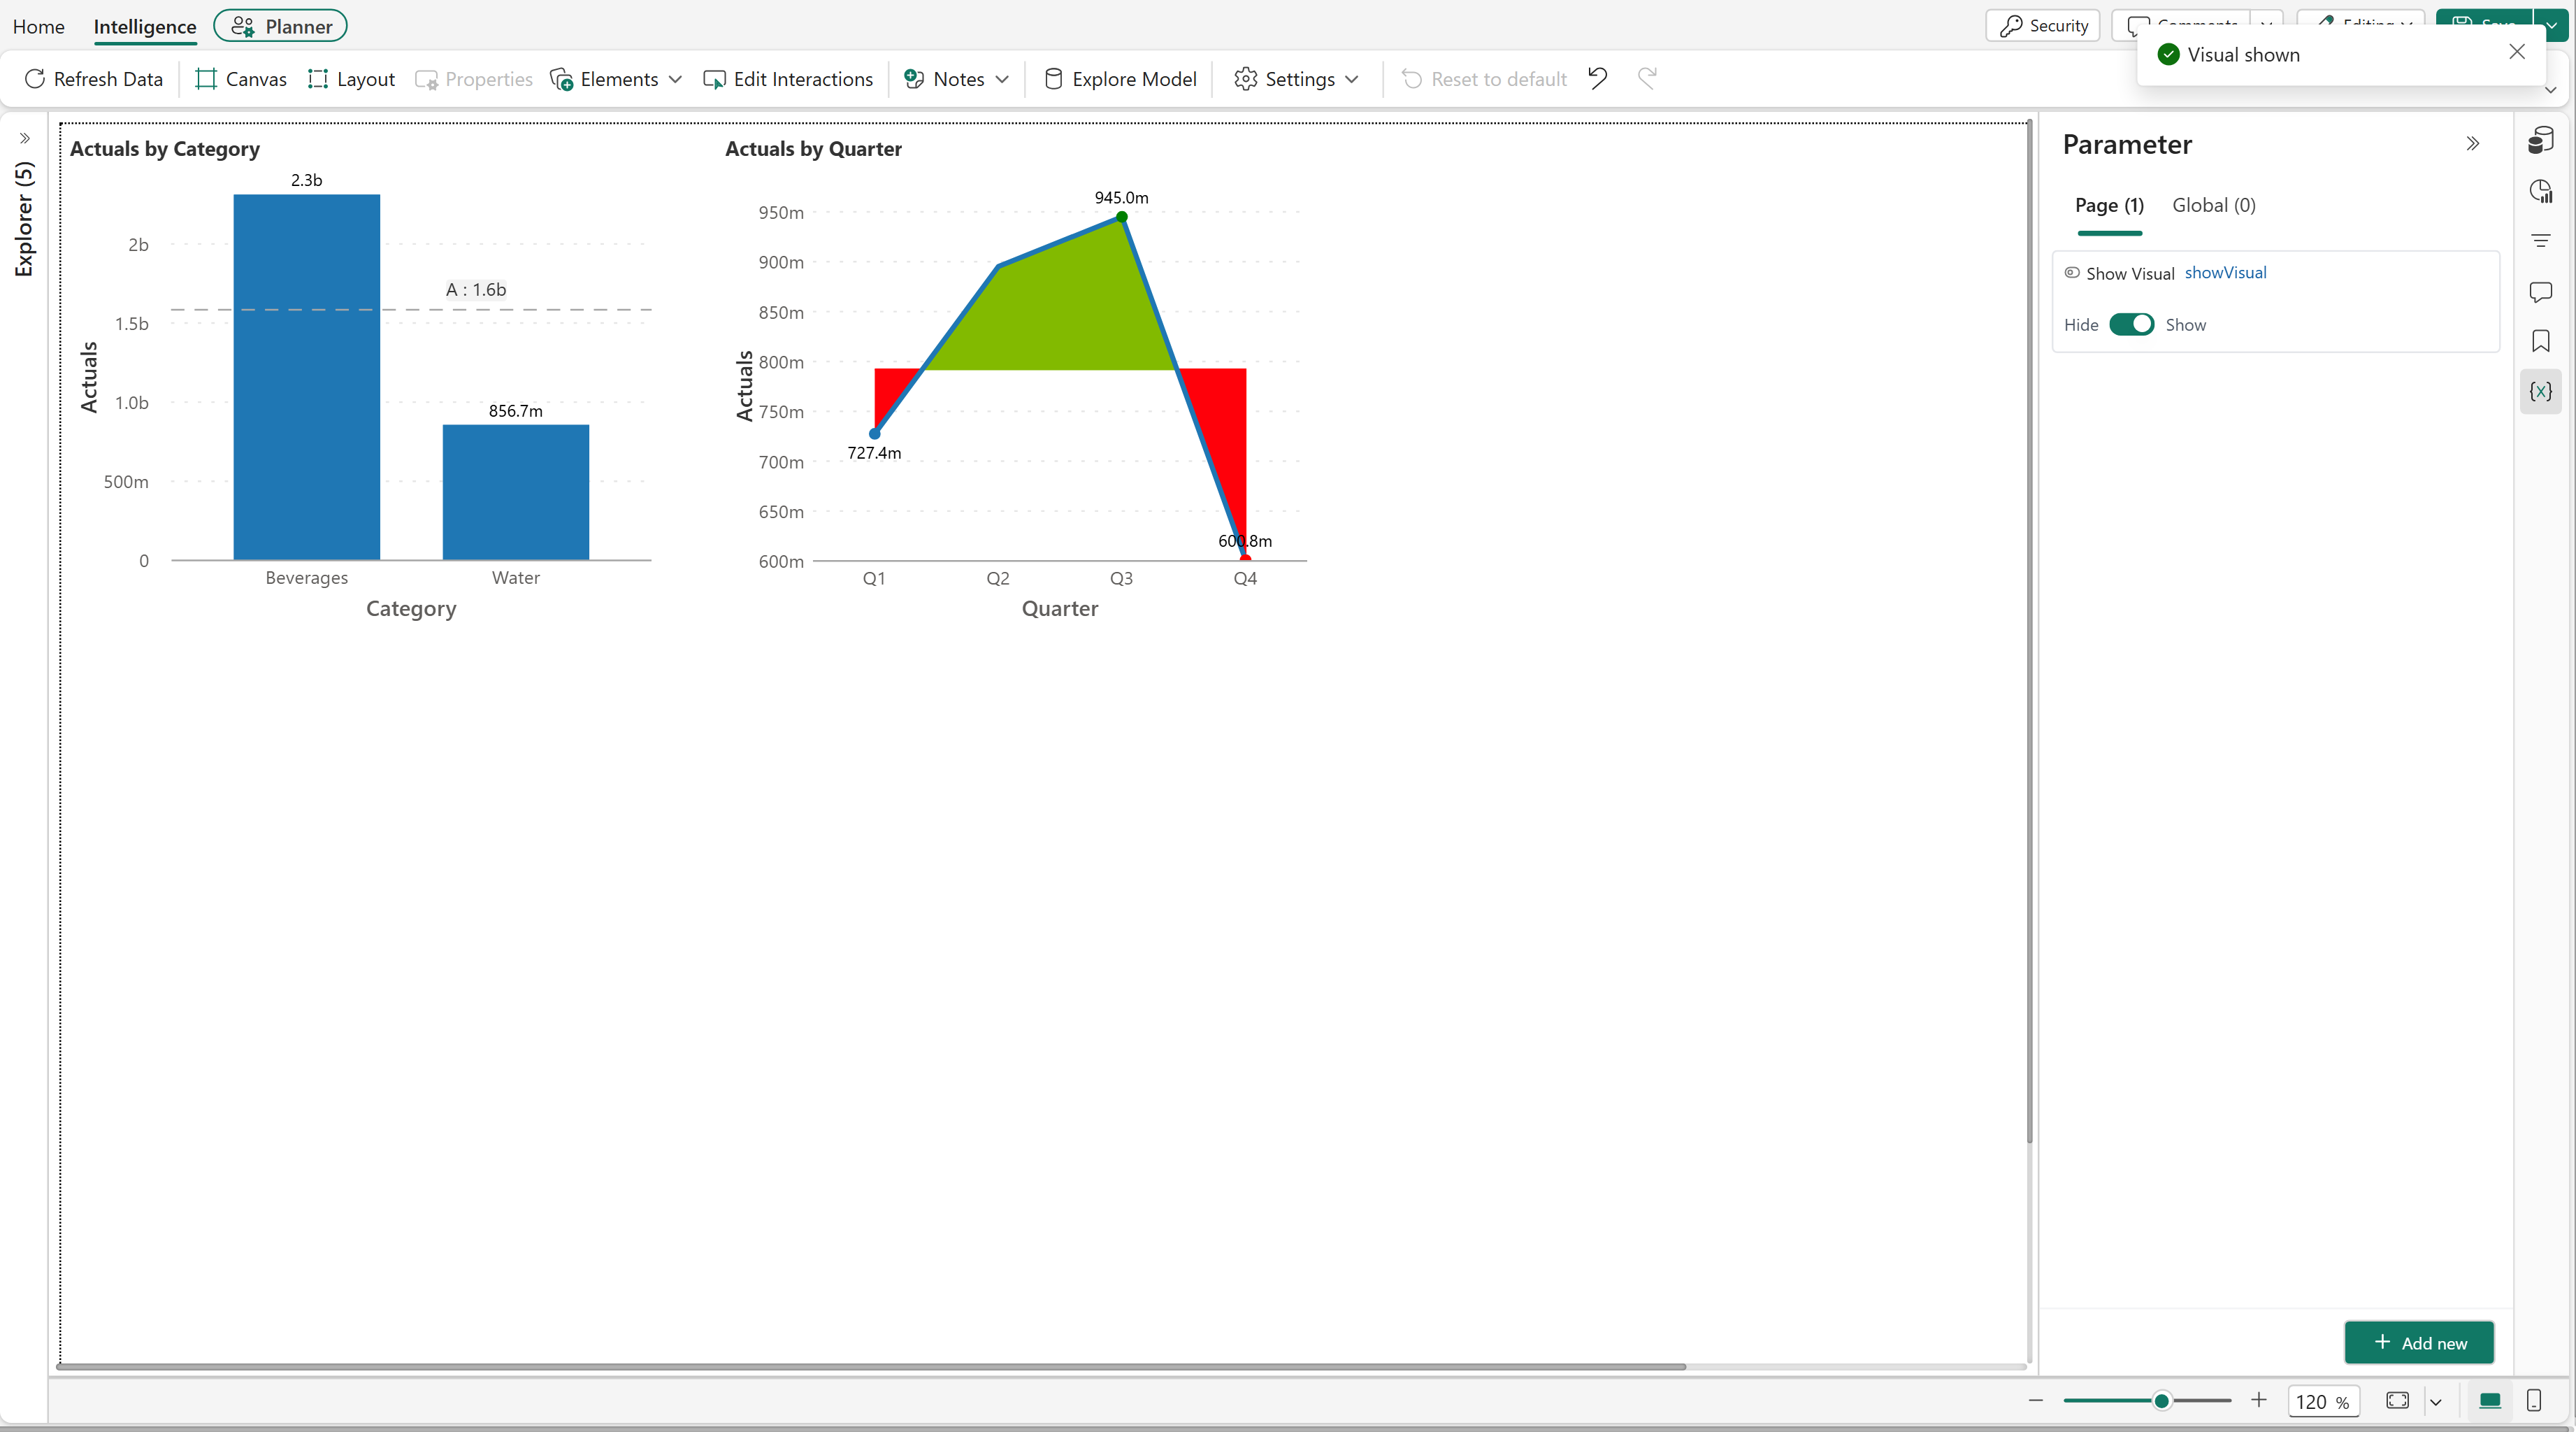
The following example uses a toggle parameter to control the visibility of a visual named Overlapped column@6 in an intelligence sheet. When the toggle is on, the SHOW_VISUAL function displays the visual. The example also uses HIDE_VISUAL in the toggle's off action so users can hide the visual again.
Configure a toggle parameter
Open the intelligence sheet and create or edit an action parameter.
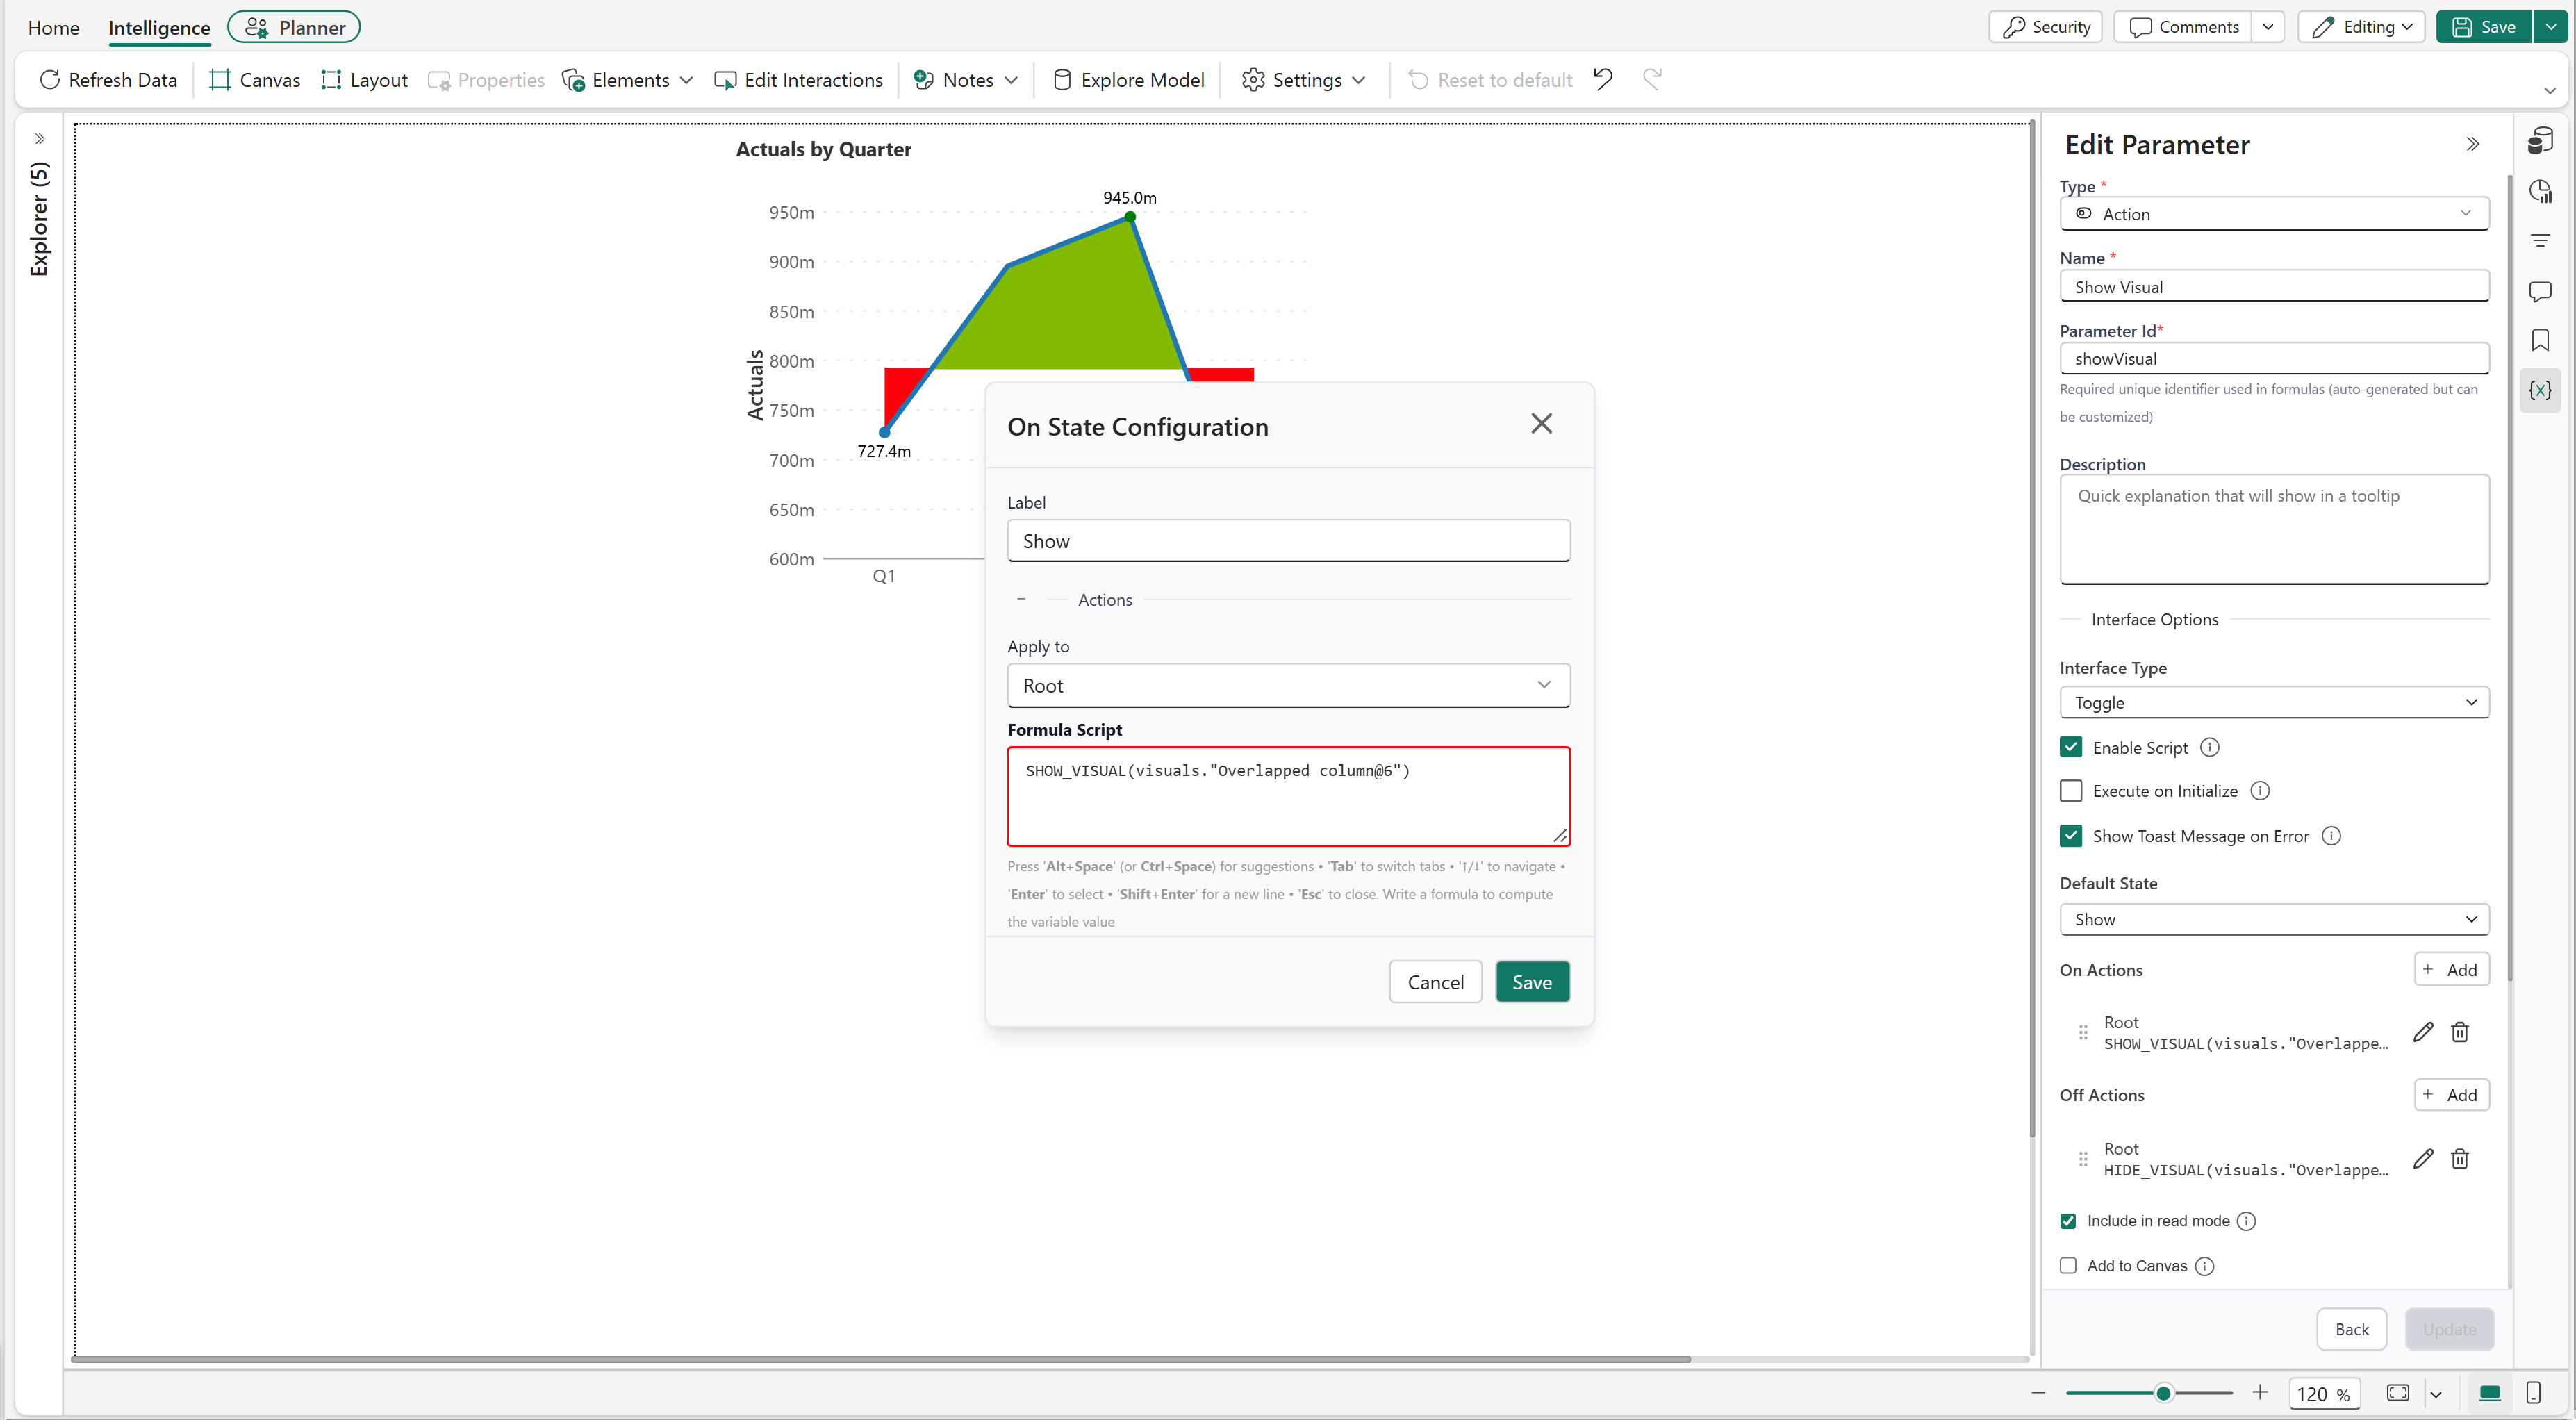
Set Interface Type to Toggle.
Enable Enable Script.
Set Default State to Hide.
Under On Actions, add an action, set Apply to to Root, and enter the following formula in Formula Script.
SHOW_VISUAL(visuals."Overlapped column@6")Under Off Actions, add an action, set Apply to to Root, and enter the following formula in Formula Script.
HIDE_VISUAL(visuals."Overlapped column@6")Save the action parameter.
Test the toggle
Open the Parameter pane and turn the toggle on to run SHOW_VISUAL and display the specified visual. Turn the toggle off to run HIDE_VISUAL and hide the visual again.