Create an eventstream in Microsoft Fabric
This article describes how to create a Fabric eventstream. If you want to use enhanced capabilities that are in preview, see the content in the Enhanced Capabilities tab. Otherwise, use the content in the Standard Capabilities tab. For information about enhanced capabilities that are in preview, see Introduction to Fabric event streams.
Prerequisites
Before you start, you must complete the following prerequisite:
- Get access to a premium workspace with Contributor or above permissions.
Important
Enhanced capabilities of Fabric event streams are currently in preview.
Create an eventstream
You can create an eventstream on the Workspace page, the Real-Time Intelligence experience Homepage, or the Create hub page. Here are the steps:
Change your Fabric experience to Real-Time Intelligence.
Follow one of these steps to start creating an eventstreams:
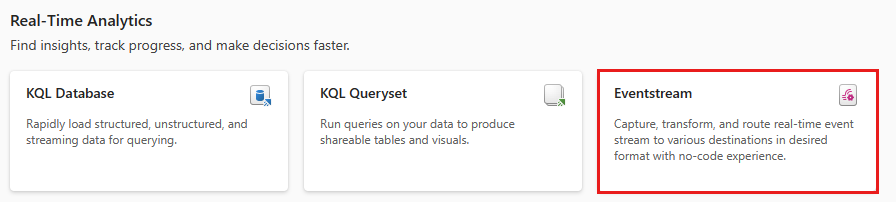
On the Real-Time Intelligence homepage, select the Eventstream tile:
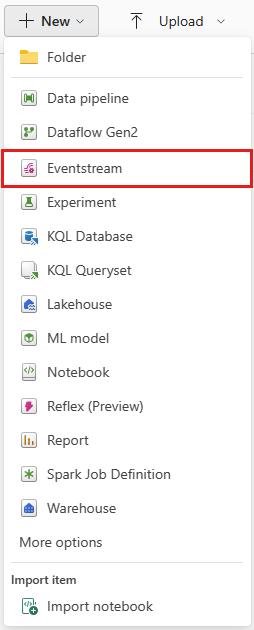
On the Workspace page, select New and then Eventstream:
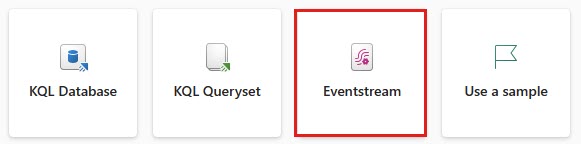
On the Create hub page, select the Eventstream tile:
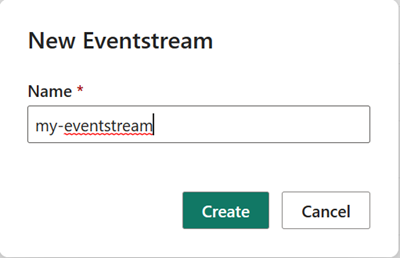
Enter a name for the new eventstream and select Enhanced Capabilities (preview) checkbox, and then select Create.

Creation of the new eventstream in your workspace can take a few seconds. After the eventstream is created, you're directed to the main editor where you can start with adding sources to the eventstream.


Next step
The event streams feature in Microsoft Fabric gives you a centralized place in the Fabric platform to capture, transform, and route real-time events to various destinations with a no-code experience. It integrates your eventstreams seamlessly with Azure Event Hubs, KQL databases, and lakehouses.
Important
Use this tab if you are using Fabric event streams without enhanced capabilities. If you are using enhanced capabilities, use the Enhanced Capabilities tab.
Prerequisites
Before you start, you must complete the following prerequisite:
- Get access to a premium workspace with Contributor or above permissions.
Create an eventstream
You can create an eventstream on the Workspace page, the Real-Time Intelligence experience Homepage, or the Create hub page. Here are the steps:
Change your Fabric experience to Real-Time Intelligence and select Eventstream to create a new eventstream in workspace or homepage or create hub.
On the Real-Time Intelligence homepage, select the Eventstream tile:
On the Workspace page, select New and then Eventstream:
On the Create hub page, select the Eventstream tile:
Enter a name for the new eventstream and select Create.
Creation of the new eventstream in your workspace can take a few seconds. After the eventstream is created, you're directed to the main editor where you can add sources and destinations to your eventstream. See the Main editor section for details.

Main editor for eventstreams
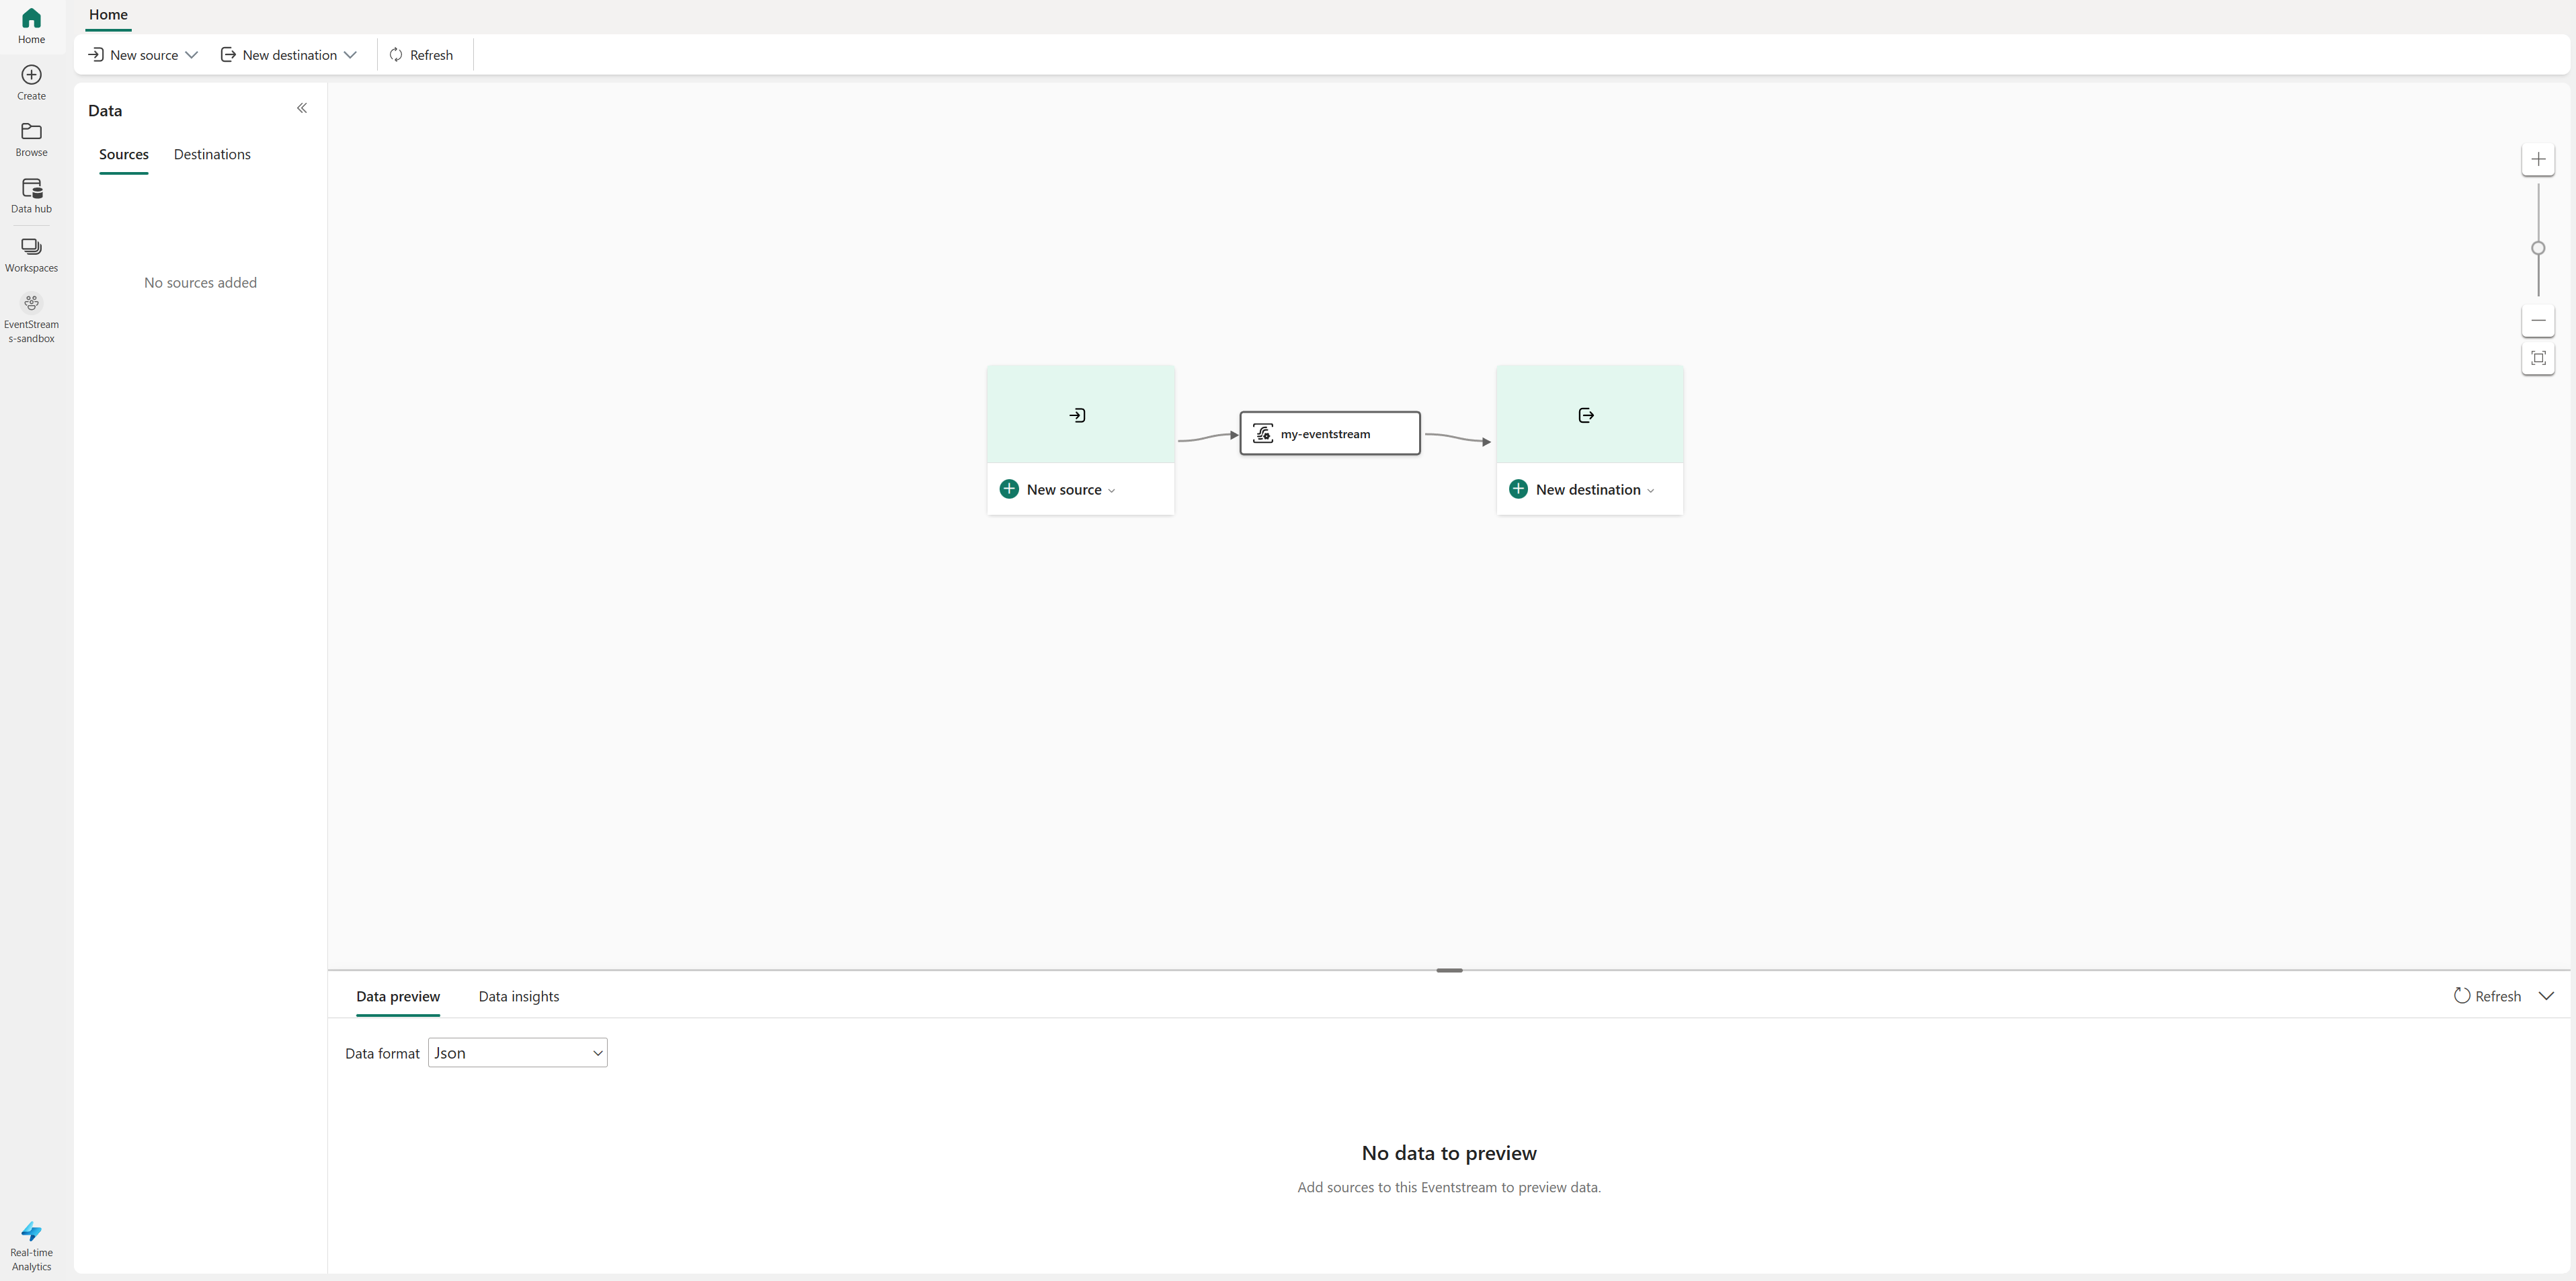
The Microsoft Fabric event streams feature provides a main editor, which is a canvas that allows you to connect to event data sources and destinations with a few clicks. Each tile (node) in the canvas represents a source, a destination, or the eventstream itself. From there, you can preview the event data, monitor the data insights with metrics, and check logs for each of these tiles (nodes).
The following screenshot shows an eventstream with its source and destination configured.

- Ribbon: The ribbon menu provides source and destination options, complemented by Activate all and Deactivate all buttons.
- Data navigation pane: This pane allows you to navigate the sources and destinations.
- Canvas and diagram view: This pane provides graphical representation of the entire eventstream topology, from the sources to the destinations. Each source or destination appears as a tile (node) in the canvas.
- Configuration and modification pane: This pane allows you to configure or modify a specific source or destination.
- Bottom pane for information, data preview, data insights, and runtime logs: For each tile (node), the data preview shows you data inside the selected tile (node). This section also summarizes runtime logs where the runtime logs exist in certain sources or destinations. It also provides metrics for you to monitor the data insights for certain sources or destinations, such as input events, output events, incoming messages, outgoing messages, etc.
Related content
- To learn how to configure an eventstream and more, see Manage an eventstream.
- Add and manage eventstream sources
- Add and manage eventstream destinations