Monitoring status and performance of an eventstream
The Microsoft Fabric event streams feature allows you to easily monitor streaming event data, ingestion status, and ingestion performance. This article explains how to monitor the eventstream status, check logs, errors, and data insights with metrics.
In an eventstream, there are two types of monitoring experiences: Data insights and Runtime logs. You see one or both views, depending on the source or destination you select.
Prerequisites
Before you start, you must have:
- Access to a premium workspace with Viewer or above permissions where your Eventstream item is located.
- An Azure event hub source or lakehouse destination added to your eventstream.
Data insights
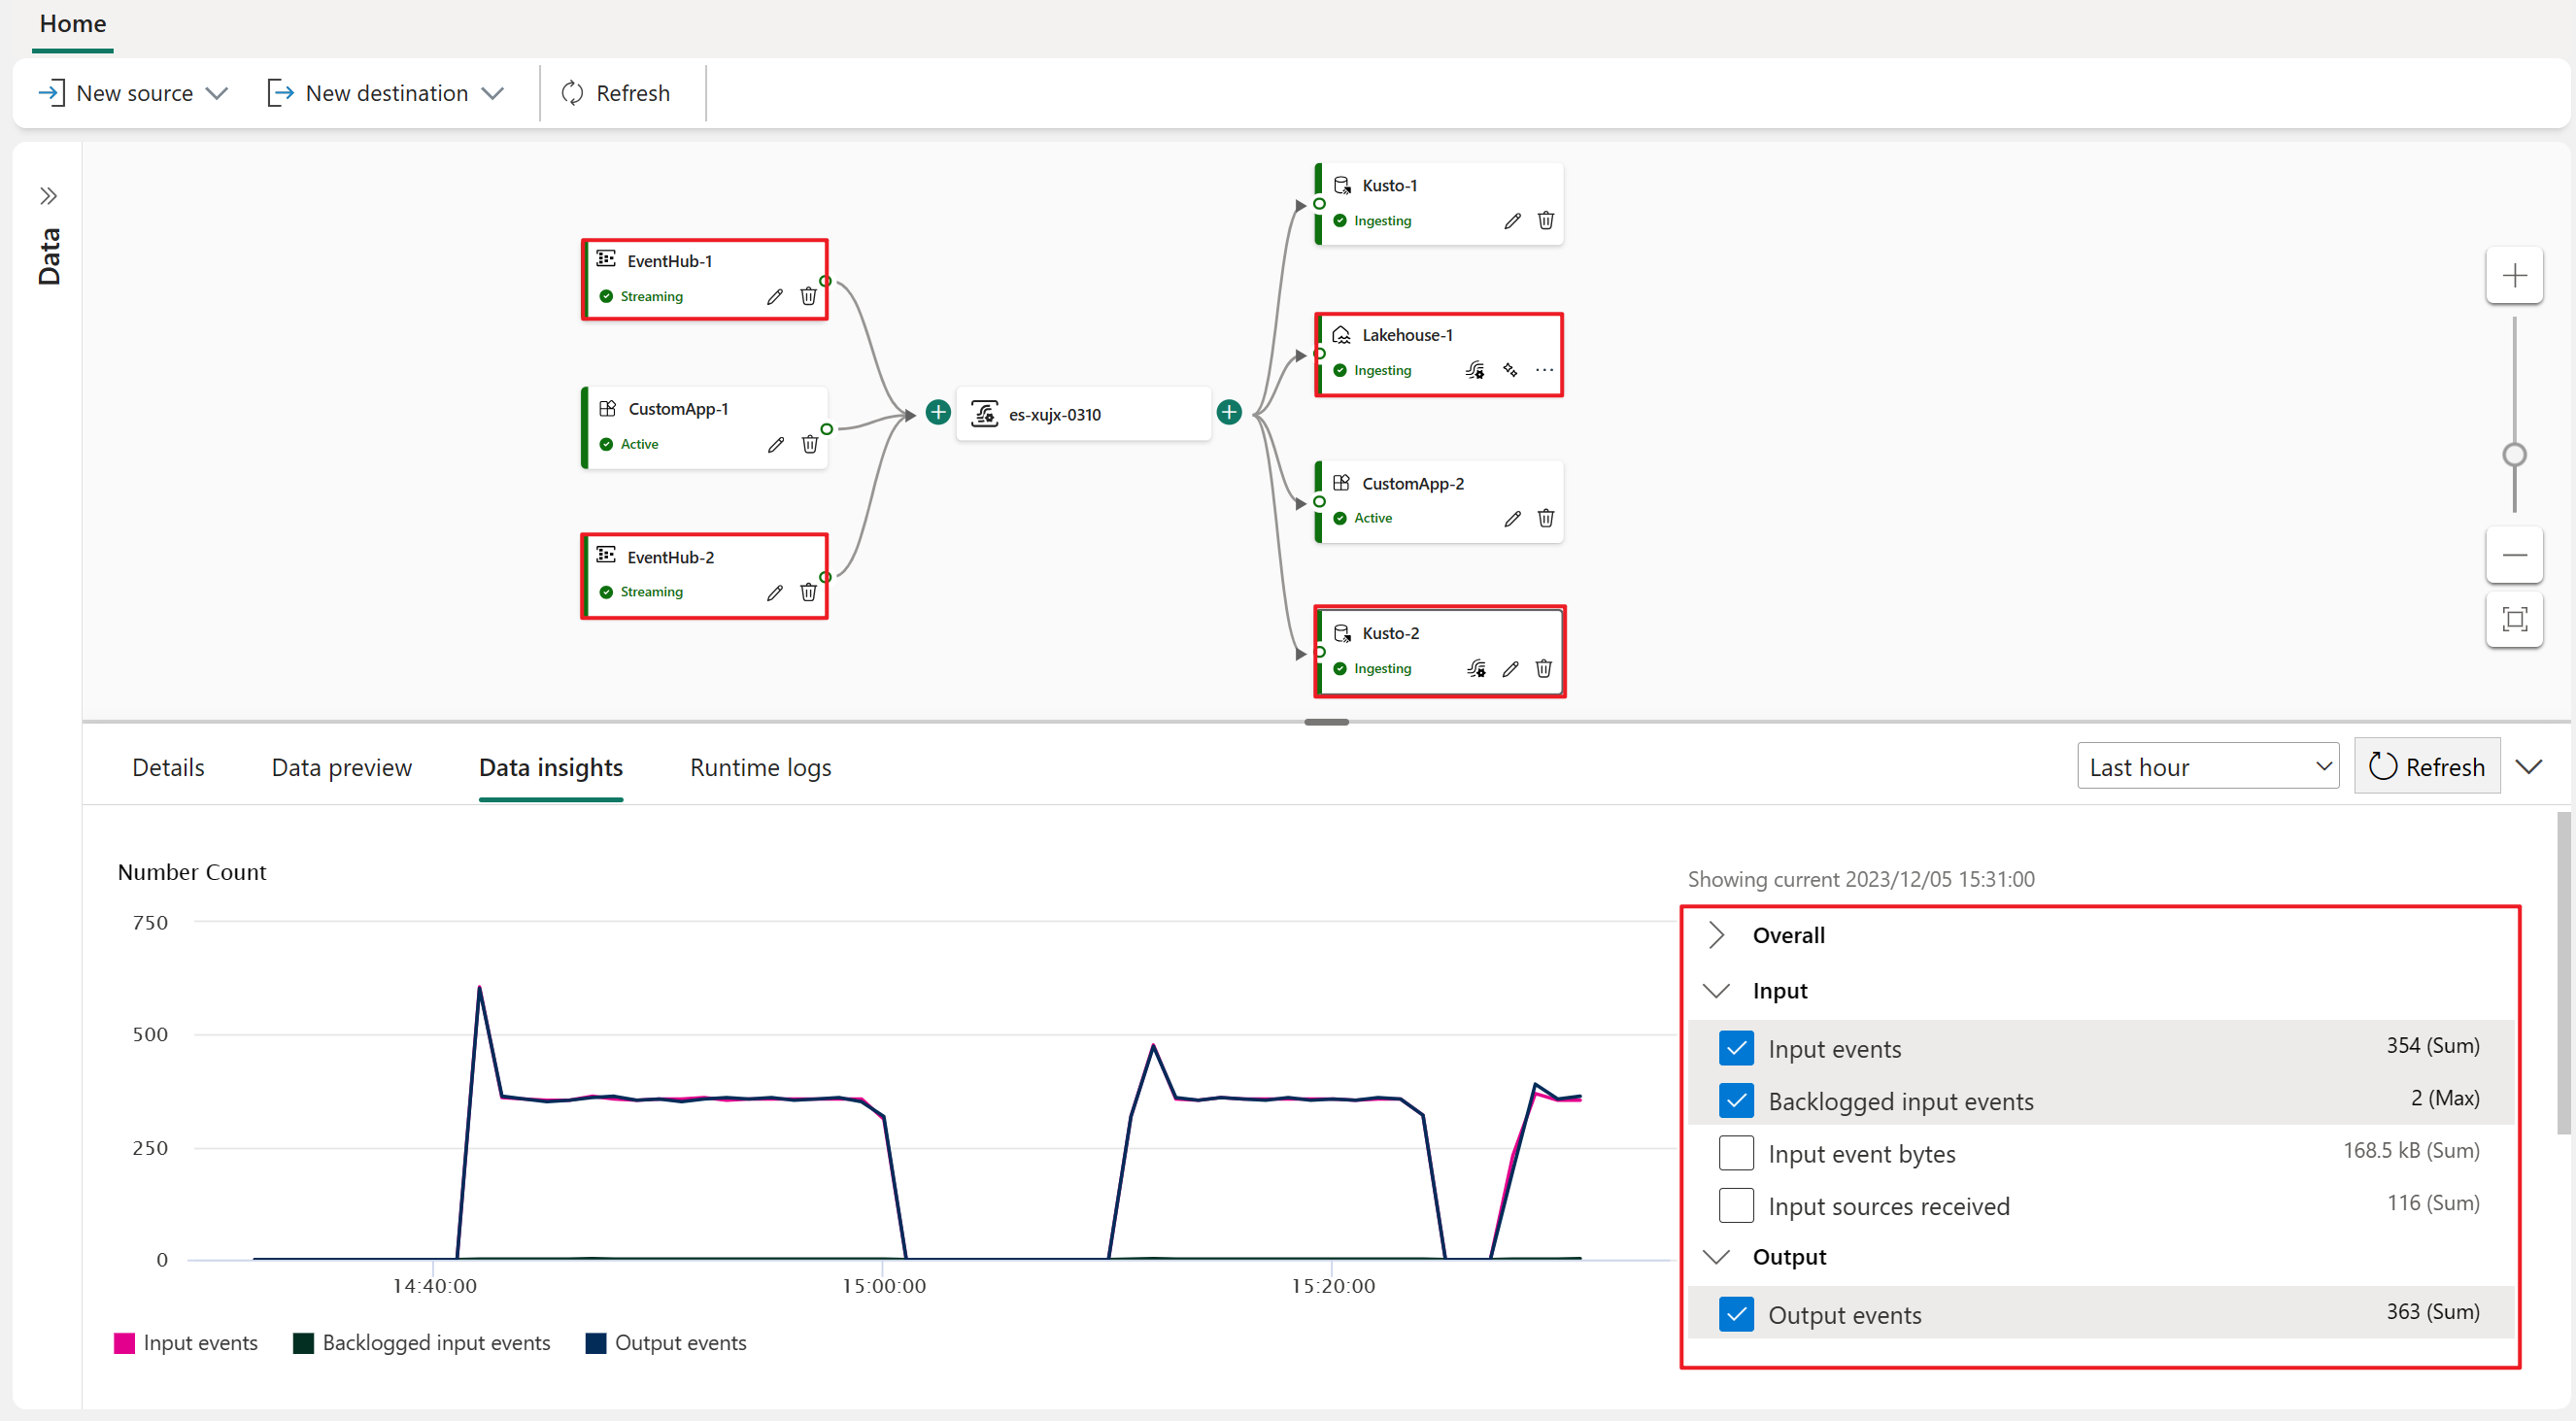
The Data insights tab appears in the lower pane of the main editor. The tab provides metrics that you can use to monitor the status and performance of the eventstream, sources, and destinations. Different sources and destinations have different metrics. When you select a node in the main editor canvas, the metrics for that specific node appear in the Data insights tab.
Data insights in an eventstream node
The following metrics appear for an eventstream node on the Data insights tab:
| Metric | Unit | Description |
|---|---|---|
| IncomingMessages | Count | The number of events or messages sent to an eventstream over a specified period. |
| OutgoingMessages | Count | The number of events or messages outflow from an eventstream over a specified period. |
| IncomingBytes | Bytes | Incoming bytes for an eventstream over a specified period. |
| OutgoingBytes | Bytes | Outgoing bytes for an eventstream over a specified period. |
To view data insights for an eventstream:
Select the eventstream node in the main editor canvas.
In the lower pane, select the Data insights tab.
If there's data inside the eventstream, the metrics chart appears on the Data insights tab.
On the right side of the tab, select the checkboxes next to the metrics you want to display.
Data insights in Azure event hub source, lakehouse destination and KQL database destination nodes
The following metrics are available on the Data insights tab for Azure event hub source, lakehouse destination, and KQL database destination ('Event processing before ingestion' mode) nodes:
| Metric | Unit | Description |
|---|---|---|
| Input events | Count | Number of event data that the eventstream engine pulls from an eventstream (in a lakehouse destination or KQL database destination), or from an Azure event hub source (in an Azure event hub source). |
| Input event bytes | Bytes | Amount of event data that the eventstream engine pulls from an eventstream (in a lakehouse destination or KQL database destination), or from an Azure event hub source (in an Azure event hub source). |
| Output events | Count | Number of event data that the eventstream engine sends to a lakehouse or KQL database (in a lakehouse destination or KQL database destination), or an eventstream (in an Azure event hub source). |
| Backlogged input events | Count | Number of input events that are backlogged in the eventstream engine. |
| Runtime errors | Count | Total number of errors related to event processing. |
| Data conversion errors | Count | Number of output events that couldn't be converted to the expected output schema. |
| deserialization errors | Count | Number of input events that couldn't be deserialized inside the eventstream engine. |
| Watermark delay | Second | Maximum watermark delay across all partitions of all outputs for this source or destination. It is computed as the wall clock time minus the largest watermark. |
To view the data insights for an Azure event hub source, lakehouse destination or KQL database destination ('Event processing before ingestion' mode):
Select the Azure event hub source node, lakehouse destination node or KQL database destination node in the main editor canvas
In the lower pane, select the Data insights tab.
If there's data inside the Azure event hub source, lakehouse destination or KQL database destination, the metrics chart appears on the Data insights tab.
On the right side of the tab, select the checkboxes next to the metrics you want to display.
Runtime logs
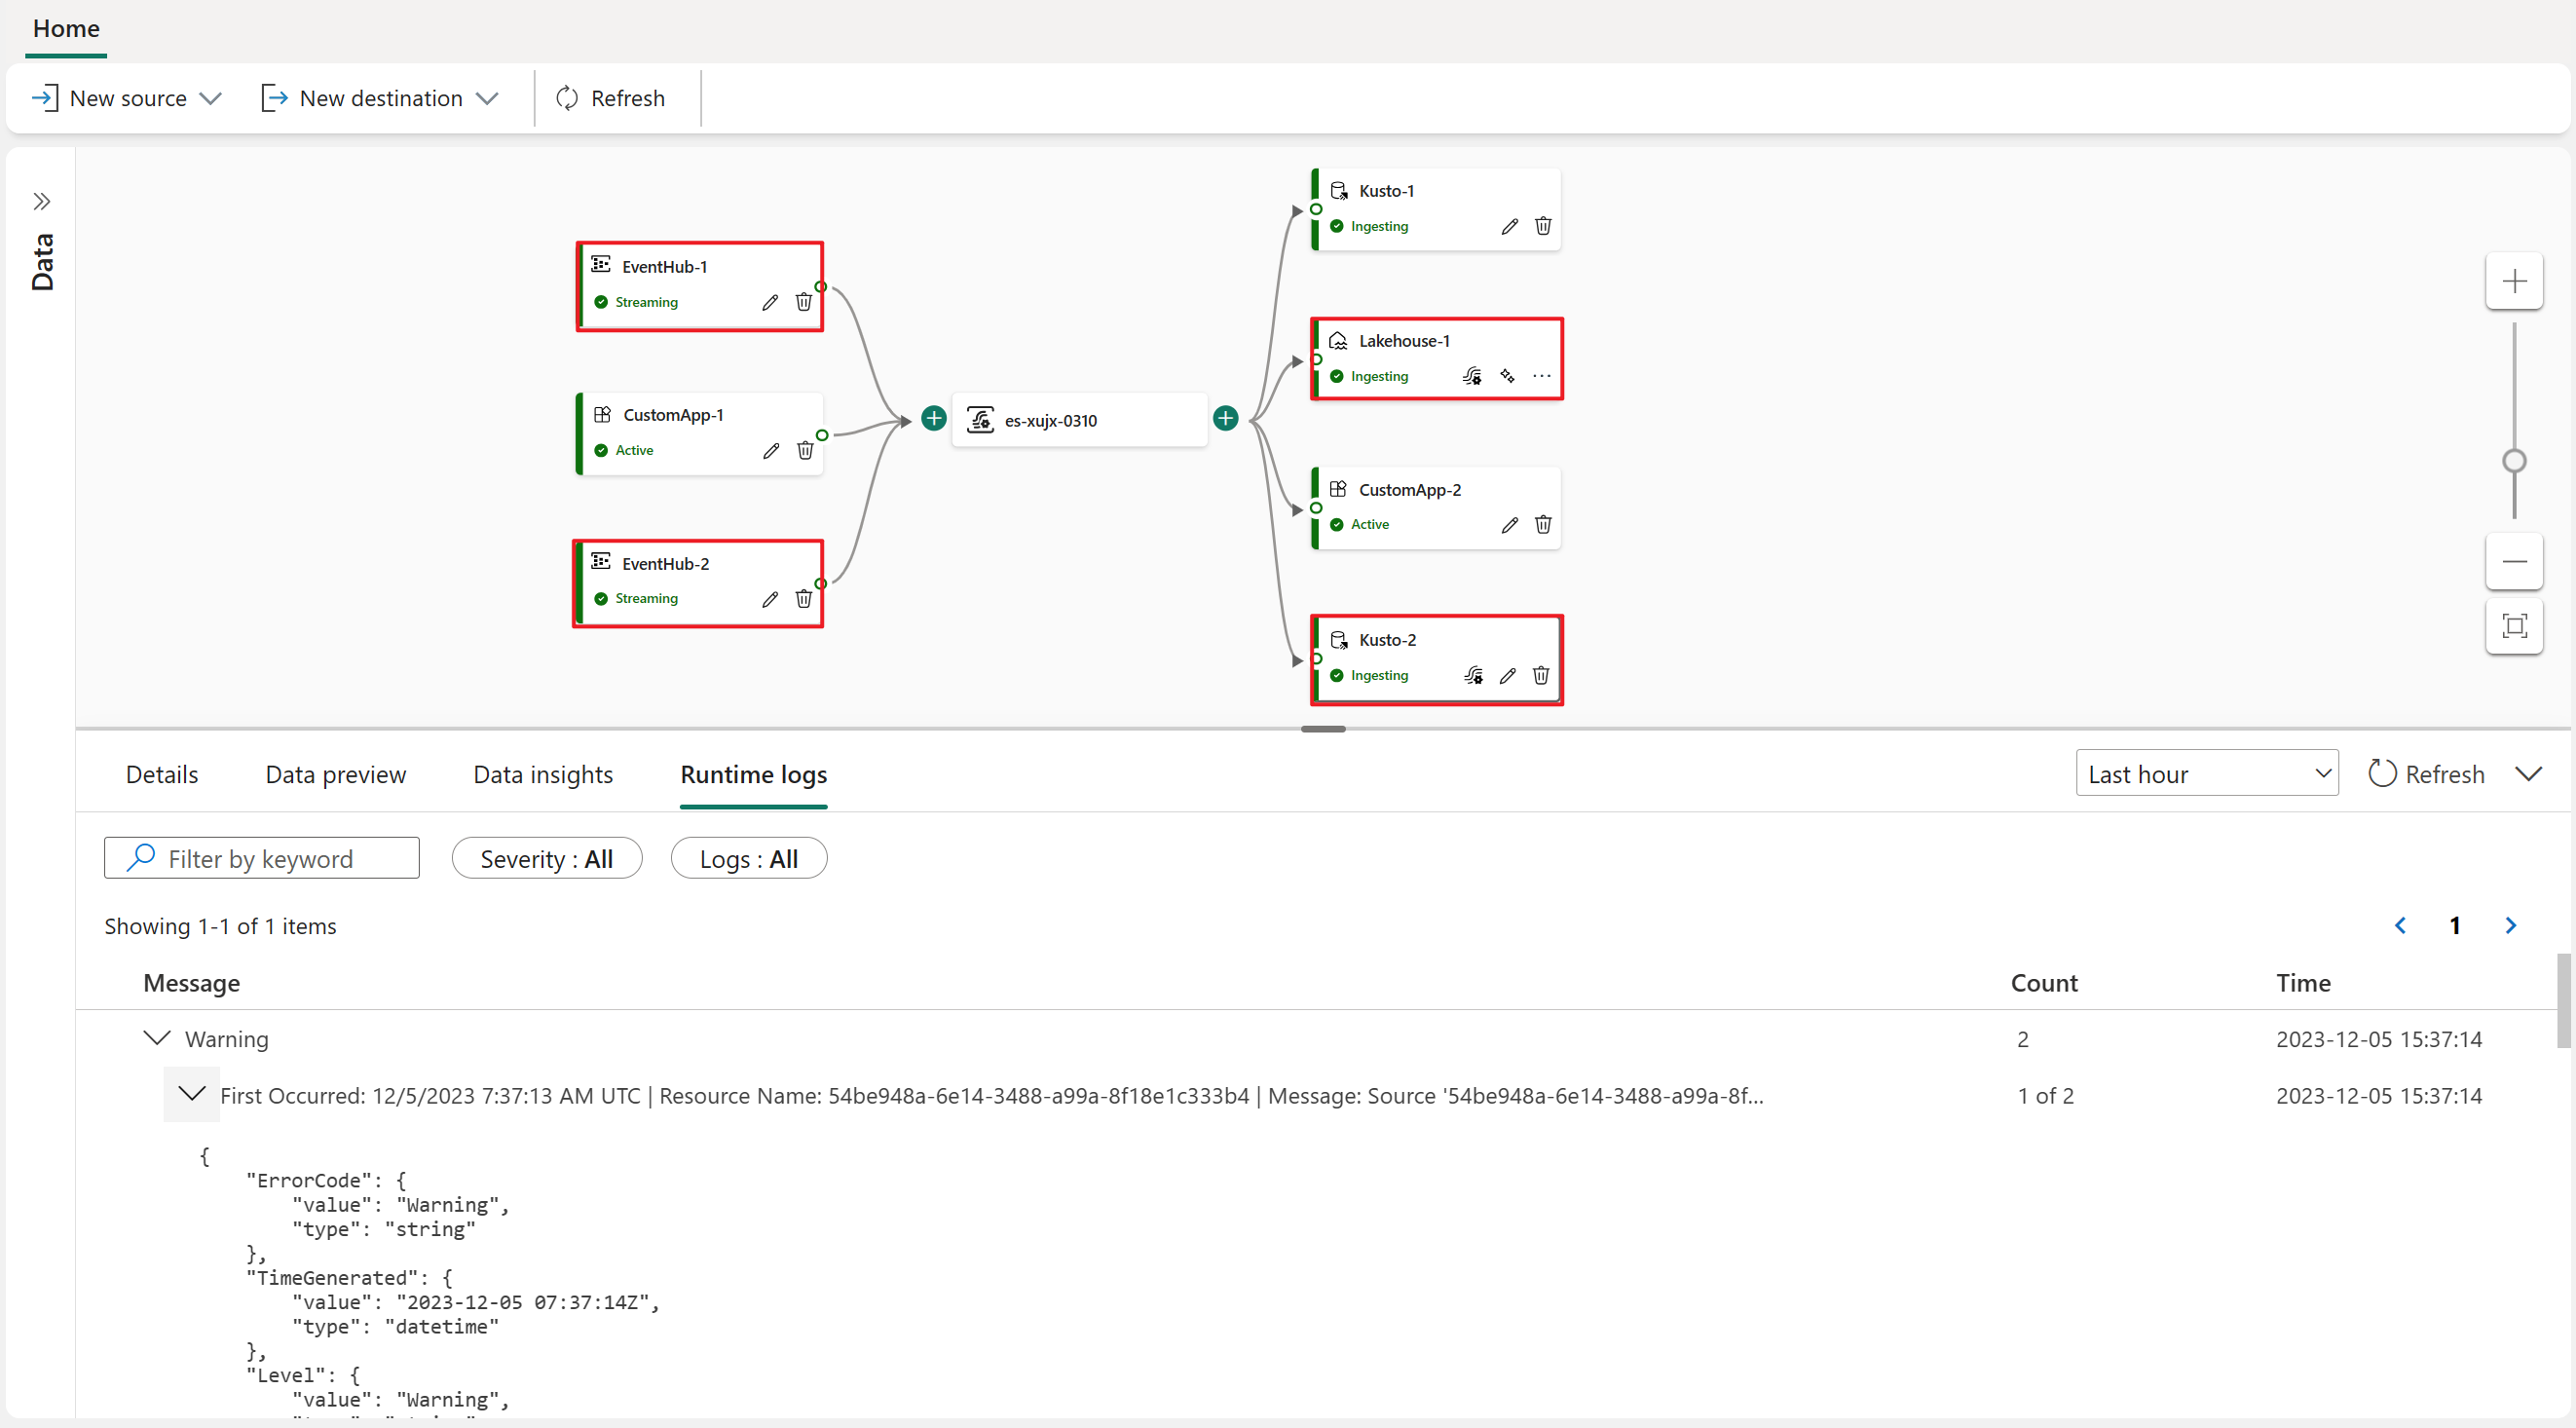
The Runtime logs tab enables you to check the detailed logs that occur in the eventstream engine. Runtime logs have three severity levels: warning, error, and information.
To view the runtime logs for Azure event hub source, lakehouse destination and KQL database destination ('Event processing before ingestion' mode):
Select the Azure event hub source, lakehouse destination or KQL database destination in the main editor canvas.
In the lower pane, select the Runtime logs tab.
If there's data inside the Azure event hub source , lakehouse destination or KQL database destination, the logs appear on the Runtime logs tab.
Search the logs with the Filter by keyword option, or filter the list by changing the severity or type.
To see the most current logs, select Refresh.
Related content
Feedback
Coming soon: Throughout 2024 we will be phasing out GitHub Issues as the feedback mechanism for content and replacing it with a new feedback system. For more information see: https://aka.ms/ContentUserFeedback.
Submit and view feedback for


