Real-Time Analytics tutorial part 4: Explore your data with KQL and SQL
Note
This tutorial is part of a series. For the previous section, see: Tutorial part 3: Get historical data.
The first step in data analysis is often to take a look at a subset of the data itself. There are several example queries available to you in both SQL and KQL to help you get familiar with the query languages and assist with initial data exploration.
Sample KQL queries
A Kusto Query Language (KQL) query is a read-only request to process data and return results. The request is stated in plain text, using a data-flow model that is easy to read, author, and automate. Queries always run in the context of a particular table or database. At a minimum, a query consists of a source data reference and one or more query operators applied in sequence, indicated visually by the use of a pipe character (|) to delimit operators. For more information on the Kusto Query Language, see Kusto Query Language (KQL) Overview.
Note
The query editor comes with syntax highlighting and IntelliSense, so you can quickly ramp-up your knowledge of the Kusto Query Language.
Browse to your KQL database named NycTaxiDB.
In the Explorer pane, select the More menu [...] on the nyctaxitrips table. Then select Query table > Show any 100 records.
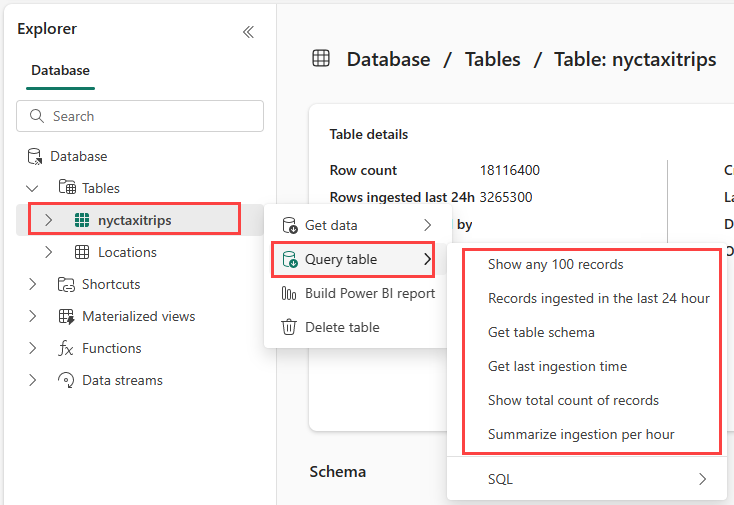
The example opens in the Explore your data pane with the table context already populated. This first query uses the take operator to return a sample number of records, and is useful to get a first look at the data structure and possible values. The autopopulated example queries are automatically run. You can see the query results in the results pane.

Return to the Explorer pane to select the next query, which uses the where operator and between operator to return records ingested in the last 24 hours.

Notice that the volumes of the streaming data exceed the query limits. This behavior may vary depending on the amount of data streamed into your database.
Select the next query in the list of example queries, which uses the getschema operator to retrieve the table schema.

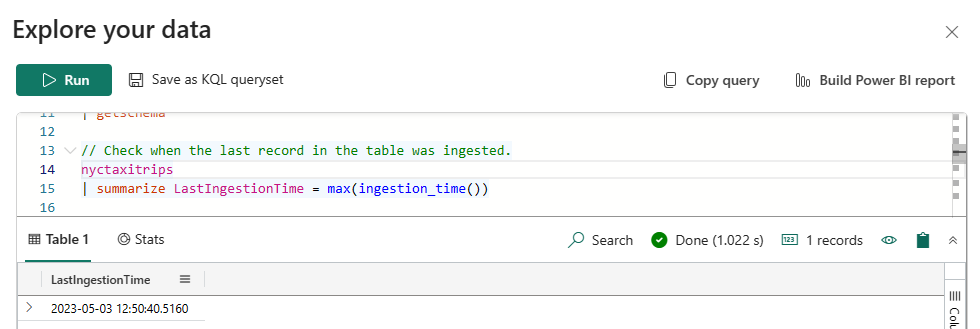
Select the next query in the list of example queries, which uses the summarize operator to check when the last record was ingested.
Select the next query in the list of example queries, which uses the count operator to return the number of records in the table.

Select the final query in the list of example queries, which uses the summarize operator, count operator, and bin function to return the number of ingestions per hour.


Example SQL queries
The query editor supports the use of T-SQL in addition to its primary query language, Kusto query language (KQL). While KQL is the recommended query language, T-SQL can be useful for tools that are unable to use KQL. For more information, see Query data using T-SQL
In the Explorer pane, select the More menu [...] on the nyctaxitrips table. Select Query table > SQL > Show any 100 records.

The query returns a sample number of records.

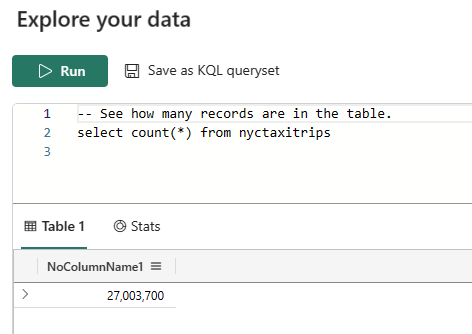
Select the next SQL query to return a count of the total number of records in the table.


Related content
For more information about tasks performed in this tutorial, see:
Next step
Feedback
Coming soon: Throughout 2024 we will be phasing out GitHub Issues as the feedback mechanism for content and replacing it with a new feedback system. For more information see: https://aka.ms/ContentUserFeedback.
Submit and view feedback for