Note
Access to this page requires authorization. You can try signing in or changing directories.
Access to this page requires authorization. You can try changing directories.
Microsoft Sustainability Manager is built on top of Dataverse as a model-driven power app. Users can use the native Dataverse capabilities to extend the data model and use it in carbon calculations and custom reporting. You can add an attribute to any Microsoft Sustainability Manger table in Dataverse, refer to it in calculations using Power Fx, and add it to grid views and edit forms.
Examples of when you might want to extend the Microsoft for Sustainability data model include the following scenarios:
- Associate produced items with purchased electricity activity
- Associate fugitive emission with laboratory, or leased assets
- Qualify purchased electricity with custom impact
For a step-by-step walk-through of extending the data model, go to Example: Electric Mode table in this article.
To extend Microsoft Sustainability Manager, complete the following procedures:
Create a new Dataverse table to capture your organization's data. For an example, see Create a new Dataverse table.
Ingest the new table directly into Dataverse or extend the Microsoft Sustainability Manager UI to ingest it as reference data within the embedded Microsoft Sustainability Manager experience. For an example, see Ingest data.
Note
You can't use the table as reference data in calculations. You can only use it as reference data within the Power Fx editor.
Extend the Microsoft for Sustainability data model with a reference to the new table. For an example, see Add a reference lookup.
Enable Microsoft Sustainability Manager access to the new table by giving it the Sustainability Service Application Role - Custom security role. For an example, see Grant access to the new table.
Ingest Microsoft Sustainability Manager data with additional attributes. For an example, see Ingest data.
Use the additional attributes in calculations. For an example, see Calculate Scope 3 transportation emissions.
Modify grid views and edit forms to show new attributes. For an example, see Customize data views.
Create custom Power BI reports with the new attributes.
Keep the following information in mind while following the preceding steps:
If the extension is simple, such as a boolean value, you might not need to create a new Dataverse table, as indicated in step 1. In step 3, just extend a Microsoft Sustainability Manager table with a new boolean attribute. In this case, there's no need for an extra custom table.
If you're using an external table, add the Read privilege to the Sustainability Service Application Role - Custom role on the external table. The role should be at the Organization level.
Note
If the calculation for an activity says a given value is null or blank, and if the record does have a value for that custom lookup, ensure this security role has access to that other table.
Ingestion via the Microsoft Sustainability Manager UI is optional. For more elaborate extensions such as referencing third party solutions, ingestion of referenced data is likely to take place elsewhere.
Modifying grid views and edit forms is only a convenience if you want to view or edit the extended data within Microsoft Sustainability Manager.
Custom Power BI reports are outside the scope of this article.
To enable access in step 4 and modify edit forms, you must create a Dataverse solution and perform these steps in it.
Actions
To view new attributes in Microsoft Sustainability Manager grid view:
- In Microsoft Sustainability Manager, edit grid view columns, add desired attributes, and save the view.
To add a form in Microsoft Sustainability Manager:
- In Power Apps, add an existing form for Microsoft Sustainability Manager table to extend, and then modify the main form to add a new attribute.
Note
You must complete this step in a new Dataverse solution.
To make a new table available for ingestion within Microsoft Sustainability Manager as reference data:
Modify the reference data table in Power Apps to add a new table.
Add Write and Append privileges to the role for that table.
For more information about performing these actions, see the following articles:
- Dataverse documentation
- Tables in Dataverse
- Create and edit columns in Dataverse using Power Apps
- Solutions in Power Apps
- Security concepts in Microsoft Dataverse
Example: Electric Mode table
More transportation and distribution organizations are shifting from combustion engines to hybrid and fully electric solutions. This shift makes the carbon calculation for Scope 3 category 4 and 9 slightly more complex, but it's necessary to separate and understand vehicle fuel sources to realize carbon reductions. Microsoft Sustainability Manager provides this flexibility through simple extensions using Power Apps.
In this example, you expand your data model to account for electric vehicle options, ingest new data, and then use that data to calculate newly reduced emissions and some custom emission factors. This example uses no-code and low-code customizations that use Microsoft Sustainability Manager's user interface.
The example guides you through the following steps:
- Prerequisites
- Create a new Dataverse table
- Create columns in the table
- Grant access to the new table
- Provision the table
- Add a reference lookup
- Customize data views
- Ingest data
- Calculate Scope 3 transportation emissions
- Enable a calculation profile
- View emissions
Prerequisites
For this example, you need to meet the following prerequisites:
- Microsoft Sustainability Manager is already installed.
- Proficiency with Microsoft Sustainability Manager.
- Proficiency with sustainability practices, particularly with Scope 3 category 4 and 9: Transportation and Distribution
- Advanced understanding of Dataverse.
- Admin privileges to manage Dataverse tables and security roles.
Create a new Dataverse table
Start in Dataverse, which is a no-code or low-code developer solution for business applications. You can access Dataverse through Power Apps. For more information about Dataverse, see What is Microsoft Dataverse?.
First, create a new table to store the new modes of transportation and distribution. This table indicates the level of efficiency provided by electric vehicles. By using this table, you can add details about electric hybrid vehicles that you use in your supply chain for transportation and distribution.
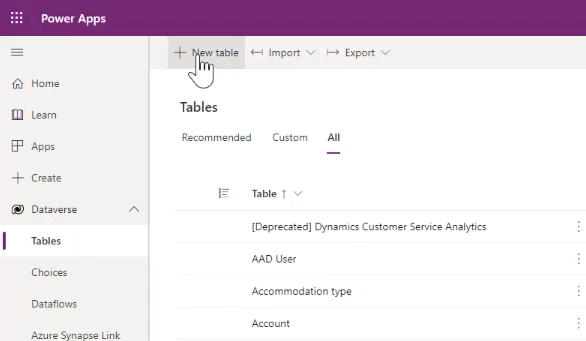
Go to Power Apps.
On the left navigation pane, select Dataverse, and then select Tables.
On the top menu bar, select New table.
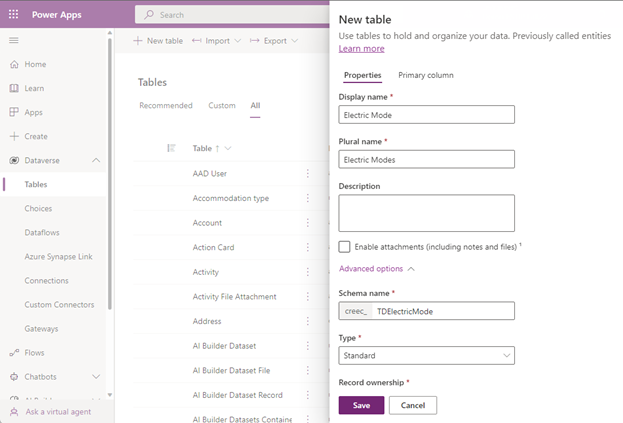
In the New table panel, enter the following values:
Property Value Display name Electric Mode Plural name Electric Modes Schema name TDElectricMode Note
Remember the full schema name, including the five characters preceding the name you entered, for later use.
For more information about creating or editing Dataverse tables, see Create and edit tables using Power Apps.
Select Save at the bottom of the panel.
Create columns in the table
Next, create new columns in the Electric Mode table. Use these columns in data and calculations to describe the different levels of electrification.
One of these columns contains a multiplier factor that you use in the calculations, plus a description field.
In the Electric Mode columns and data section of the Electric Mode table page, select + to add a column.
Note
The Name property for the column already exists by default.
For more information about creating or editing columns, see Create and edit columns in Dataverse using Power Apps.
Create a Description column: In the New column panel, enter or select the following values:
Property Value Display name Description Data type Single line of text Format Text Behavior Simple Required Optional Searchable (Select the checkbox for Yes) Schema name Description Maximum character count 100 Input method editor (IME) mode Auto 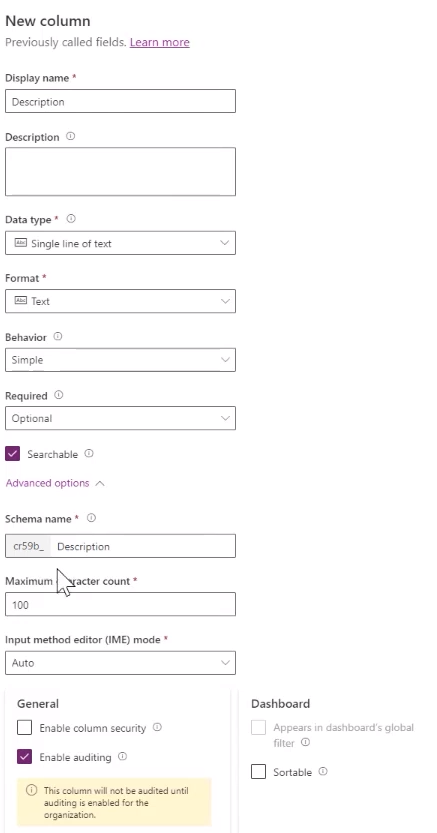
Select Save at the bottom of the panel to save the column.
Create a Multiplier column: Select + again to create a new column. In the New column panel, enter or select the following values:
Property Value Display name Multiplier Data type Decimal Behavior Simple Required Optional Searchable (Select the checkbox for Yes) 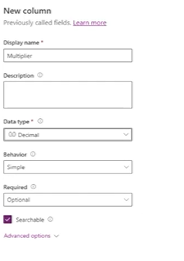
Select Save at the bottom of the panel to save the column.
Grant access to the new table
You need to grant Microsoft Sustainability Manager access to the new table.
In a new browser window, Sign in to the Power Platform admin center.
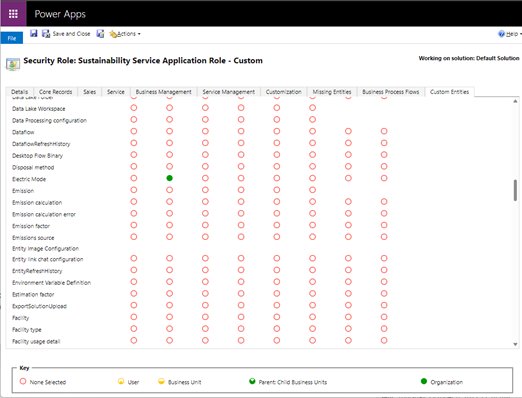
Select Settings > Security > Security Roles.
Select the Sustainability Service Application Role - Custom role.
In the Custom Entities tab, grant the Electric Mode table Read (or Read and Write) access.
Select Save and Close.
Provision the table
Provision the table with fleet electrification types. In this example, add them through Power Query.
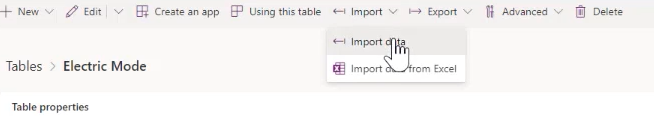
In your Power Apps browser window, on the menu bar, select Import, and then select Import data.
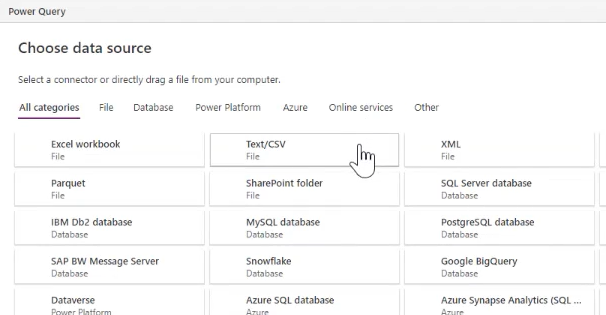
In the Choose data source window, select Text/CSV.
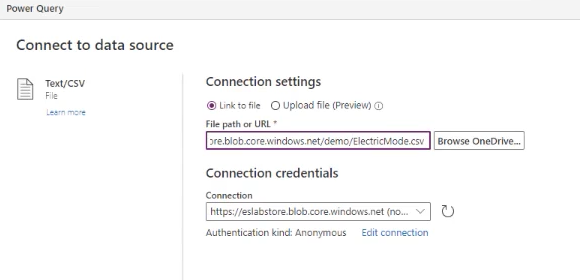
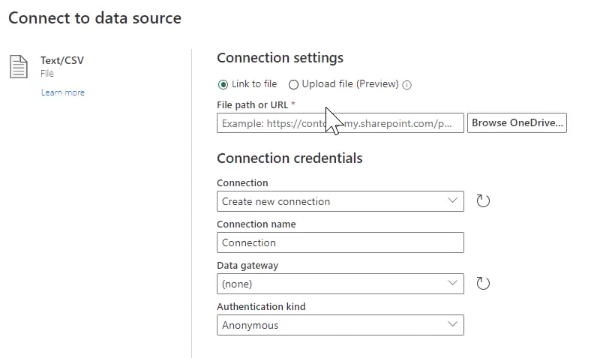
In the Connect to data source window, under Connection settings, link to the file that contains your data, and then select Next at the bottom of the window.
In the Preview file data window, verify the data, and then select Next.
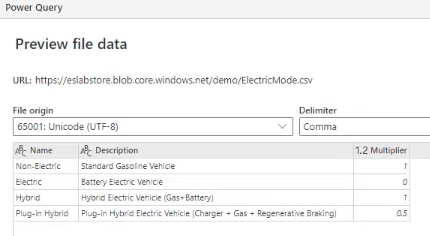
In the next screen, select Next.
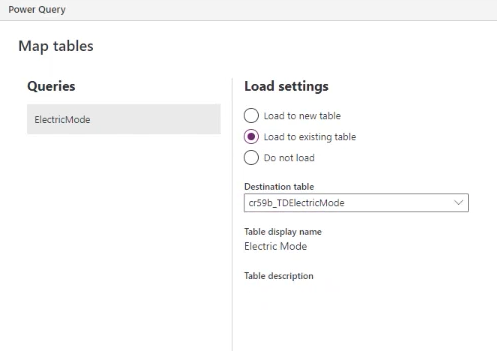
In the Map tables window, under Load settings, select Load to existing table, and then select the Destination table (in this case, TDElectricMode).
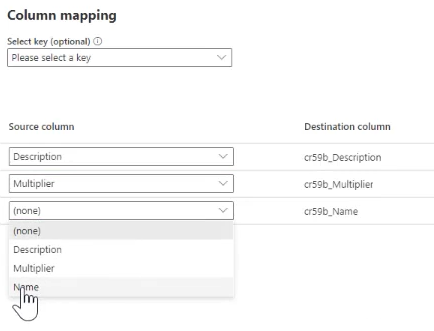
While still in the Map tables window, under Column mapping, map the Description, Multiplier, and Name columns. Select Next.
In the Refresh settings window, select Publish.
Add a reference lookup
Now, reference the extended table within the existing Scope 3 category 4 Transportation and distribution table by adding a reference lookup from the Transportation and distribution table to the Electric Mode table.
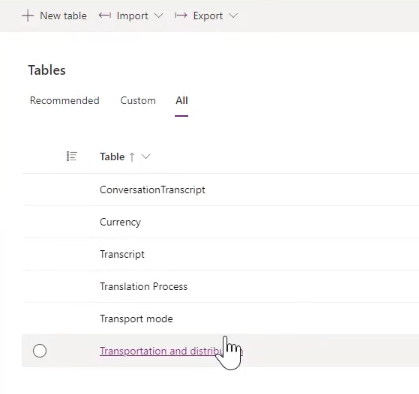
At the top of the screen in the breadcrumb, select Tables.
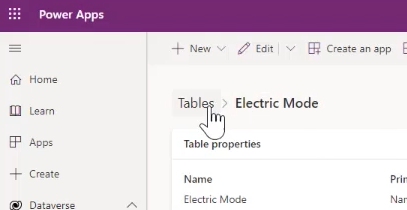
In the Tables screen, select All, enter Transportation in the search box on the upper right, and then select the Transportation and distribution table.
On the Transportation and distribution table page, in the Transportation and distribution columns and data grid, select + to add a lookup column.
Enter or select the following values:
- In Display name, enter Vehicle Electric Mode.
- Under Data type, select Lookup, and then select Lookup.
- In Related table, select Electric Mode.
- The Schema name and Relationship name fields populate automatically.
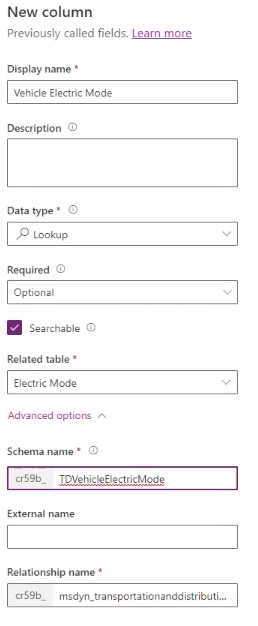
Select Save.
Customize data views
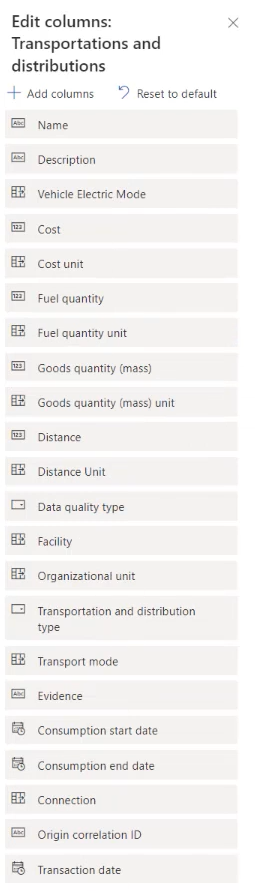
In Microsoft Sustainability Manager, go to the Electric Upstream transportation and distribution page, and then select Edit columns.
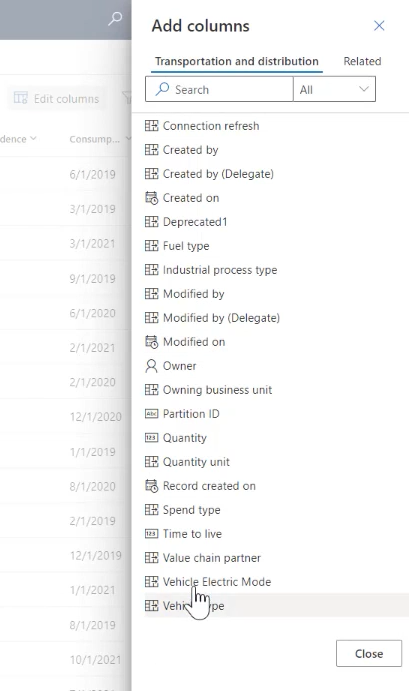
In the Edit columns: Transportation and distributions side panel, select Add columns.
Select Vehicle Electric Mode, and then select Close.
Change the order of the columns as needed. In this case, move Vehicle Electric Mode to appear after Description. Select Apply when done.
On the menu bar, select Create view, and then select Save changes to current view.
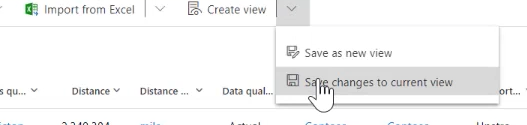
On the popup that says Filters have been saved for the current view, select OK.
Ingest data
Next, ingest activity data for transportation and distribution, the new Electric Mode reference data, and factors to map that data to. Each of these types of data follows the same process.
You can ingest data into Microsoft Sustainability Manager in four ways, which you can use to pull data in from just about any source:
- Manually
- From Excel or CSV files
- New connections through Power Query
- Prebuilt connectors
In this case, set up a new connection through Power Query.
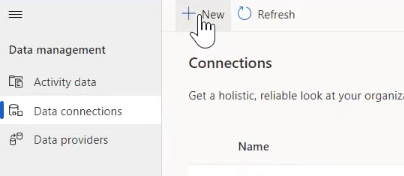
In Microsoft Sustainability Manager, under Data management in the left navigation pane, select Data connections, and then select New.
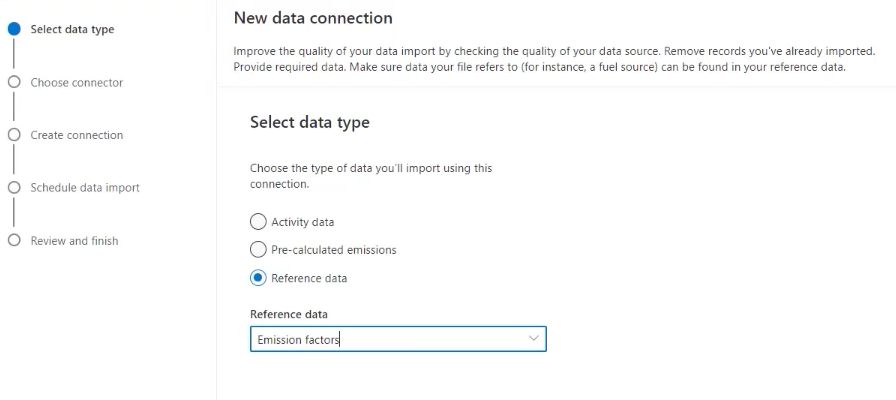
On the Select data type screen, select Reference data, select Emission factors, and then select Next.
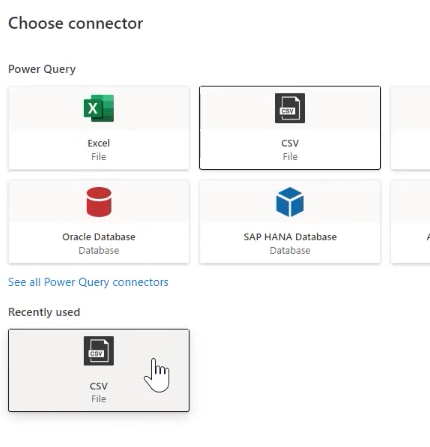
On the Choose connector screen, select CSV file.
On the Connect to data source screen, select the CSV file to link to, and then select Next.
On the Preview file data screen, verify the data, and then select Transform data.
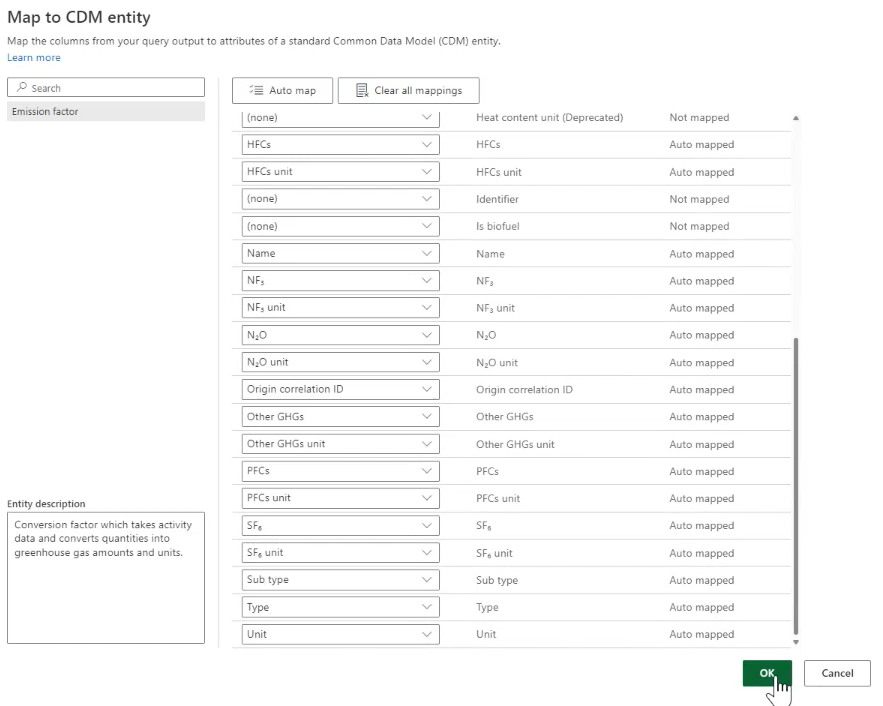
On the Power Query menu bar, select Map to entity. In the Map to CDM entity window, select Auto map, and then select OK.
On the Schedule data import screen, select Next.
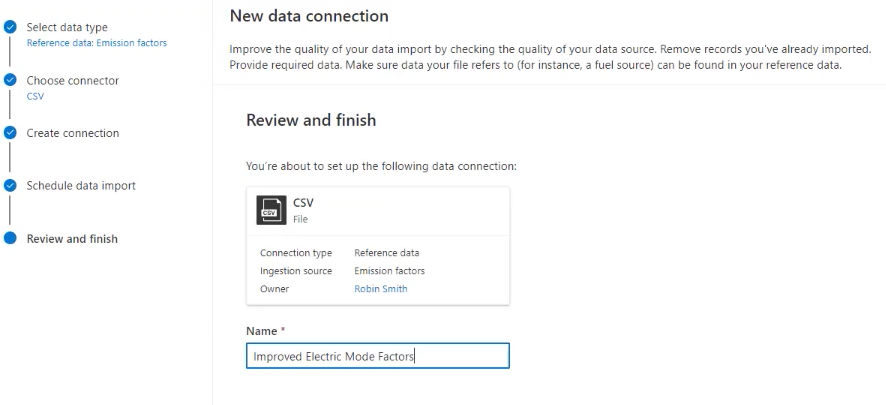
On the Review and finish screen, in the Name field, enter Improved Electric Mode Factors, and then select Connect.
When complete, select Done.


Calculate Scope 3 transportation emissions
The next step is to calculate Scope 3 transportation emissions. Use the following methods for calculations:
- Use prebuilt calculation models.
- Tailor calculations.
- Bring your own factor libraries.
- Bring precalculated emissions.
For this scenario, use custom data and formulas to generate more accurate results for your organization. You can use existing emission factors or update them as required. For more information about updating emission factors, see Emission factors.
Under Calculations in the left navigation pane, select Calculation models, and then select New.
Select + to add Source. In the Source Details pane, enter or select the following values:
Field Value Category name Upstream T&D with Electric Vehicles Activity data 4. Upstream transportation and distribution 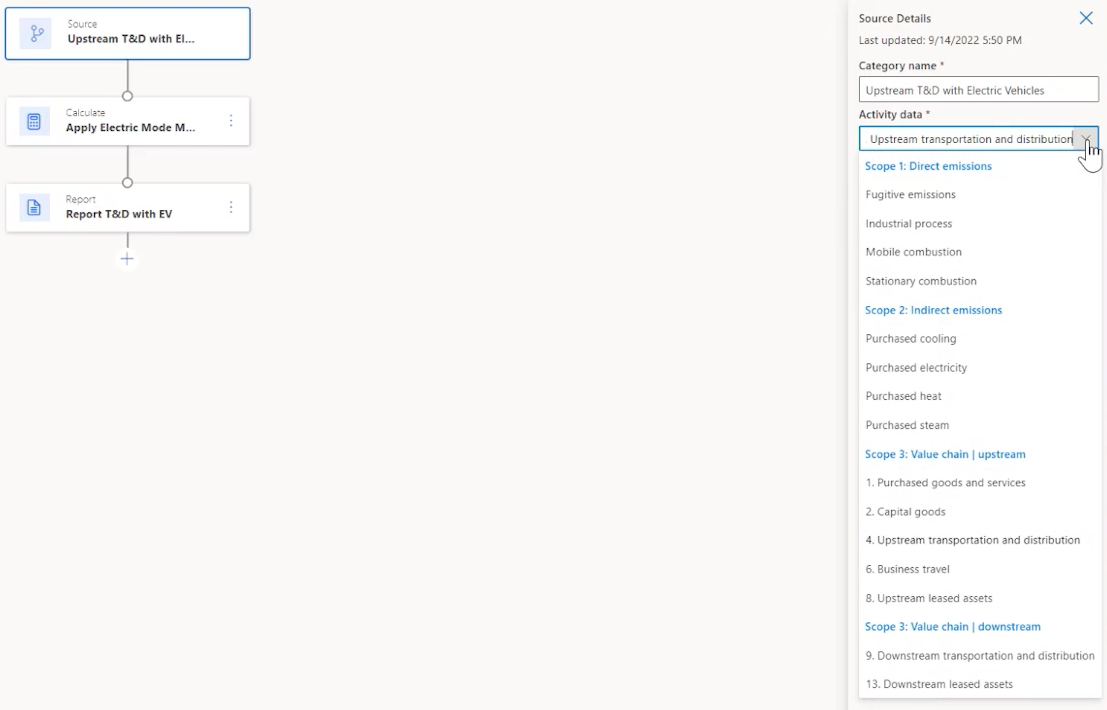
Select + to add Calculate. In the Calculate Details pane, enter or select the following values:
Field Value Category name Apply Electric Mode Multiplier Define calculate function (Copy and enter the text following this table, changing the variables as necessary. Change cr59b to the prefix assigned in your environment.) Output unit Distance Unit Output variable name EVDistance Activity.msdyn_distance*Activity.cr59b_tdvehicleelectricmode.cr59b_multiplier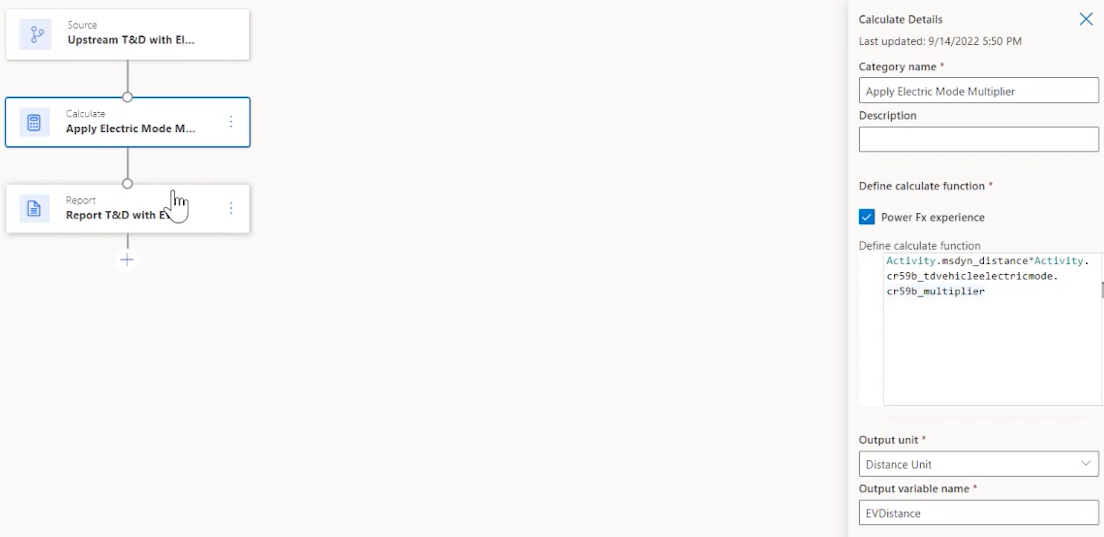
Select + to add Report. In the Report Details pane, enter or select the following values:
Field Value Category name Report T&D with EV Emission report value EVDistance Emission factor library Electric Mode Factors Emission factor Transport mode 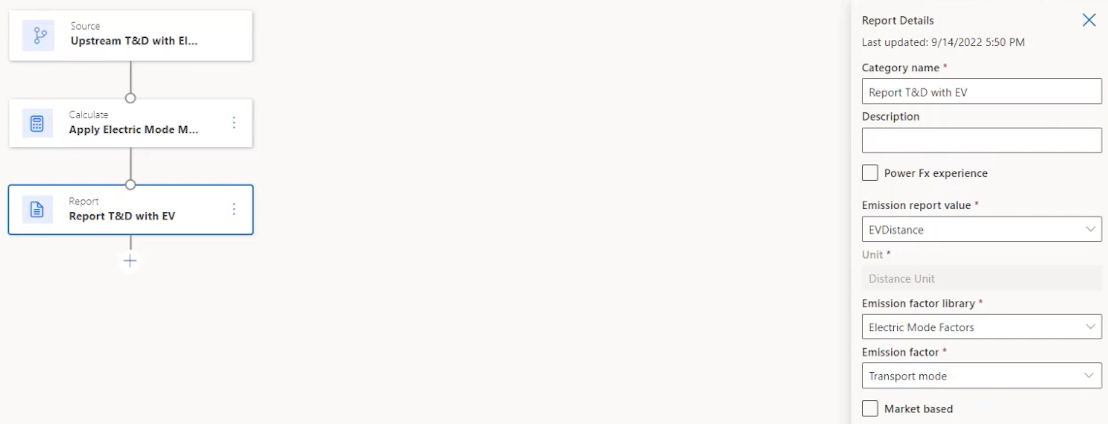
Select Save.


Enable a calculation profile
Calculation profiles narrow the data applied to a calculation and control the frequency of the calculation.
Under Calculations in the left navigation pane, select Calculation profiles, and then select New Calculation profile.
In the Calculation profile set up screen, enter or select the following values, and then select Next:
Field Value Calculation profile name Upstream T&D with Electric Vehicles (execute) Emissions source 4. Upstream transportation and distribution Activity data to include in calculation Vehicle Electric Mode | Contains data Calculation model Upstream T&D with Electric Vehicles 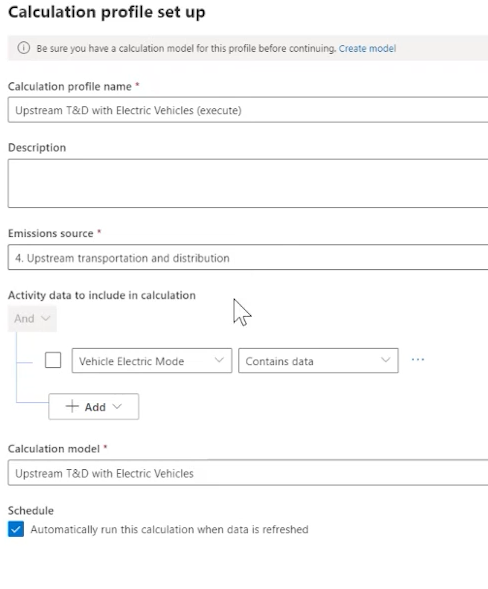
Verify the results and let it run.
View emissions
You can now see the results of your emissions reduction project.
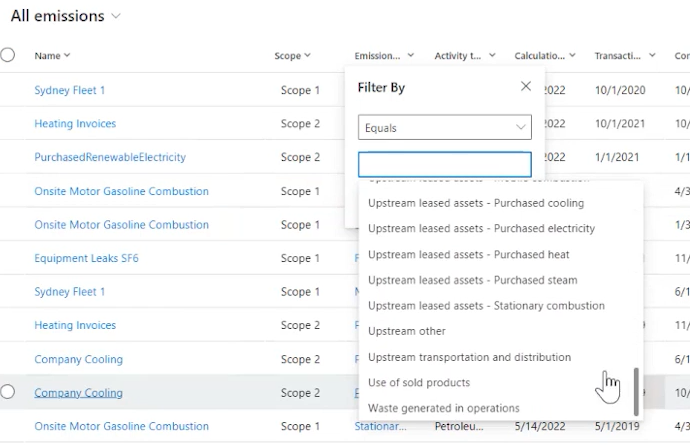
In the left navigation pane, select Analytics, and then select All emissions.
On the All emissions page, filter the Emissions column by Upstream transportation and distribution.
Related information
Microsoft for Sustainability data model
Emission factors
Record uniqueness in Microsoft Sustainability Manager.