Note
Access to this page requires authorization. You can try signing in or changing directories.
Access to this page requires authorization. You can try changing directories.
Use the Deep analysis report in Microsoft for Sustainability to dive deeper into data and uncover insights that might not be available from other reports.
In the left navigation under *Analytics, select Emissions insights.
In the top menu, select Deep analysis.
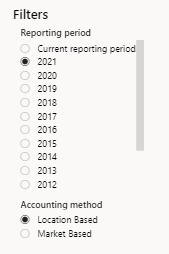
Under Filters, select a reporting period, and then select an accounting method:
- Location Based: Reflects the average emissions intensity of grids on which energy consumption occurs.
- Market Based: Reflects emissions from electricity you purposefully chosen.
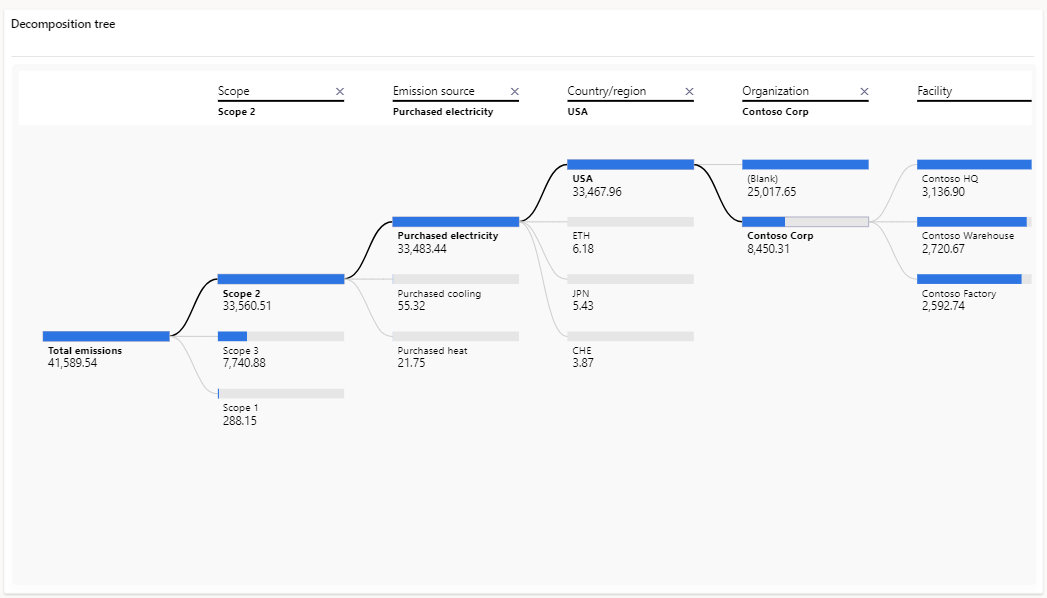
Use the Decomposition tree to drill down from the company level to more granular levels, including:
- Emission source
- Organization
- Scope
- Country/region
- Facility
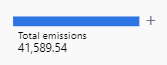
Choose how to split your data by selecting the + button next to Total emissions, and continue adding categories as needed.
Select branches on the Decomposition tree to gain insights into each category. Sequence the categories differently to gain further views of the data.