Note
Access to this page requires authorization. You can try signing in or changing directories.
Access to this page requires authorization. You can try changing directories.
The Security update status dashboard provides a fleet-wide view of security update currency across Windows client devices, Windows Server devices, and Microsoft 365 Apps. It helps administrators assess exposure, identify where segments of their fleet are not current on required security updates, and prioritize remediation across workloads based on relative risk.
At a high level, the dashboard answers one core question: Where am I at risk? It gives a concise summary of update posture. Use it as a starting point for triage and situational awareness, not for root-cause analysis.
Prerequisites
 Cloud requirements
This feature is supported in the public cloud environment only.
 Roles requirements
To view the dashboard, use an account with at least the permission Organization/Read in Intune role-based access control. Grant this access through a built-in Intune role or through a custom role.
 Data sources requirements
The dashboard can draw from multiple Microsoft management and reporting systems to provide a unified view of update posture across workloads. Depending on the workload, sources can include Microsoft Intune, Microsoft Configuration Manager through tenant attach, Microsoft Defender for Endpoint, the Microsoft 365 Apps admin center, and supporting application or device telemetry.
Source-specific prerequisites apply and vary by workload:
- Windows clients:
- Intune-managed devices: Intune enrollment and the required reporting path for update data.
- Configuration Manager-managed devices: Co-management or another supported cloud-connected reporting configuration.
- Microsoft 365 Apps: Onboard to the Microsoft 365 Apps admin center, with the required inventory and service connectivity enabled.
- Windows Server: A supported cloud-connected path, such as tenant attach or MDE related onboarding.
Validate requirements per workload before relying on the dashboard for operational decisions.
How to access the dashboard
- In the Microsoft Intune admin center, select Devices > Monitor.
- Select Security update status to open the dashboard.
What the dashboard shows
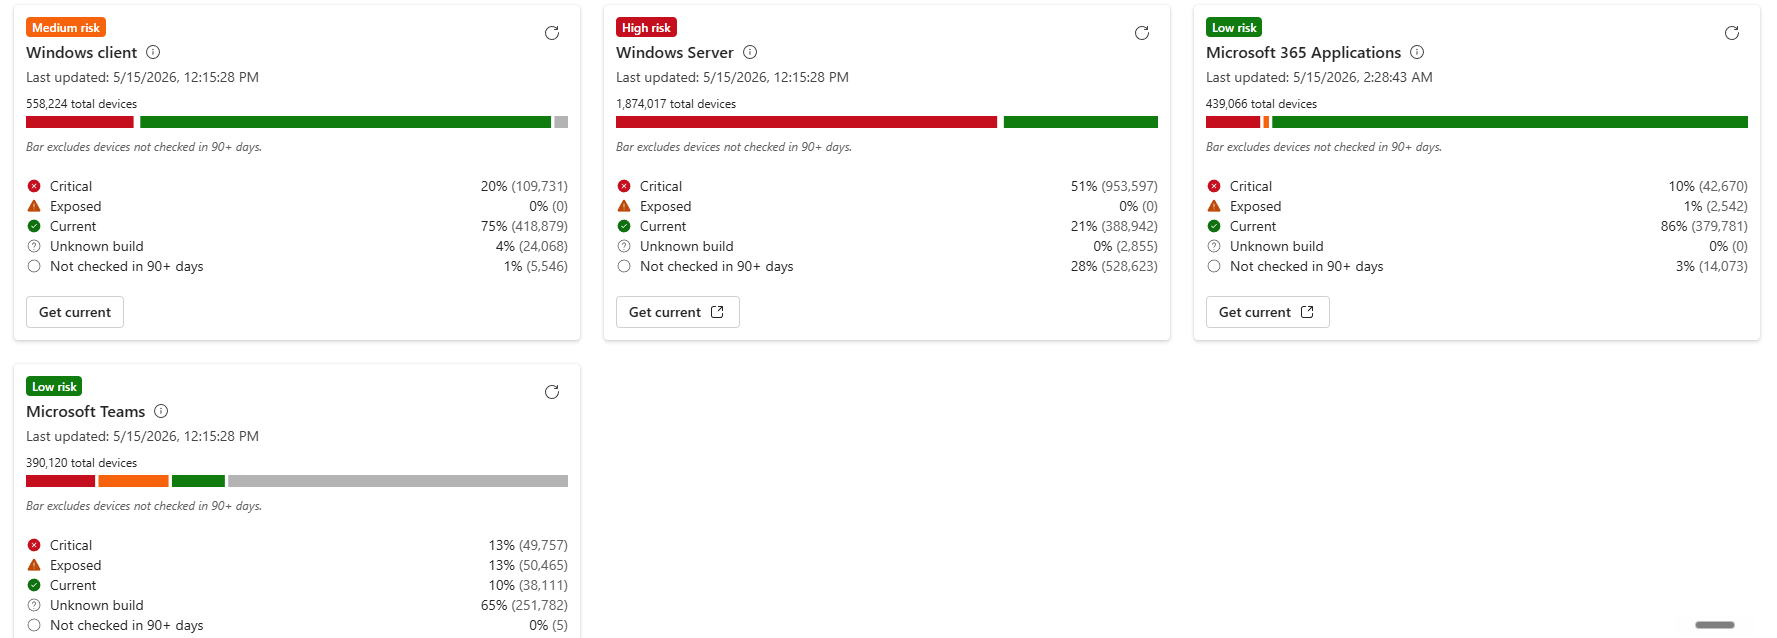
The dashboard is organized around workload tiles that summarize update status and risk across major product areas. The primary workloads are Windows client, Windows Server, and Microsoft 365 Apps.
- Risk level, such as Current, Exposed, or Critical
- Status distribution across device states
- Total device count
- Last updated timestamp for the report data shown in the tile, reflecting the dashboard refresh that occurs every six hours
- A breakdown of device state categories
- An action entry point, such as Get current, to initiate update actions and remediation
Color-coding is used to quickly communicate status: green indicates Current, orange indicates Exposed, red indicates Critical, and gray indicates an unknown or inactive state. Devices that don't check in for 90 days or more appear outside the primary status calculation so that stale data doesn't distort active risk reporting.
Status definitions
The dashboard groups devices into status categories that represent how current these devices are relative to expected security update baselines.
| Icon | Risk level | Description |
|---|---|---|
 |
Current | Devices have the latest applicable security update installed, or are on the previous update within the short grace period immediately after a new release. |
 |
Exposed | Devices are behind the latest applicable security update and moved beyond the initial grace period. In general, this status begins after roughly the first three days following a newly applicable update release. |
 |
Critical | Devices are missing required updates long enough to represent materially higher risk. In general, devices that remain behind for a week or longer can move into this state, and unsupported versions are also treated as critical risk. |
 |
Unknown build | The reported device version can't be mapped to a known supported release or update baseline. |
 |
Not checked in (90+ days) | The device didn't report recently and is excluded from primary risk calculations to keep the dashboard focused on active fleet posture. |
After a newly released security update becomes applicable, devices on the previous update may remain classified as Current for a short period so the dashboard reflects normal deployment propagation instead of immediately treating the entire fleet as newly at risk.
Risk levels
Use the distribution of devices across Current, Exposed, and Critical states to determine an overall risk level for each workload. This level isn't tracked in the dashboard and should be defined by the organization and its security posture to inform prioritization. These levels provide a fast, high-signal indicator of where administrators should focus first.
- Low risk: At least 85% of devices are Current.
- Medium risk: 51% to 84% of devices are Current.
- High risk: 50% or fewer devices are Current.
Risk level simplifies prioritization; it doesn't replace deeper investigation. A medium- or high-risk tile should lead to follow-up reporting that explains which devices are affected, why they're behind, and whether the cause is deployment timing, reporting latency, onboarding gaps, or unsupported versions.
Why Windows Autopatch reporting matters
The dashboard shows where risk exists, but additional reporting often explains why devices are behind and what remediation path is most appropriate. Devices can appear as Exposed or Critical for several reasons beyond simply missing an update: a device might not be targeted by the intended policy, might be delayed by deployment settings, or might not be reporting as expected.
Windows Autopatch reporting helps administrators move from a summary of risk to a clearer view of policy alignment, coverage, and update management status. For supporting guidance, see:
- Windows Autopatch update readiness overview
- Windows Autopatch management status report
- Windows quality and feature update reports overview
Devices can also appear as Exposed or Critical during an active phased rollout. The dashboard reflects exposure based on update currency, not whether your deployment schedule is proceeding as planned. Rollout rings and staged deployment strategies aren't modeled directly in the dashboard state.
Example workflow
To investigate and reduce risk surfaced by the dashboard:
- Review the Security update status dashboard and identify the workload with the highest risk.
- Open Windows Autopatch or Intune reporting to investigate the affected device populations.
- Review quality update, feature update, or app update compliance details.
- Analyze policy targeting and assignment coverage.
- Adjust update policies or remediation steps as needed.
- Return to the dashboard to confirm that device currency improves as remediation continues.
Limitations
- The dashboard reflects supported Microsoft workloads and doesn't include third-party update visibility.
- The dashboard is a snapshot view of current posture. It doesn't model rollout rings or staged deployment logic directly.
- You can't remediate from the dashboard. Use the underlying management tools, such as Intune or Configuration Manager.
- The dashboard doesn't provide historical trend tracking.
- The dashboard is an aggregate estate view and might not honor every filtering expectation used in other reporting experiences.