Note
Access to this page requires authorization. You can try signing in or changing directories.
Access to this page requires authorization. You can try changing directories.
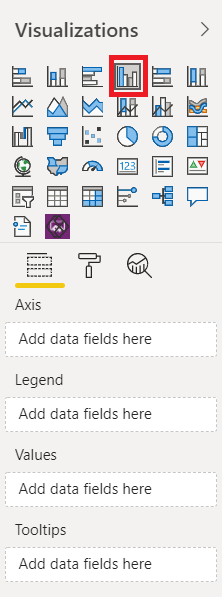
A visual's capabilities are data roles that the visualization type can accept. For example, this image shows the visual capabilities of a clustered column chart in the Visualization pane.
Get a visual's capabilities to determine what data is displayed at the report or visual level. Both of the APIs used to get capabilities return IVisualCapabilities.
export interface IVisualCapabilities {
  dataRoles?: IVisualDataRole[];
}
dataRoles define the roles a visual expects and how those roles should be populated. This data is required to use the following visual data binding APIs. Each of these APIs expects the target dataRole name as the input parameter.
dataRoles are represented by the IVisualDataRole interface:
interface IVisualDataRole {
    name: string;
    kind: VisualDataRoleKind;
    kindPreference?: VisualDataRoleKindPreference;
    displayName?: string;
    description?: string;
}
- name - Unique identifier for
VisualDataRole. - kind - Indicates the kind of role for the visual data.
- kindPreference - Indicates the visual preference on what kind of role to use.
- displayName - The display name of the role.
- description - The text for the tooltip.
You can retrieve visual metadata for both out-of-the-box and custom visuals installed on the report.
How to get visual capabilities at the report level
Use the getVisualCapabilities API to find the the visual data that displays at the report level.
getVisualCapabilities(visualType: string): Promise<models.IVisualCapabilities>
Example
Below is a code example for finding the capabilities in a bar chart visual at the report level.
let capabilities = await report.getVisualCapabilities('barChart');
How to get visual capabilities at the visual level
Use the getCapabilities API to determine what data displays at the visual level.
getCapabilities(): Promise<models.IVisualCapabilities>
Example
Below is a code example for finding the capabilities in a visual at the visual level.
let capabilities = await visual.getCapabilities();
For instance, getting the capabilities for a clusteredColumnChart returns the following:
{
    "dataRoles": [
        {
            "name": "Category",
            "displayName": "Axis",
            "description": "Fields to place on the horizontal or vertical axis",
            "kind": 0
        },
        {
            "name": "Series",
            "displayName": "Legend",
            "description": "The categorical field to show for color",
            "kind": 0
        },
        {
            "name": "Y",
            "displayName": "Values",
            "description": "The numeric amounts to plot",
            "kind": 1
        },
        {
            "name": "Rows",
            "displayName": "Small multiples",
            "description": "Split your visual into multiple, smaller visuals based on your selected fields",
            "kind": 0
        },
        {
            "name": "Tooltips",
            "displayName": "Tooltips",
            "description": "Add additional data fields that people can see in the tooltip when they hover on part of this visualization.",
            "kind": 1
        }
    ]
}