Note
Access to this page requires authorization. You can try signing in or changing directories.
Access to this page requires authorization. You can try changing directories.
When creating a Power BI embedded analytics application, Angular can help quickly set up a maintainable, scalable app. Angular adds structure and design patterns to front-end development, allowing developers to create more advanced web applications that are easier to maintain and update.
The Power BI Angular library lets you embed the following Power BI items into your Angular application:
- Reports
- Dashboards
- Dashboard tiles
- Report visuals
- Q&A
- Paginated reports
How to embed Power BI content in an Angular web app
This section describes how to import Angular into your app and use it to embed a Power BI report.
For detailed usage information, see the Power BI Angular readme file.
Import the Angular library
You can find the Power BI Angular component on NPM. It's also open sourced on GitHub.
To import Angular into your web app, add the imports listed below.
import { PowerBIEmbedModule } from 'powerbi-client-angular';

@NgModule({
  imports: [
    ...
    ...
    PowerBIEmbedModule
  ],
  exports: ...,
  declarations: ...
})
Embed the report with Angular
This example shows how to embed a Power BI report using Angular. Below the example is a description of each component in the code sample.
<powerbi-report
    [embedConfig] = {{
        type: "report",
        id: "<Report Id>",
        embedUrl: "<Embed Url>",
        accessToken: "<Access Token>",
        tokenType: models.TokenType.Embed,
        settings: {
            panes: {
                filters: {
                    expanded: false,
                    visible: false
                }
            },
            background: models.BackgroundType.Transparent,
        }
    }}

    [cssClassName] = { "reportClass" }

    [phasedEmbedding] = { false }

    [eventHandlers] = {
        new Map([
            ['loaded', () => console.log('Report loaded');],
            ['rendered', () => console.log('Report rendered');],
            ['error', (event) => console.log(event.detail);]
        ])
    }
>
</powerbi-report>
The following list includes descriptions or additional information for each component in the code snippet example.
embedConfig - Defines the content that you're embedding, and specifies the content's settings. The embed configuration changes when you embed the following Power BI items:
eventHandlers - A map object for event names and their handlers. See How to handle events for more information.
cssClassName - Gives the embedded item a CSS class names that let you control the style of the embedded iframe using CSS.
phasedEmbedding - Improves the end-user's experience by giving developers more flexibility to phase report embedding. See Use phased embedding for more information.
Bootstrap a Power BI report
powerbi.bootstrap is a method used to help developers embed Power BI items faster and get better performance. For more information, see Use bootstrap for better performance.
<powerbi-report
    [embedConfig] = {{
        type: "report",
        id: undefined,
        embedUrl: undefined,
        accessToken: undefined, // Keep as empty string, null or undefined
        tokenType: models.TokenType.Embed,
        hostname: "https://app.powerbi.com"
    }}
>
</powerbi-report>
To embed the report after bootstrapping, update the embedConfig (with at least accessToken and embedUrl).
Angular demo
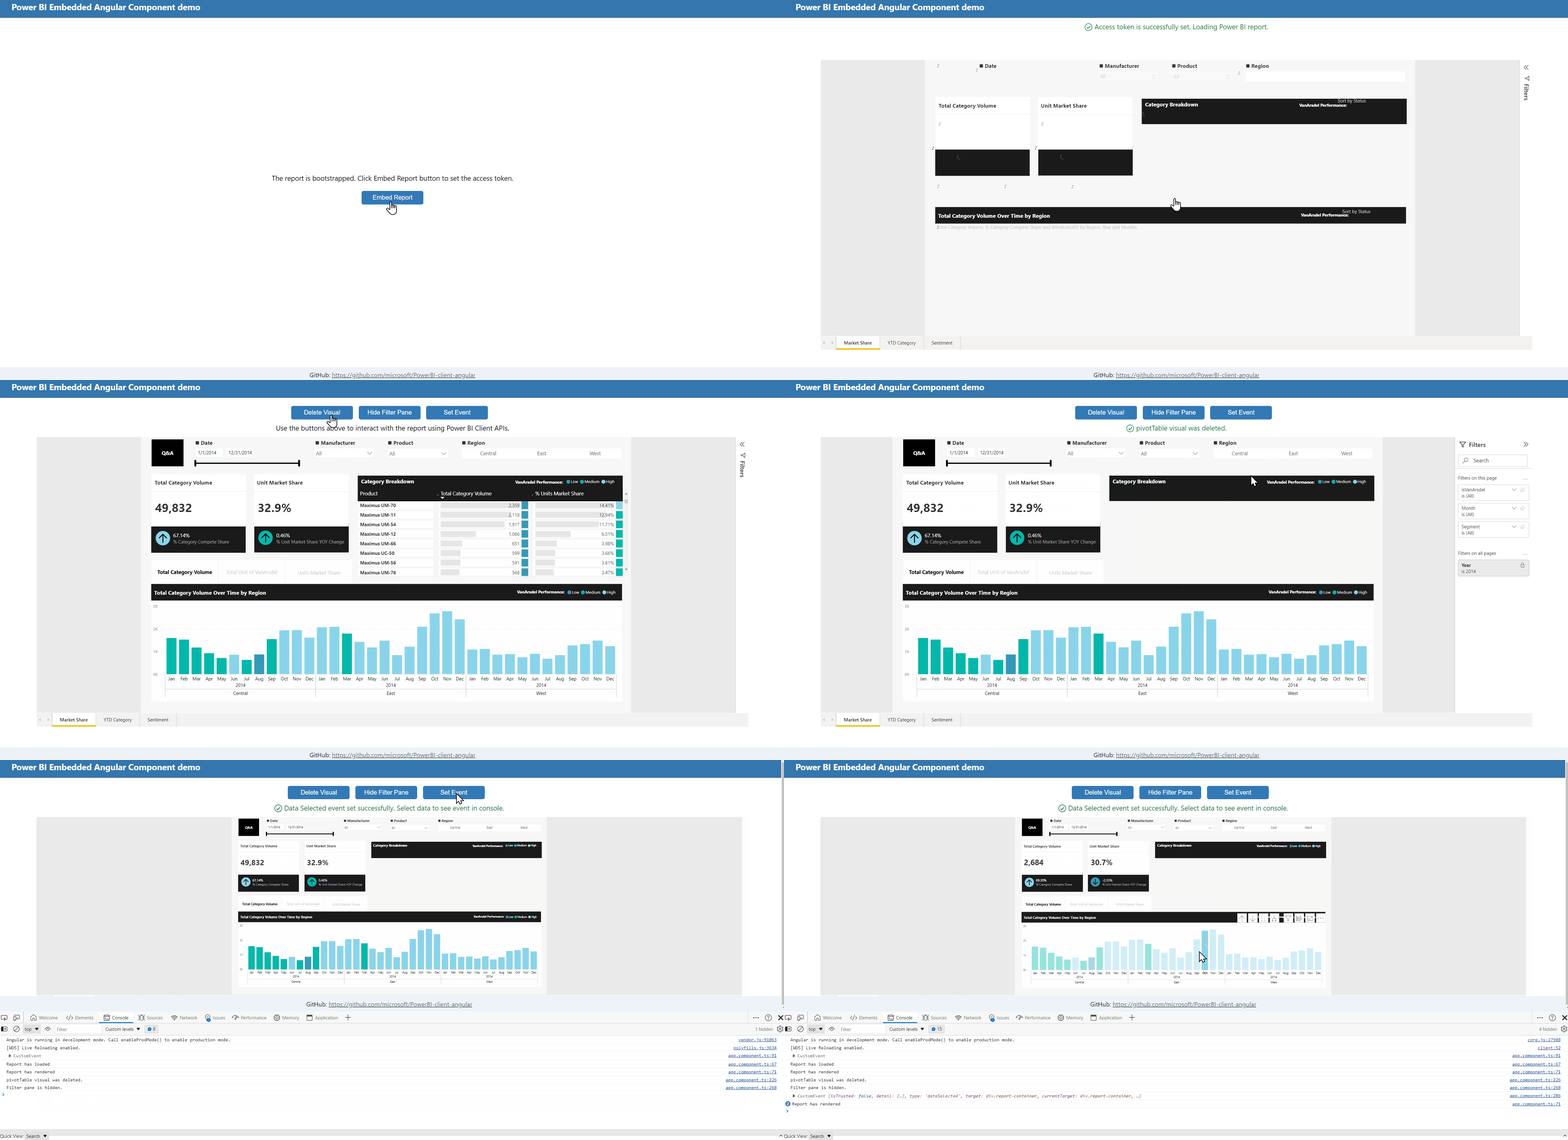
The Angular repository includes a demo that embeds a sample report using the PowerBIReportEmbed component. It demonstrates the complete flow from bootstrapping the report, to embedding and updating the embedded report. It also demonstrates the usage of the powerbi report authoring library by deleting a visual from a report upon clicking the Delete a Visual button. It also sets a 'DataSelected' event.
For more information, see the demo section of the readme file.

Run the demo
The demo is a subfolder in the repository. To run the demo on localhost, follow these steps:
Run the following commands:
npm run demoTo view in your browser, redirect it to
http:/localhost:4200/.